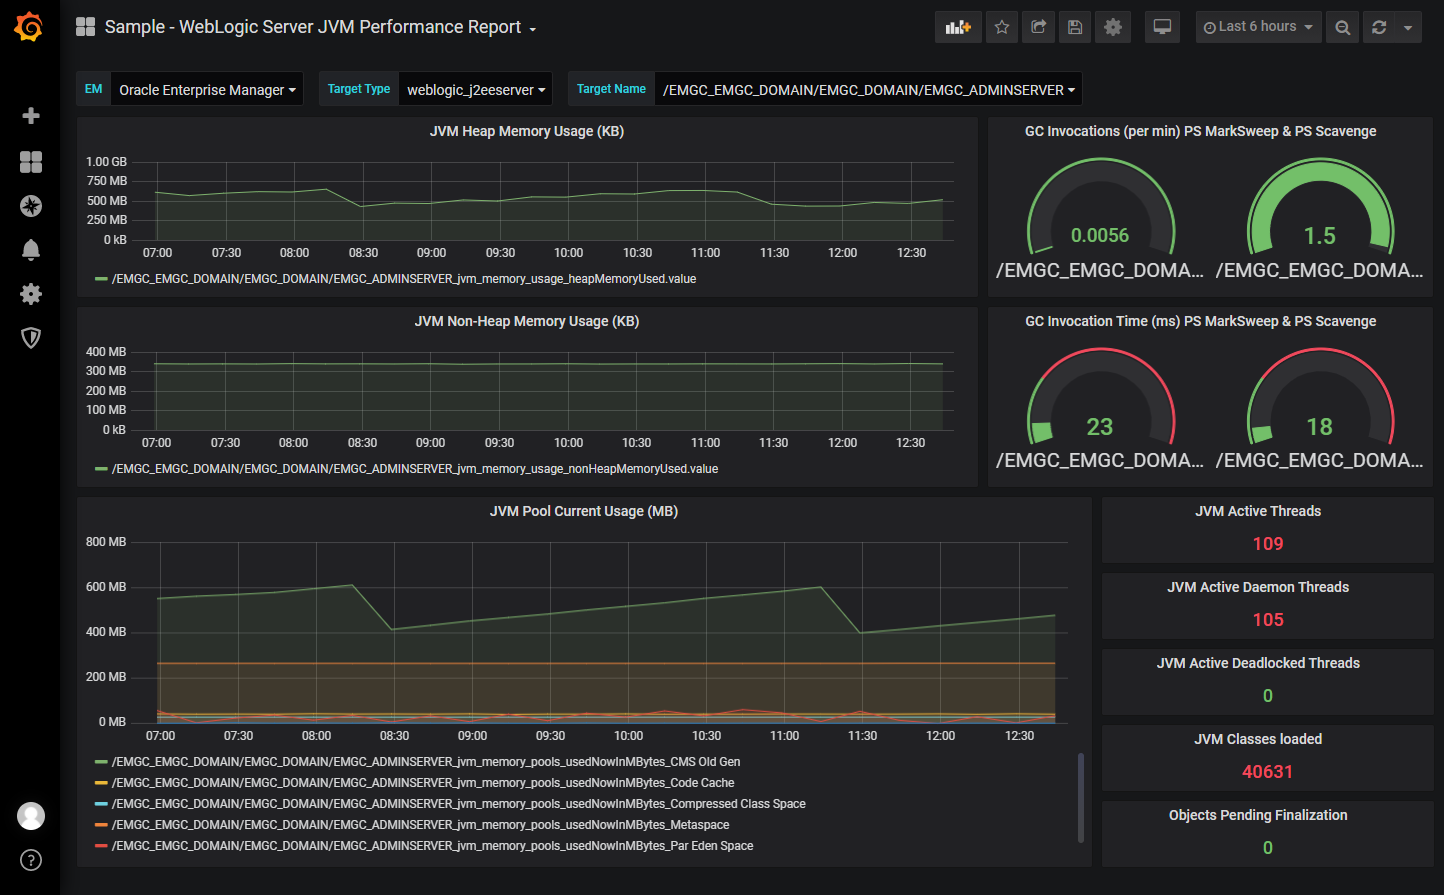
Sample Dashboards
The following dashboards demonstrate the information display flexibility you have using Grafana.
Dashboard with different series types:
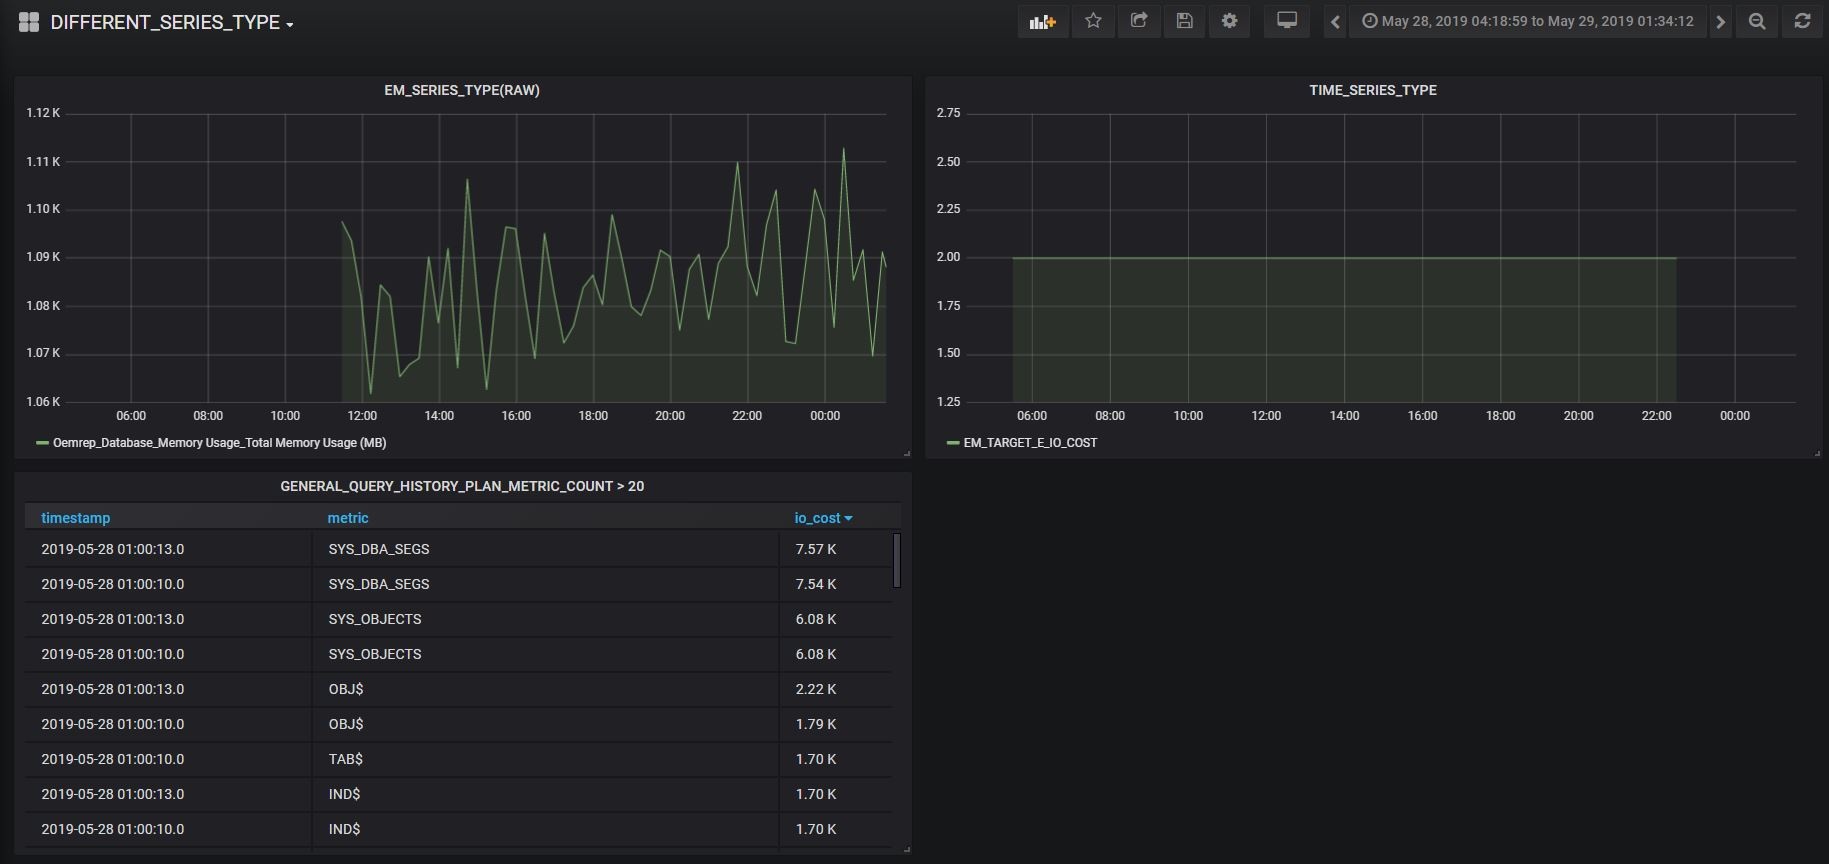
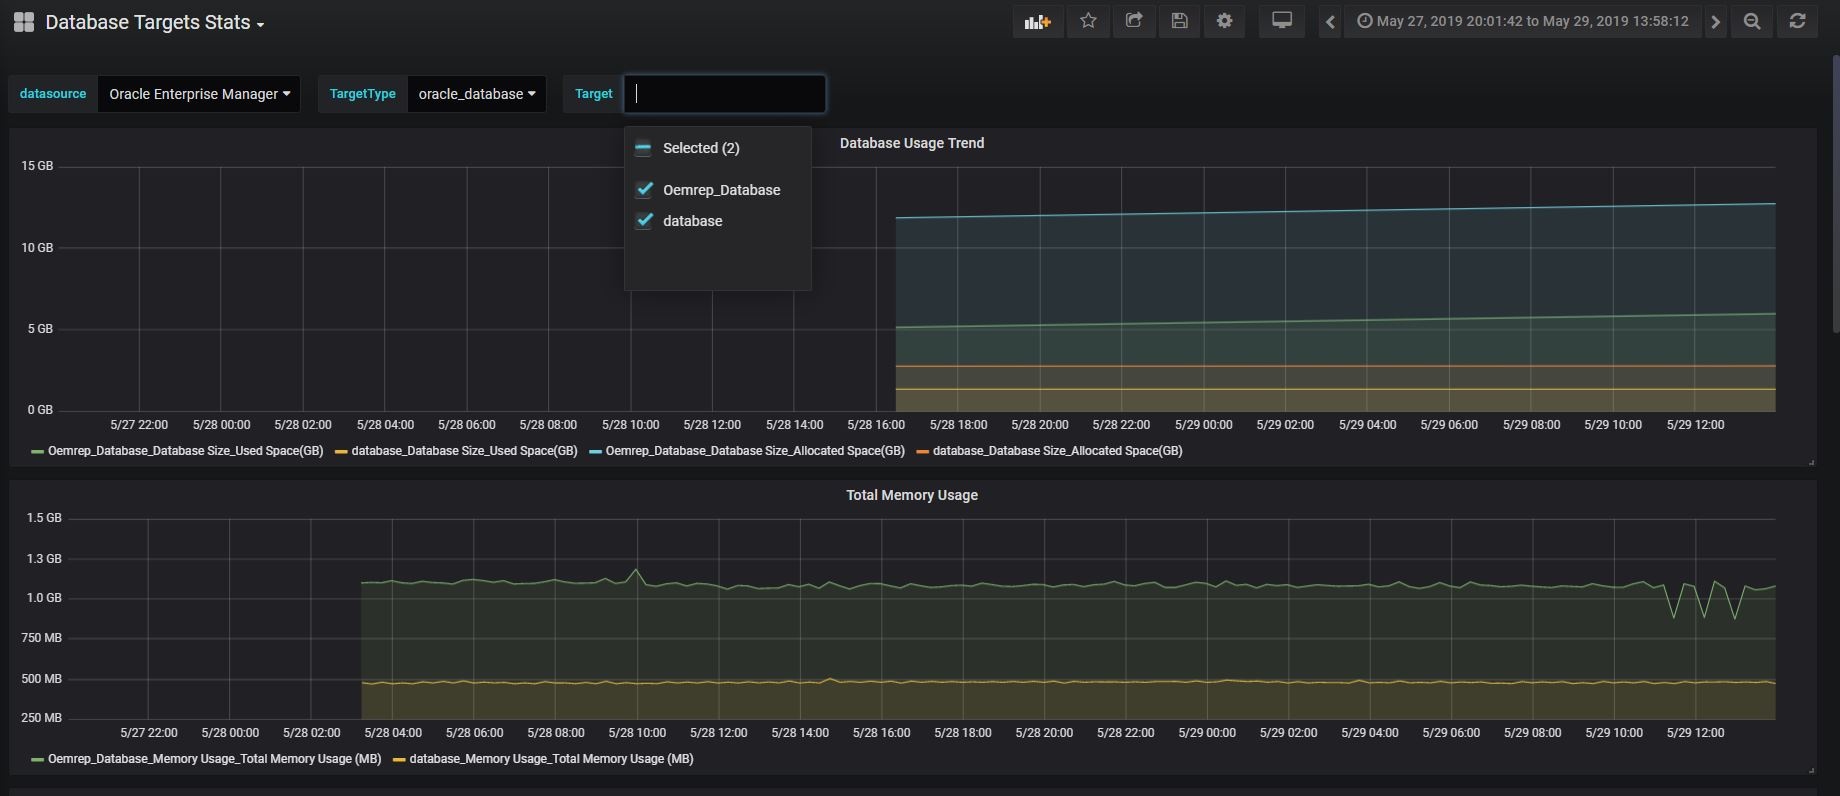
Dashboard with single target type and multiple targets ( Data from a Single Enterprise Manager site, multiple targets) :
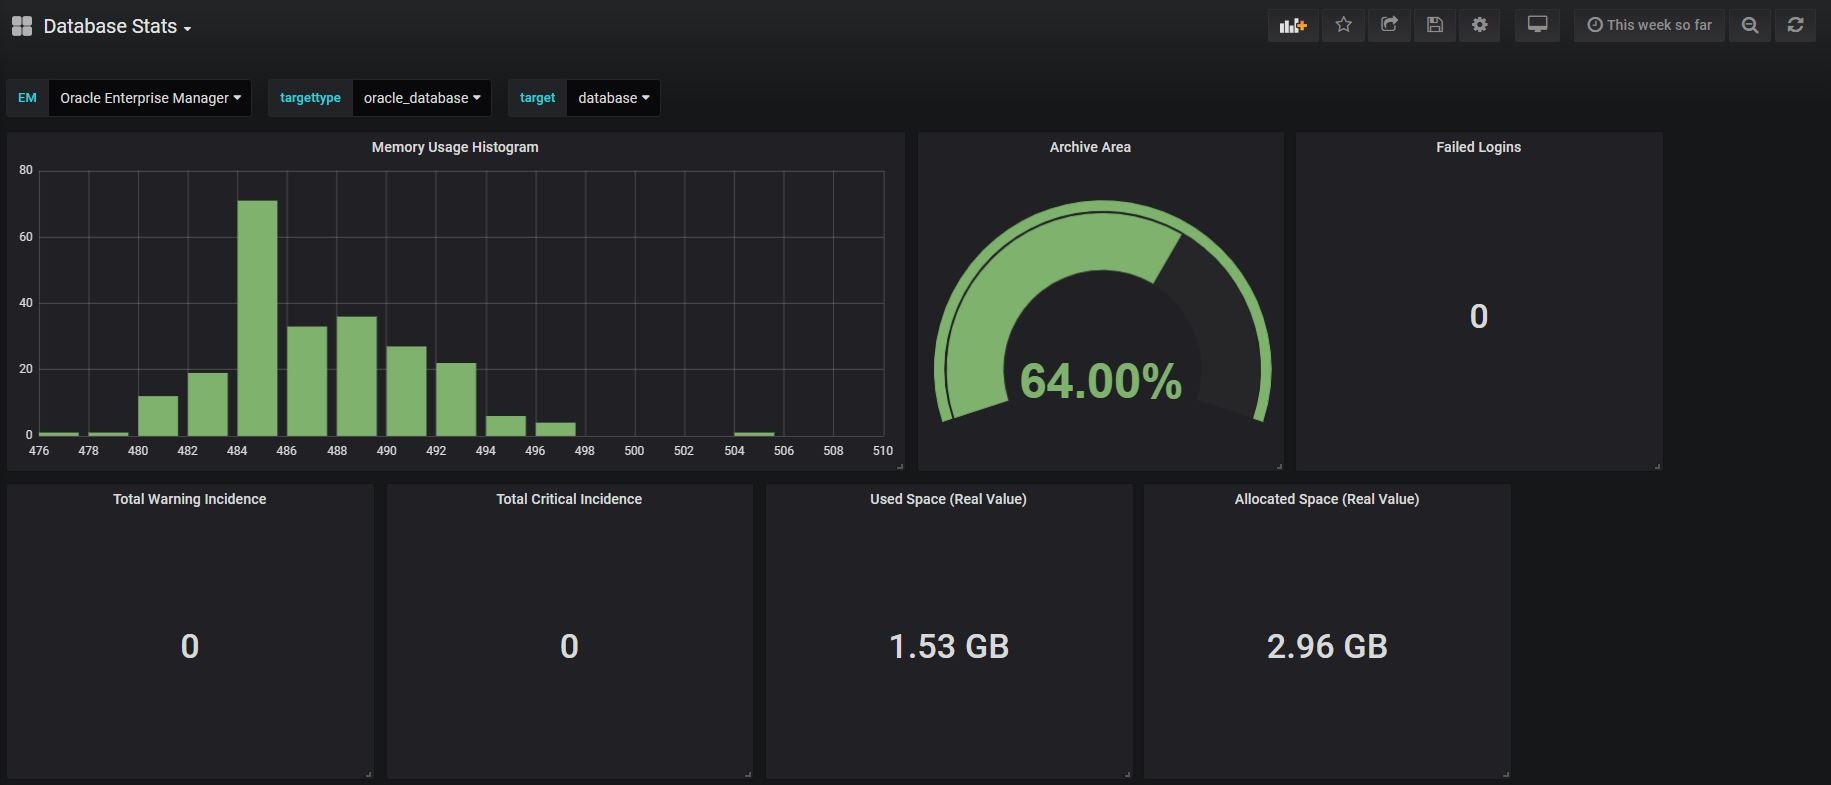
Dashboard with single target type and single target selection( Data from a single Enterprise Manager site, single targets):
Dashboard with separate panels, pulling data from the different Enterprise Manager sites ( Data from multiple Enterprise Manager sites, multiple targets) :
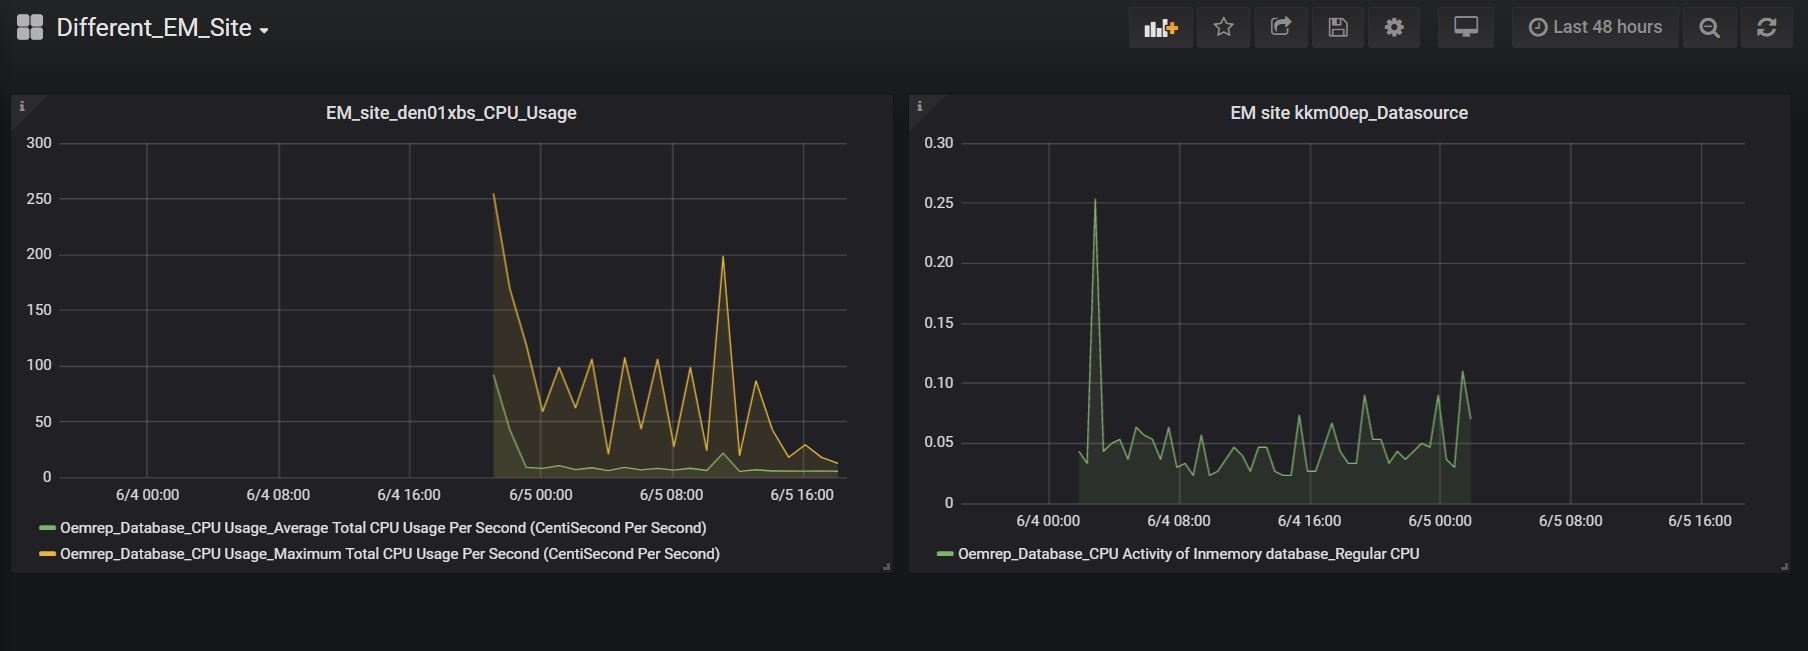
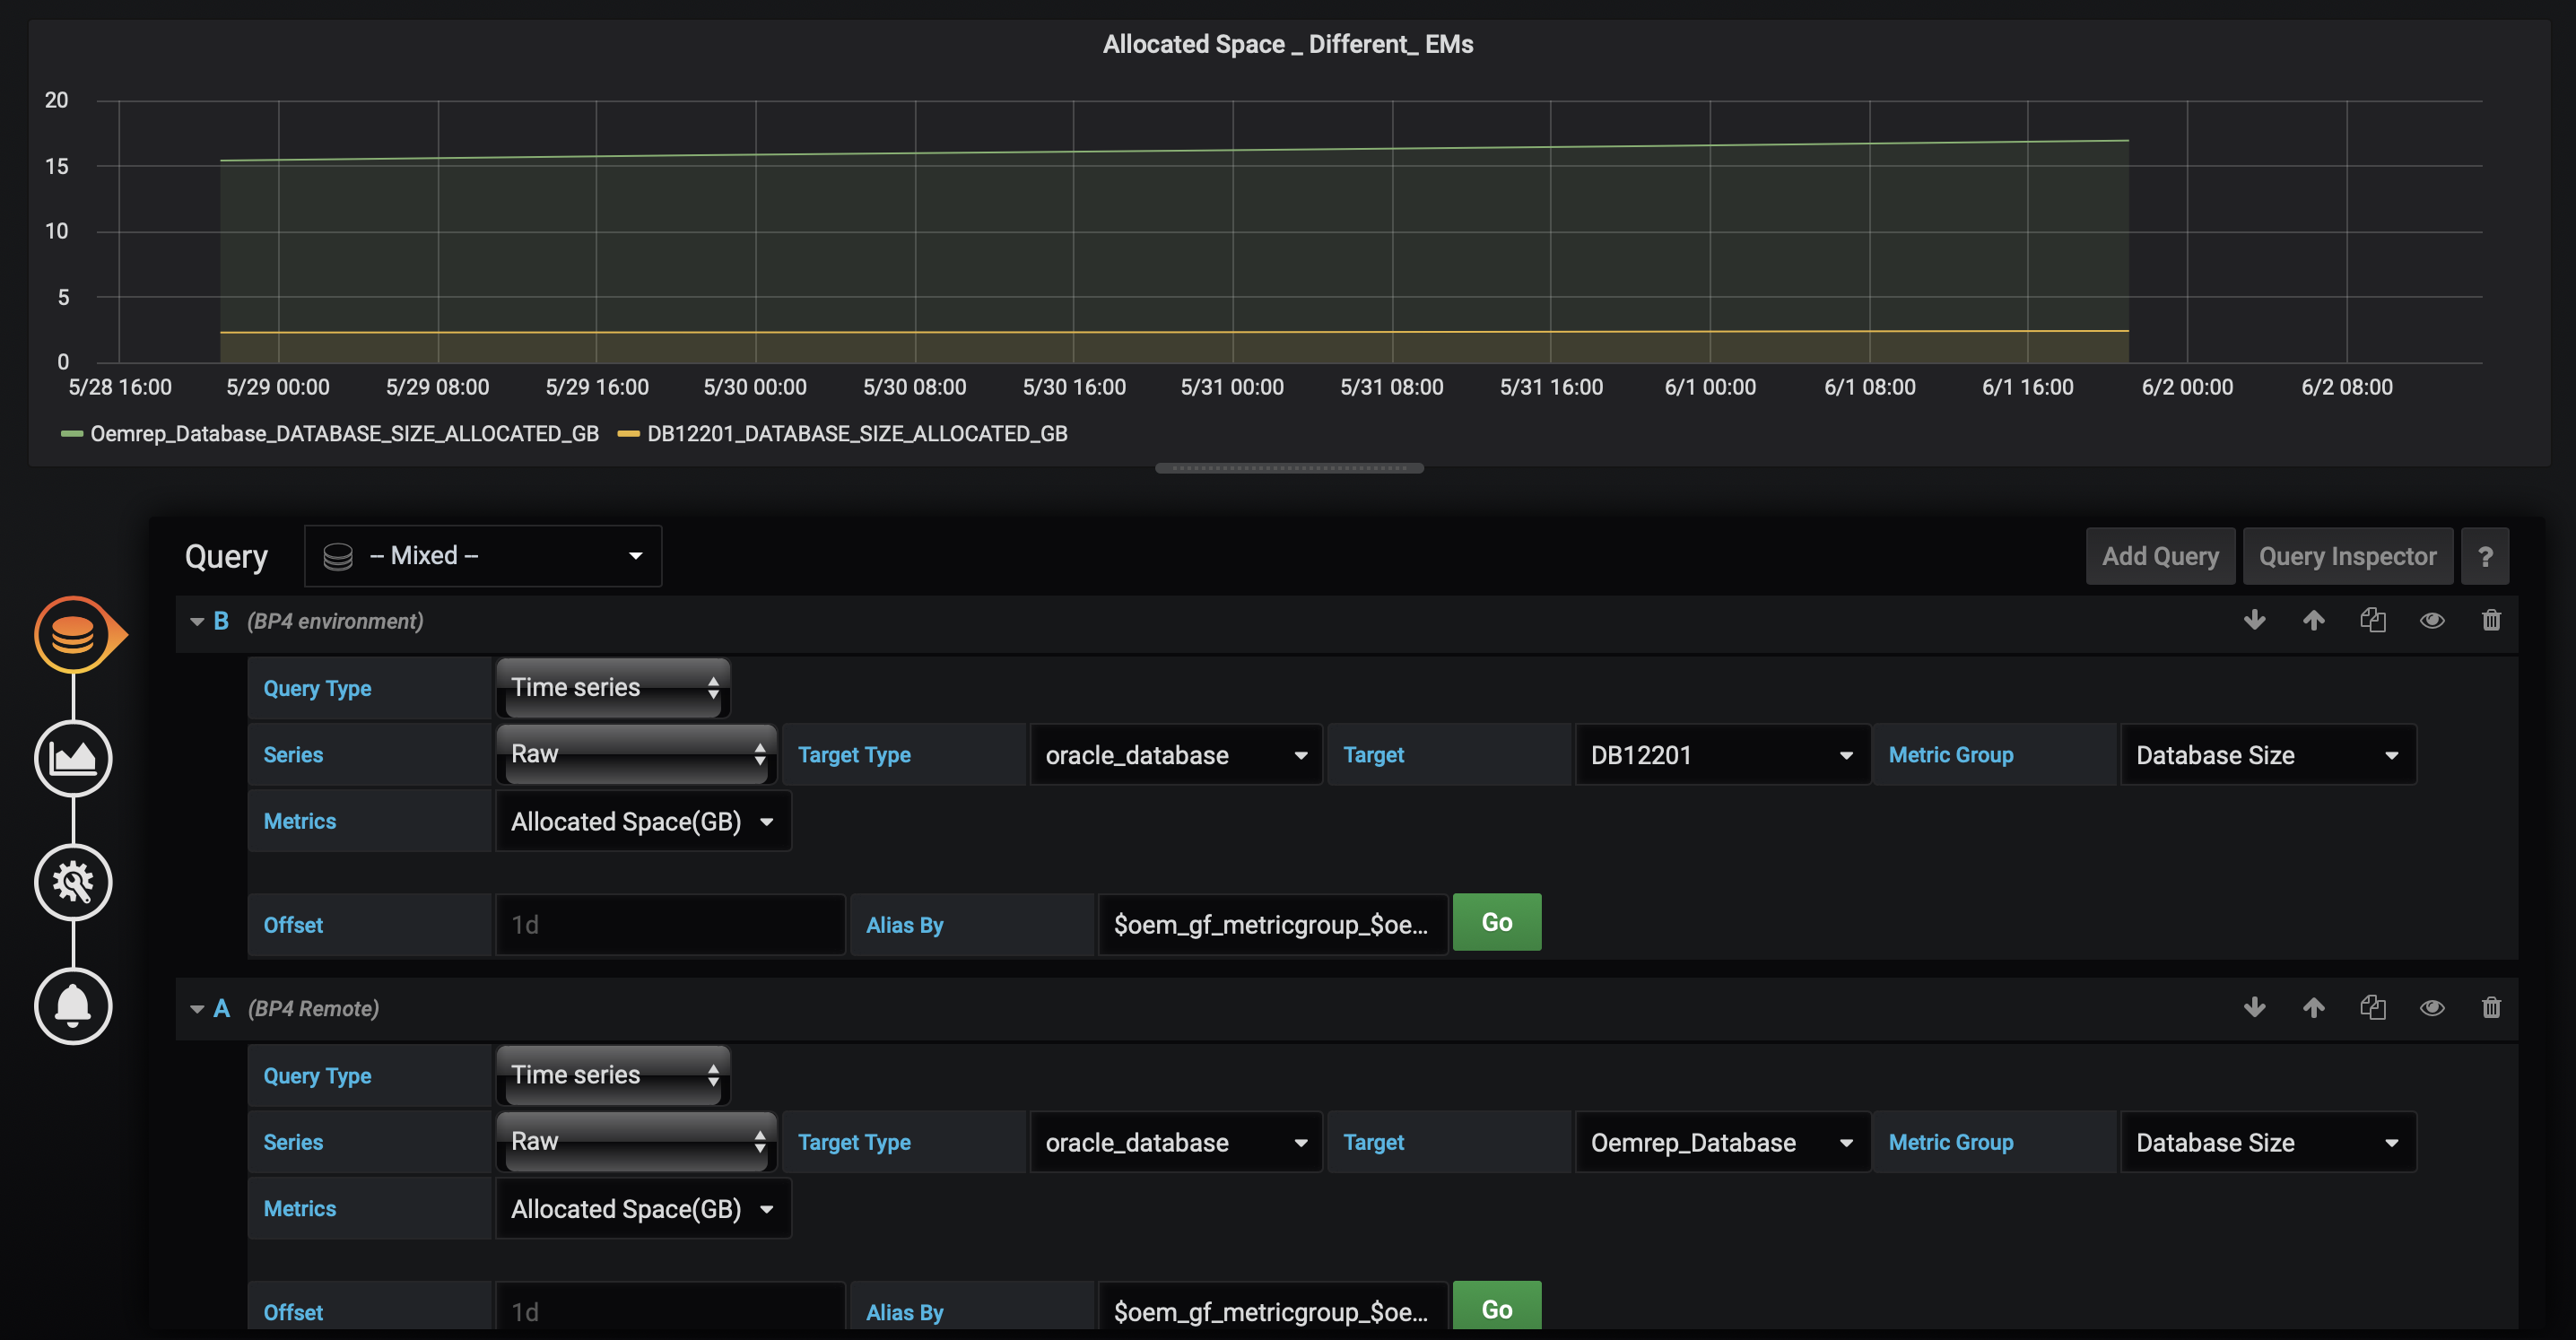
Dashboard with a single panel pulling data from a different Enterprise Manager sites (Data from multiple Enterprise Manager sites , single panel):
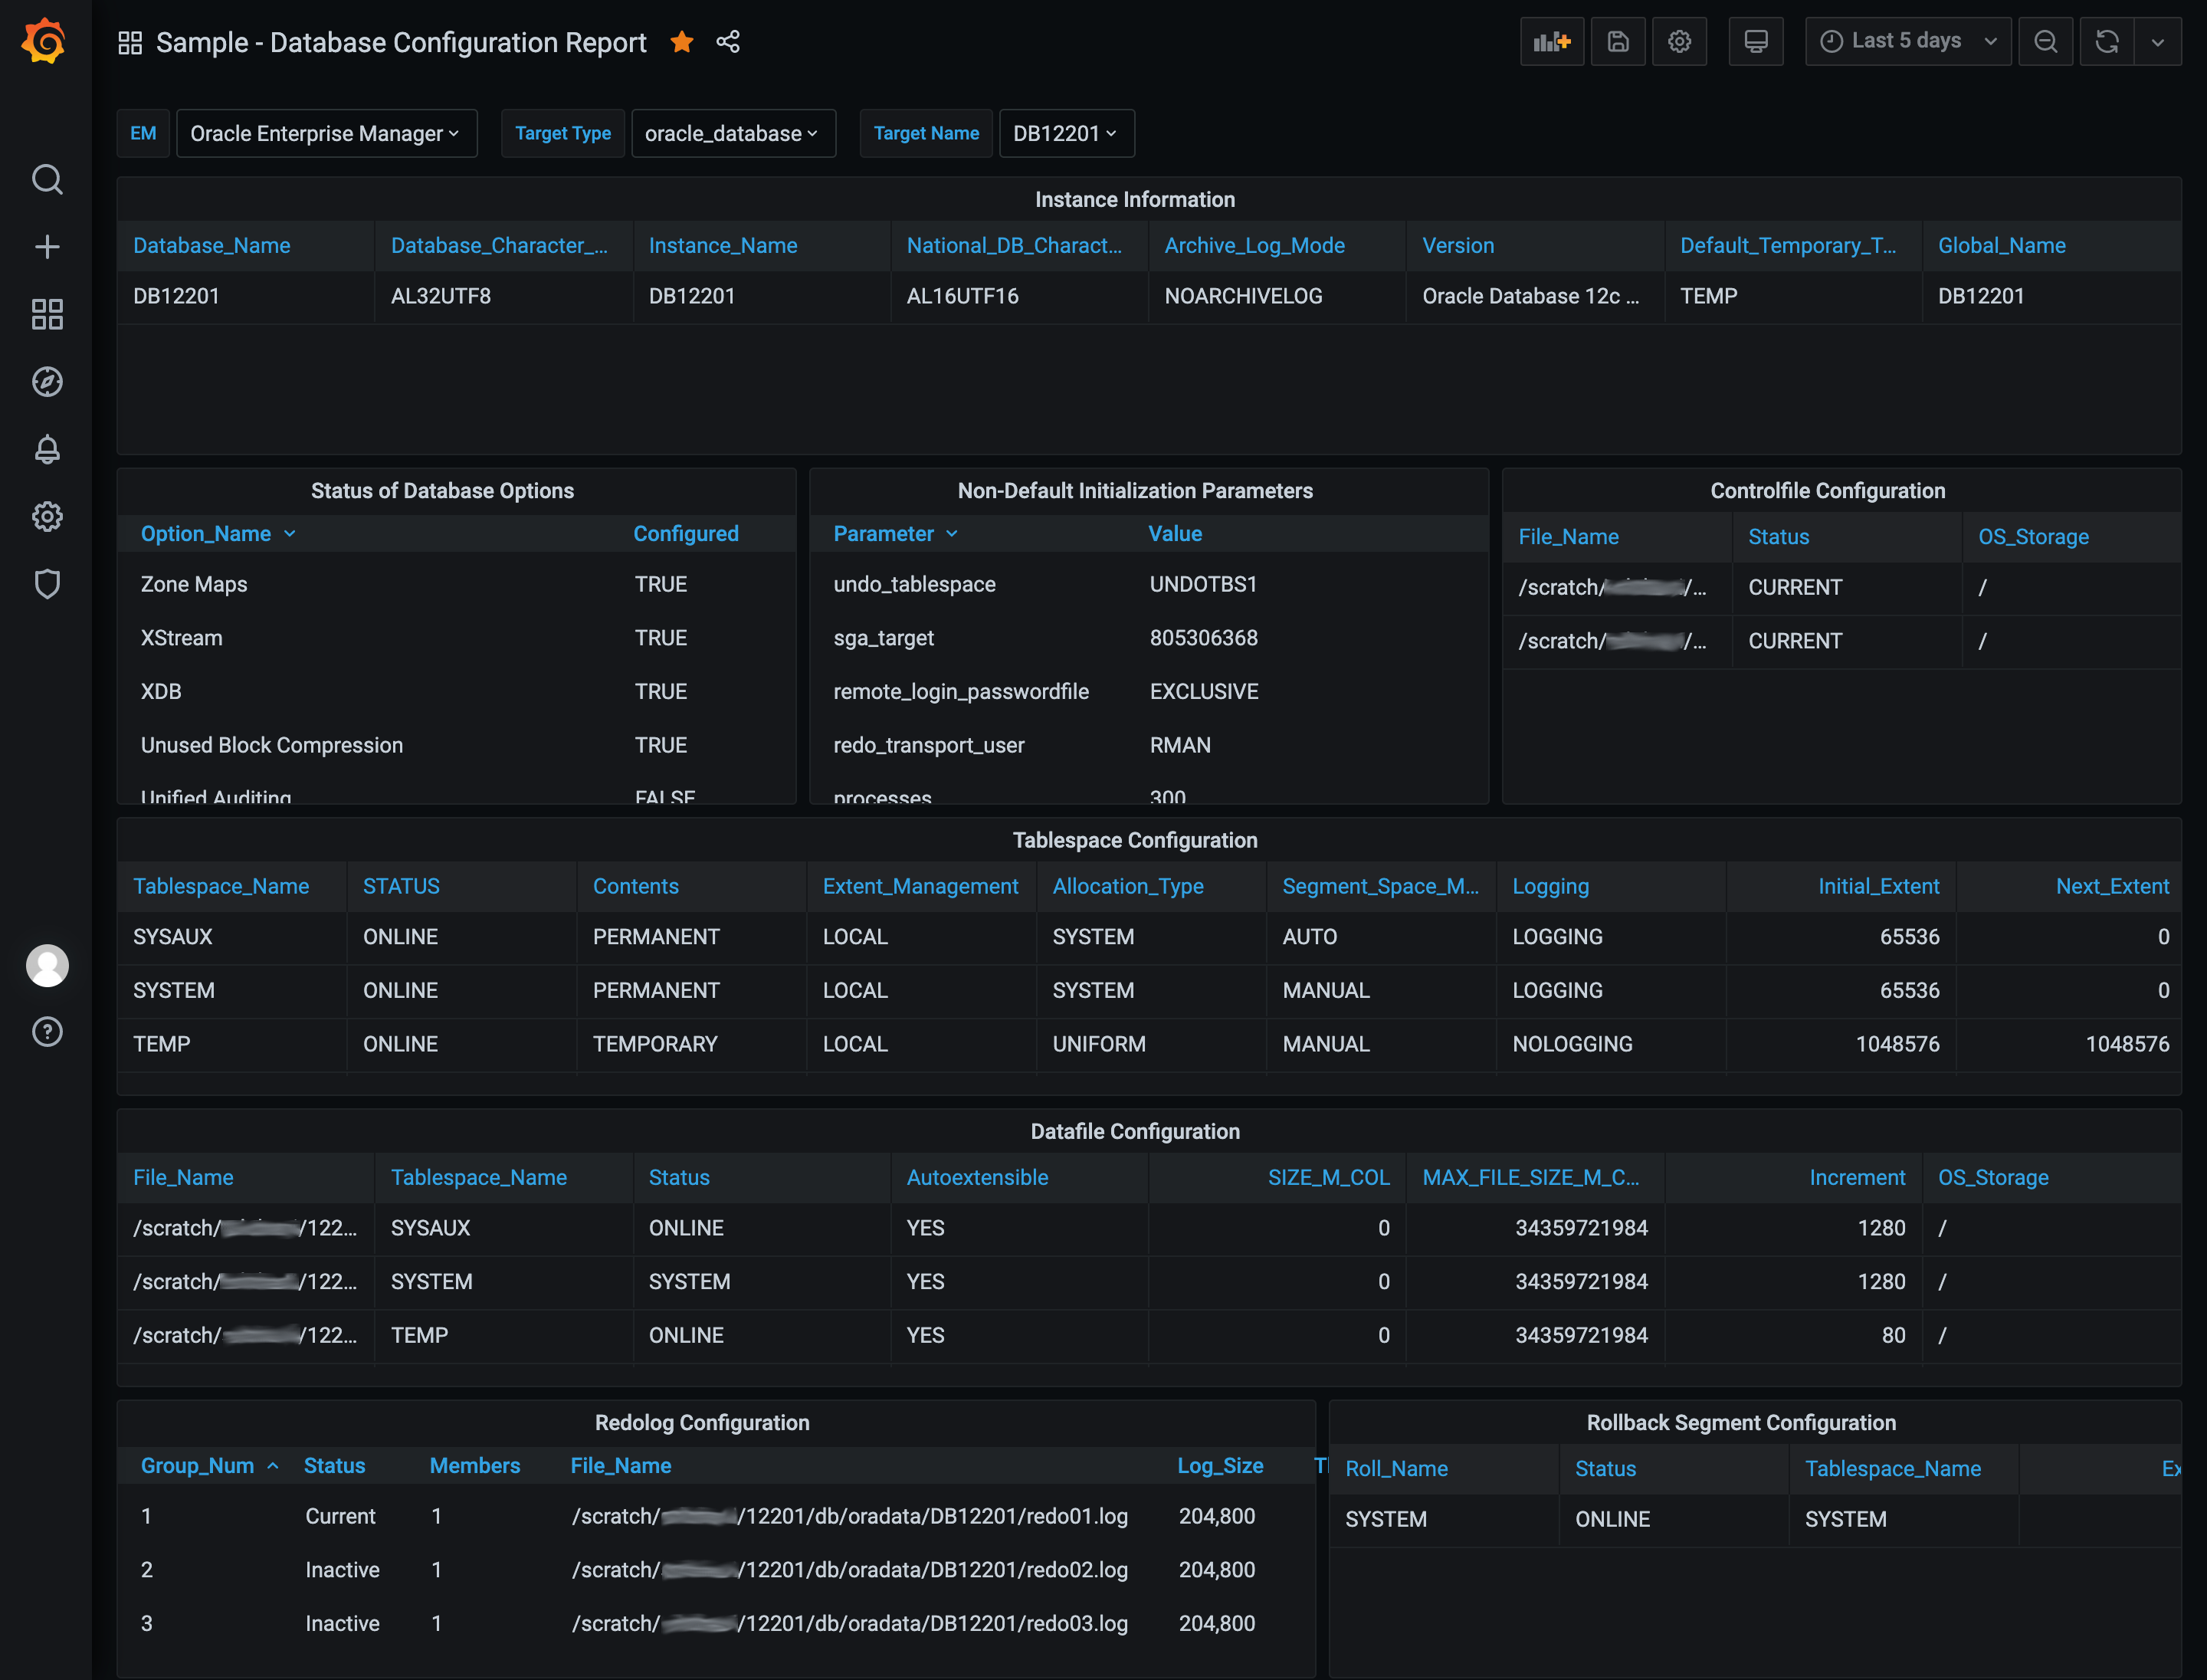
Database Configuration Dashboard
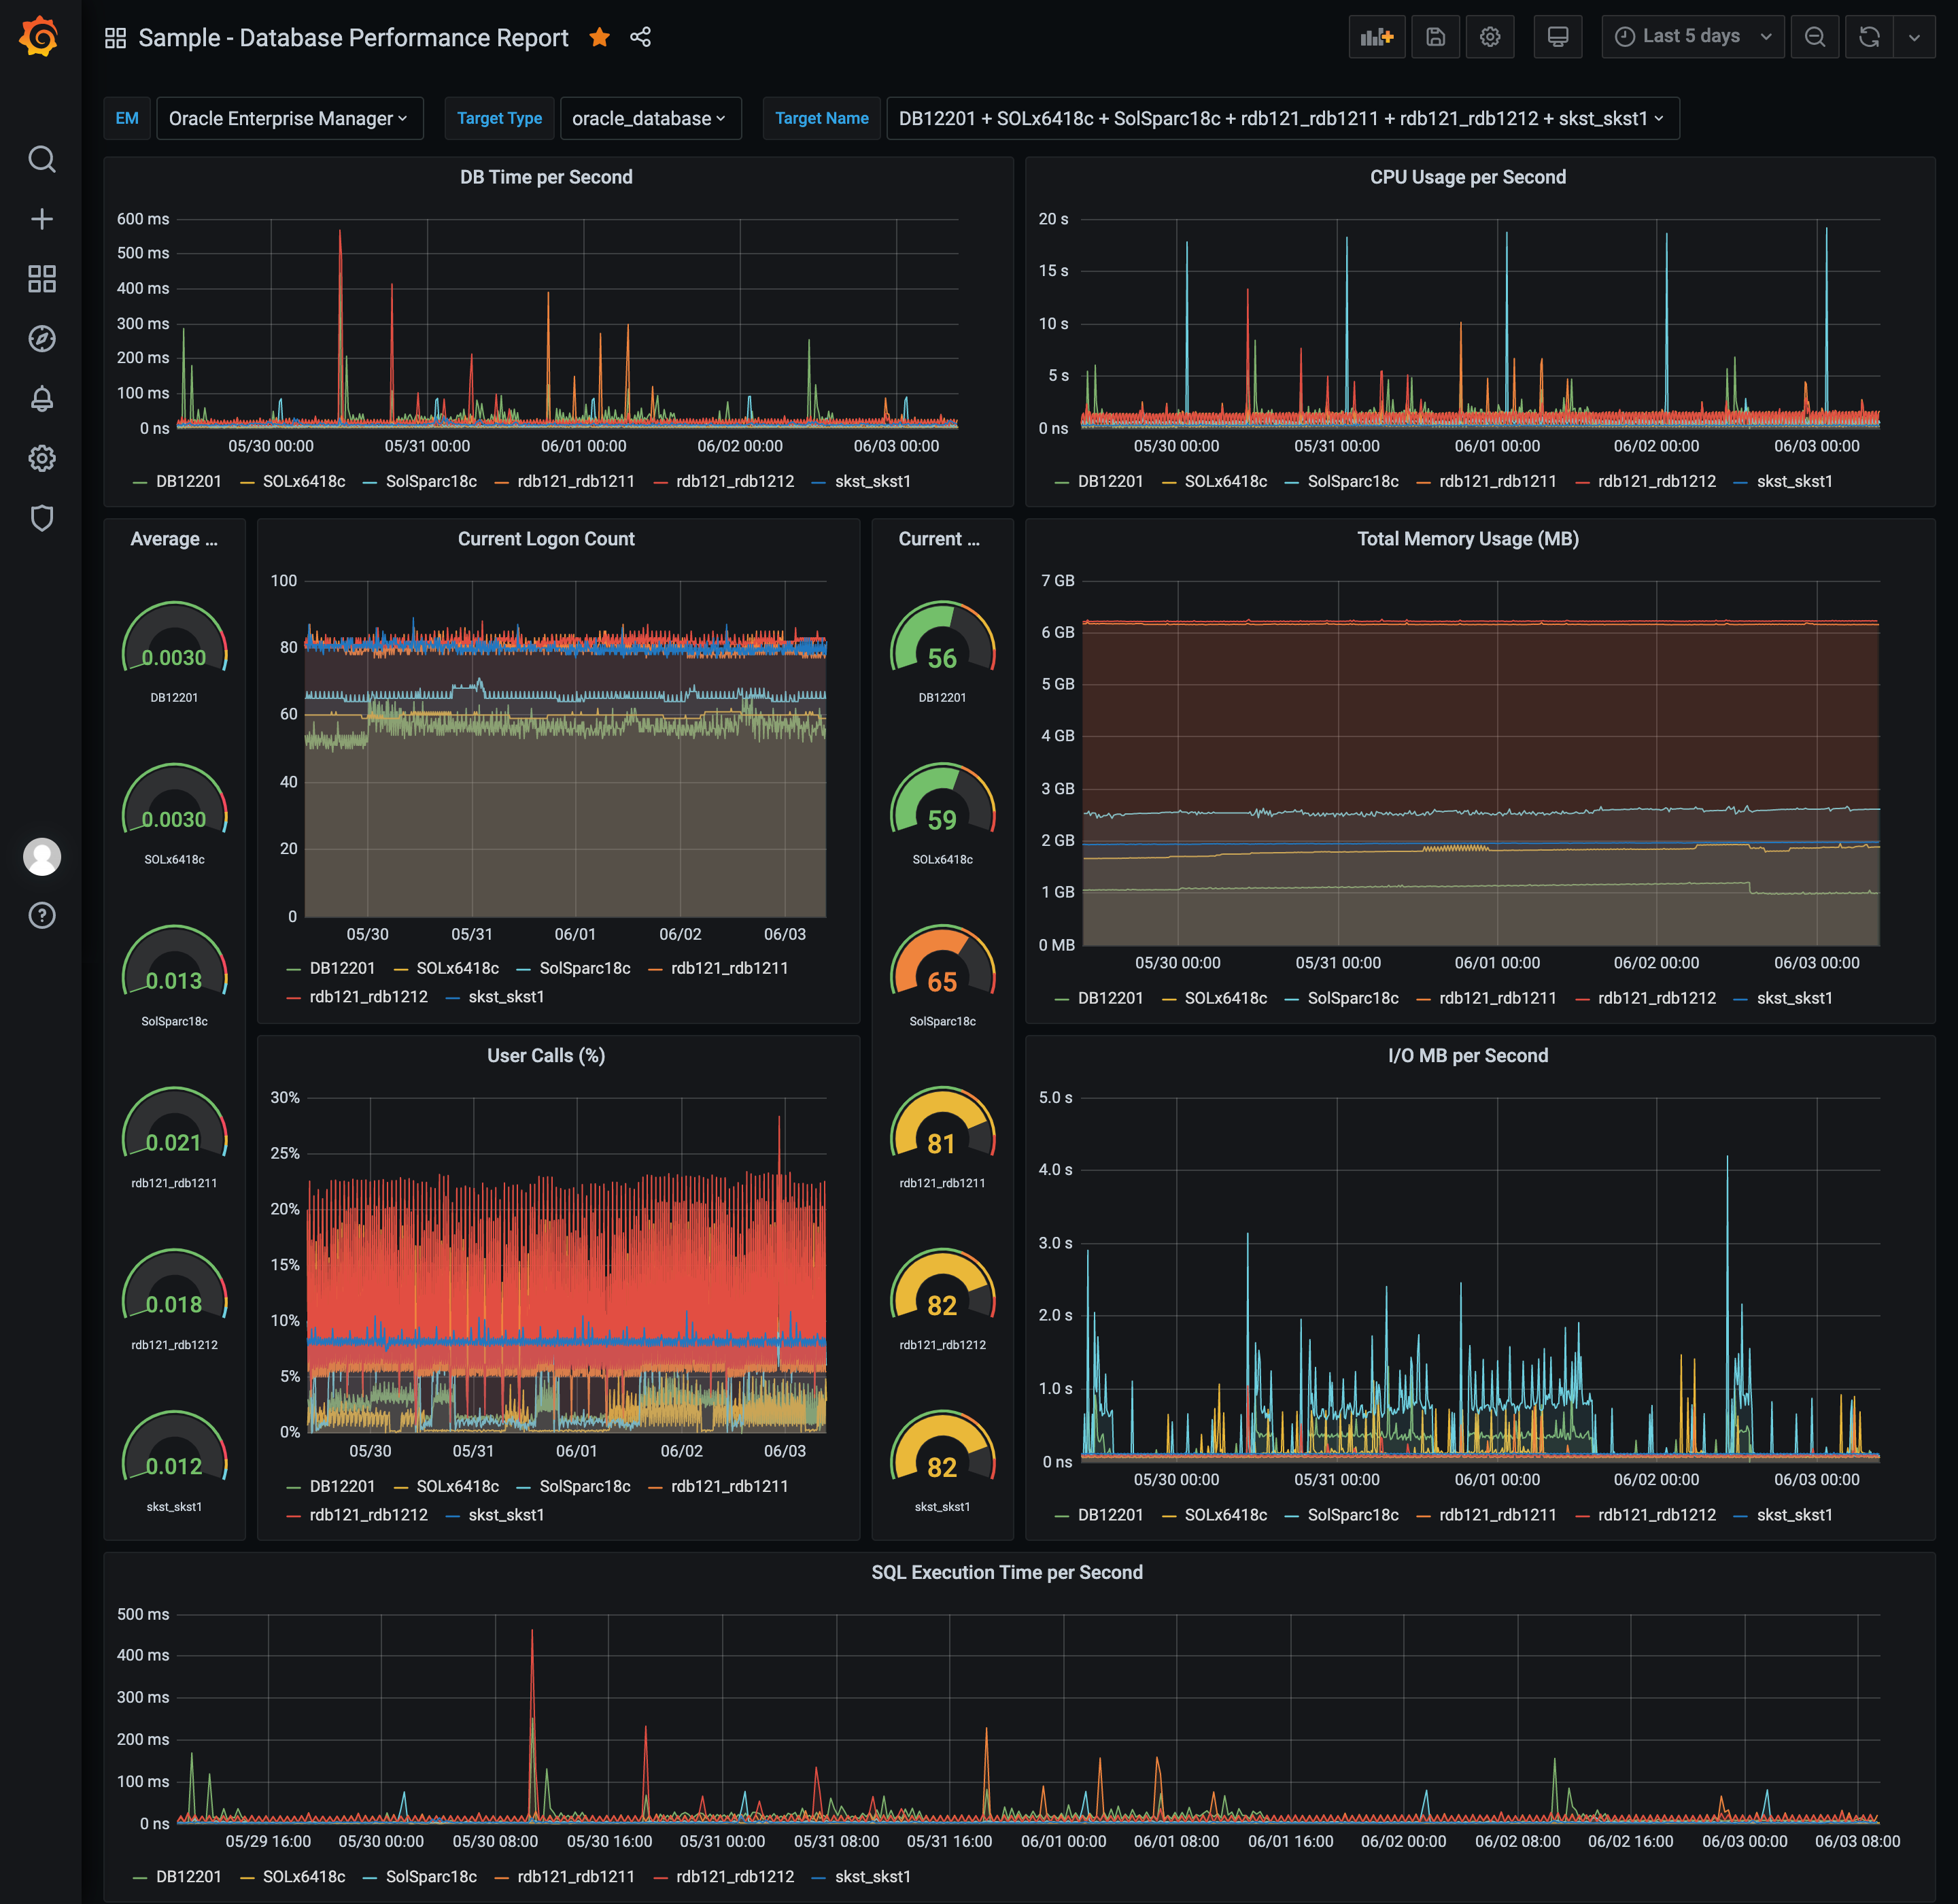
Database Performance Dashboard
WebLogic Server Performance Summary Dashboard
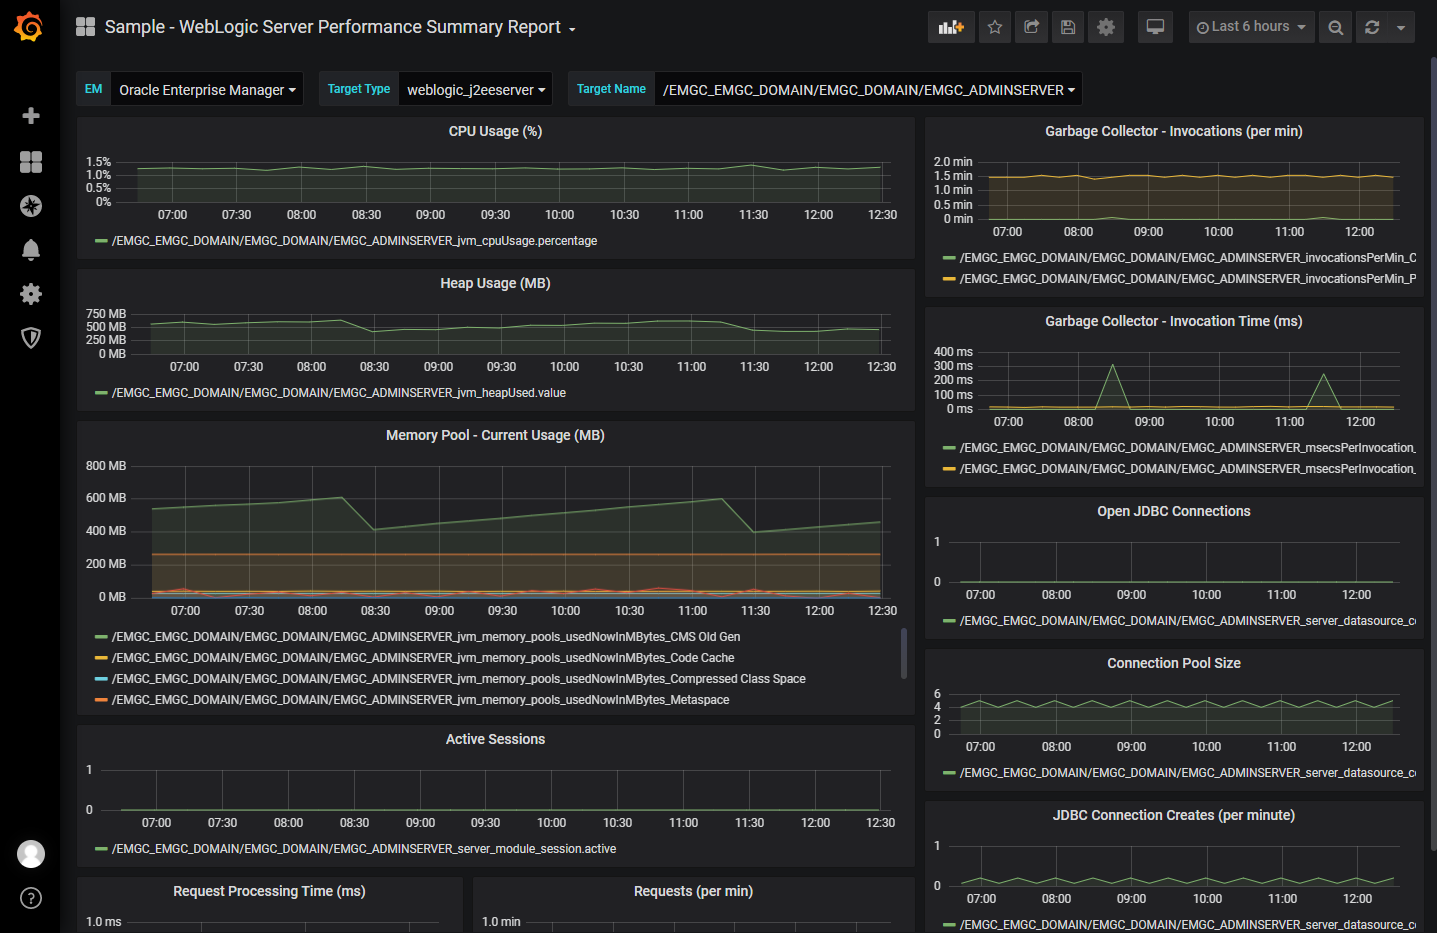
WebLogic Server JVM Performance Dashboard
