Sample Dashboards
The following dashboards demonstrate the information display flexibility you have using Grafana.
Exadata Capacity Planning Dashboard
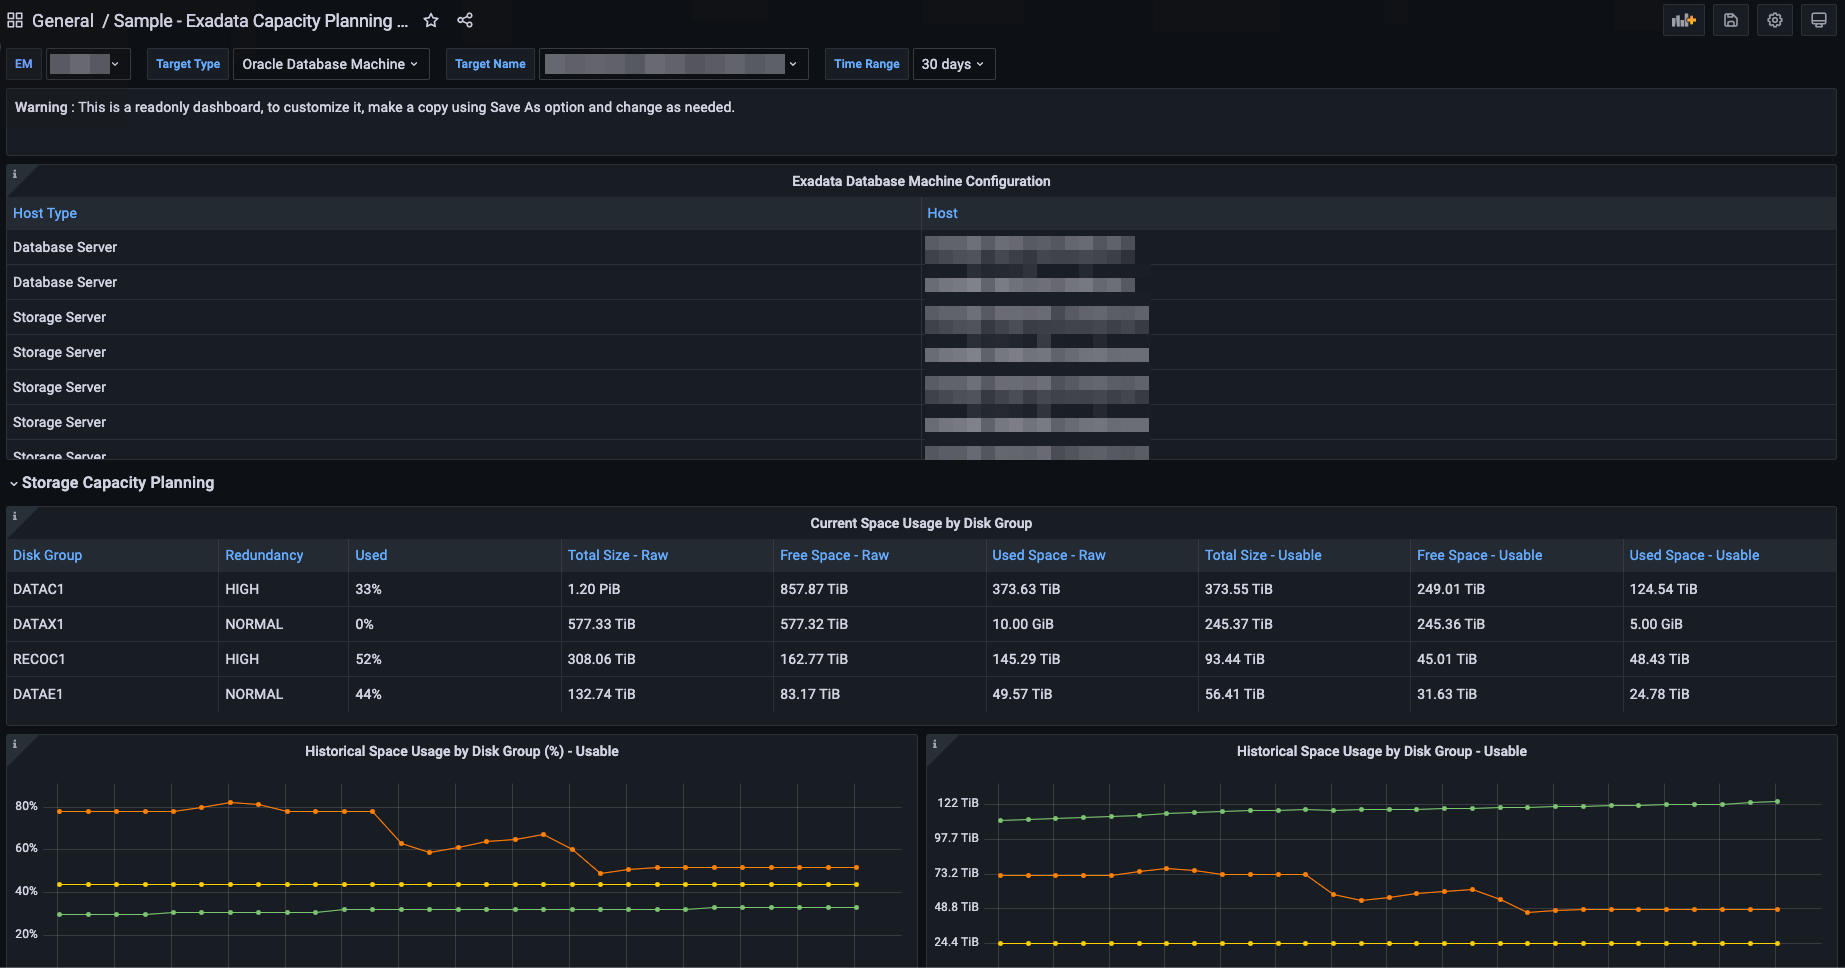
Starting with EM App for Grafana v4.0.0 the new Exadata Capacity Planning Dashboard provides the historical resource consumption of Key Performance Indicators for Exadata Database Machine (On-Prem Exadata).Contains CPU, Memory, Storage, I/O(Input/Output) and Network utilisation graphs.
Exadata Cloud Capacity Planning Dashboard
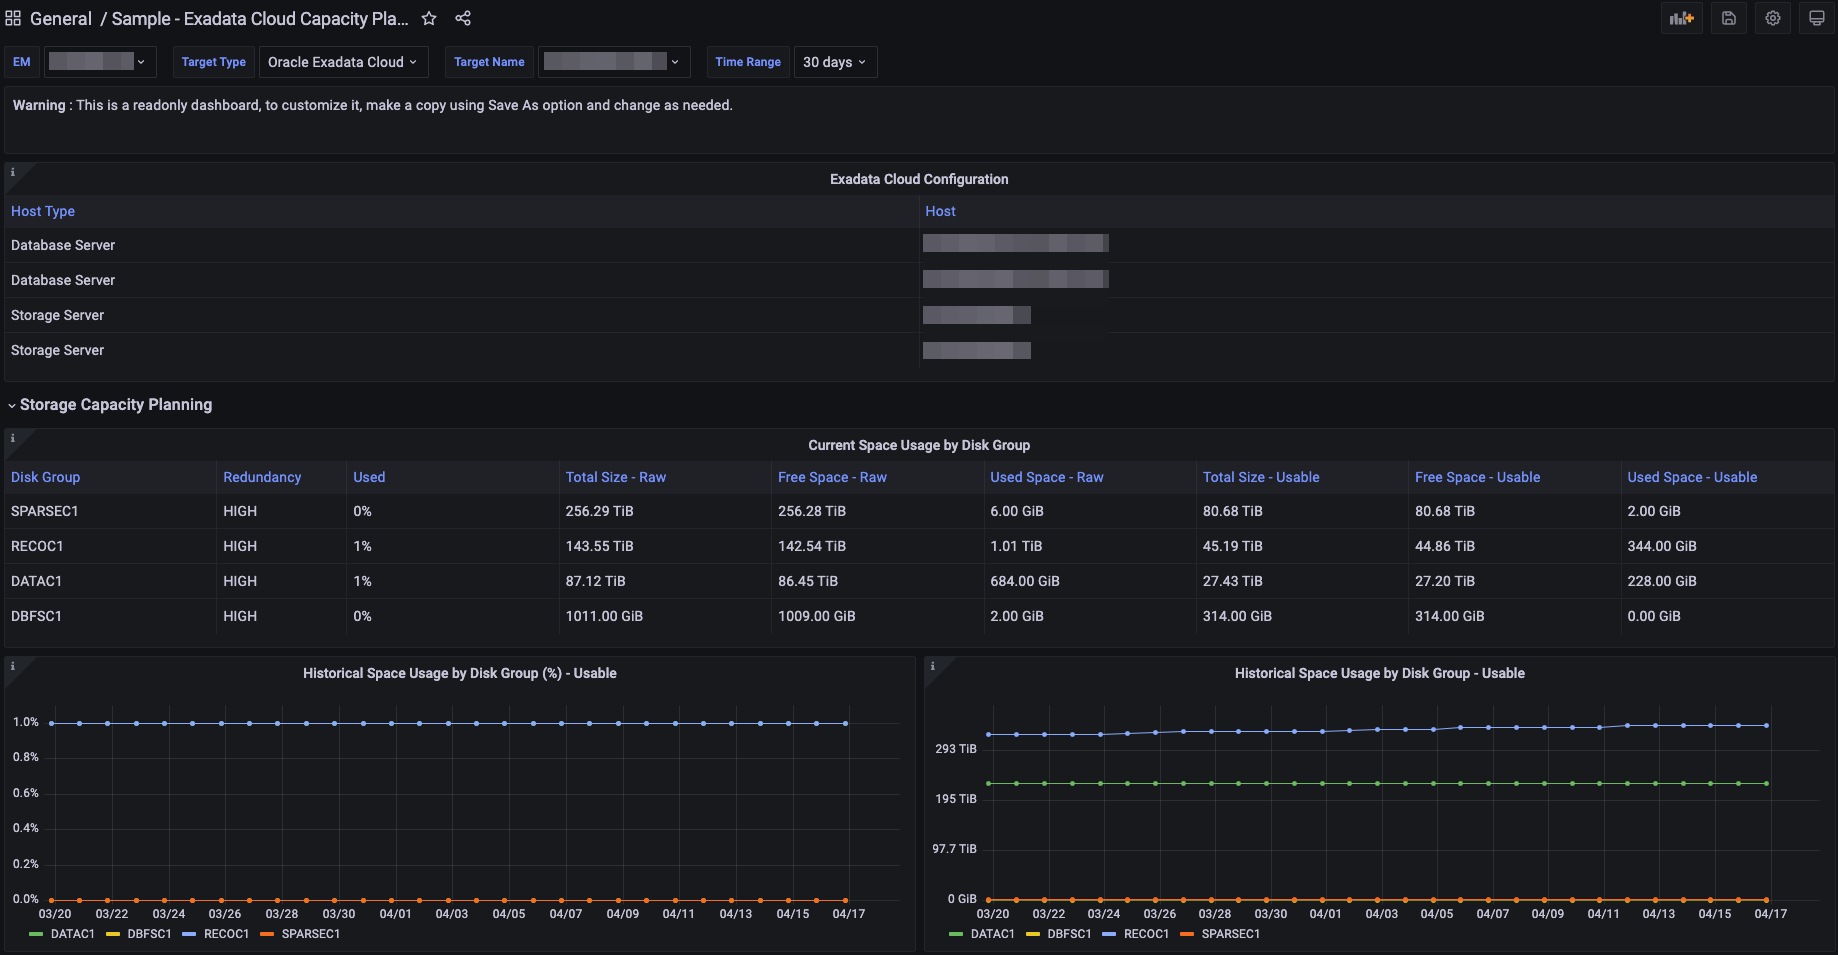
Starting with EM App for Grafana v4.0.0 the new Exadata Cloud Capacity Planning Dashboard provides the historical resource consumption of Key Performance Indicators for Exadata Cloud - Generation 1. (Cloud@Customer and Cloud Service)Contains CPU, Memory, Storage and I/O(Input/Output) utilisation graphs.
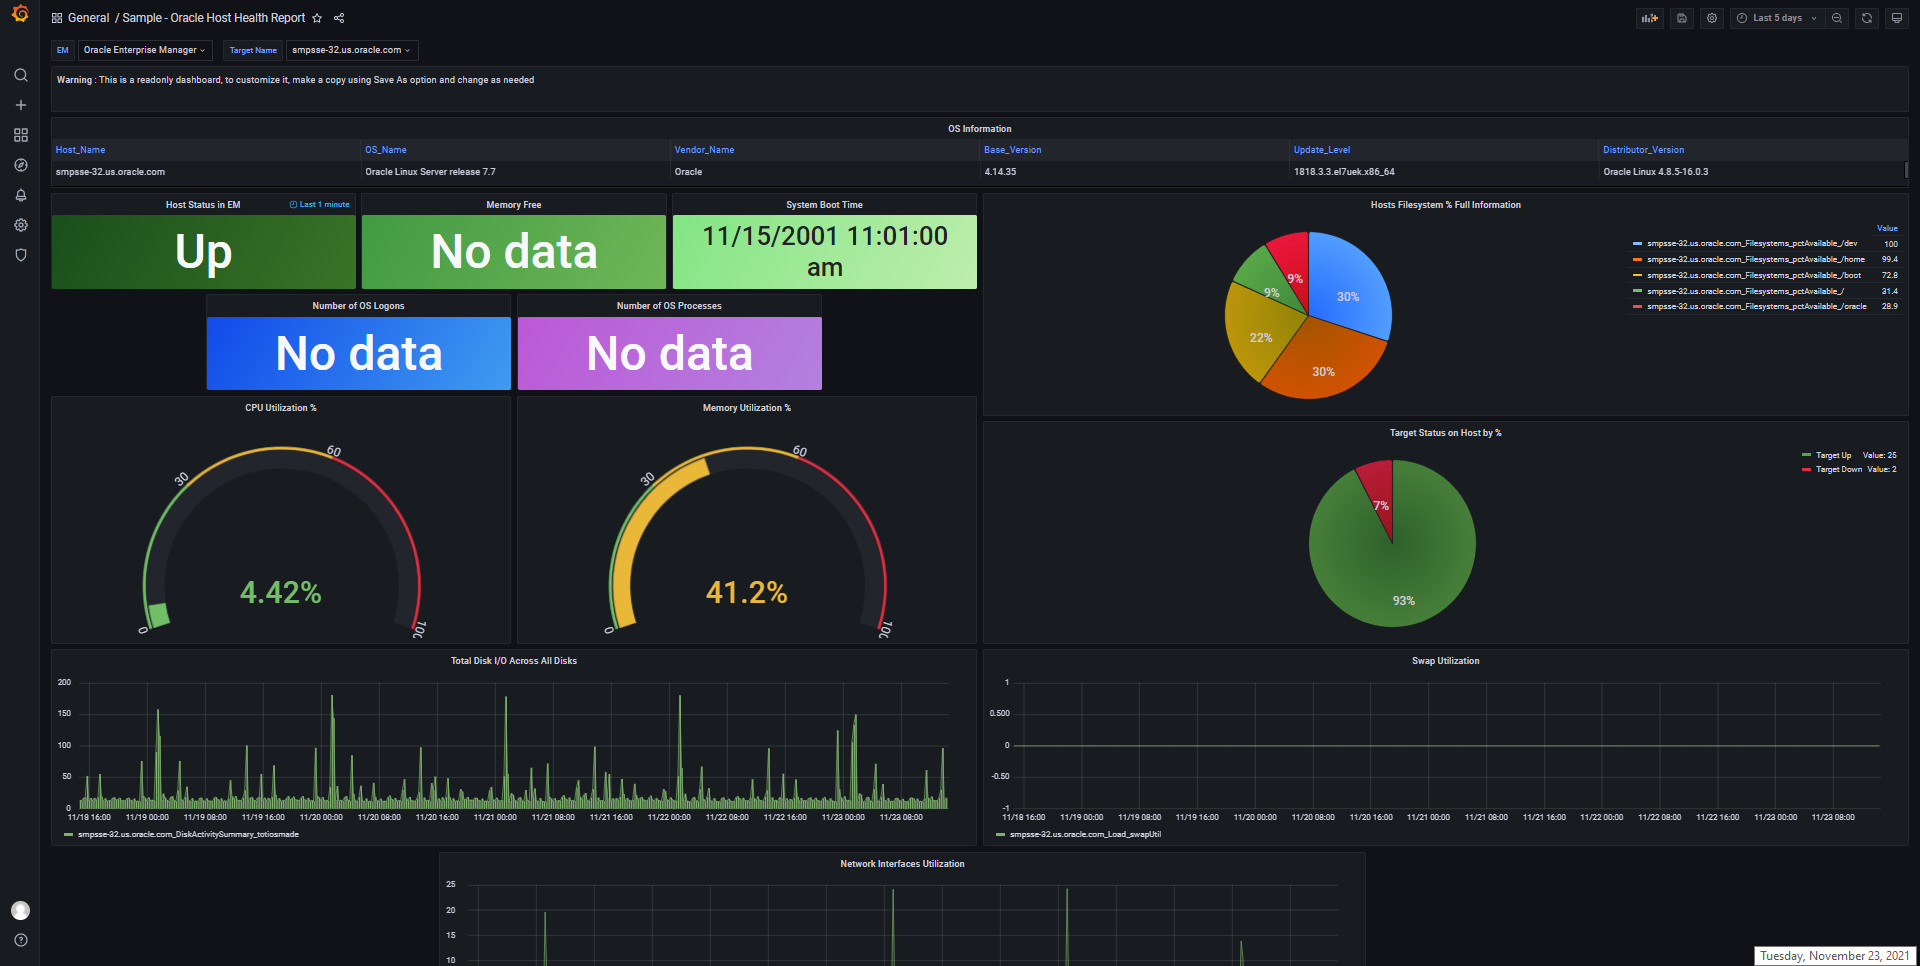
Oracle Host Health Report dashboard provides a comprehensive view of the status and health of a host:
Note:
The panel Number of OS Logons in this dashboard is built using a custom SQL query to the repository database to get the number of users currently logged onto the host. The metric needs to be enabled from Enterprise Manager: User > Number of Logons.
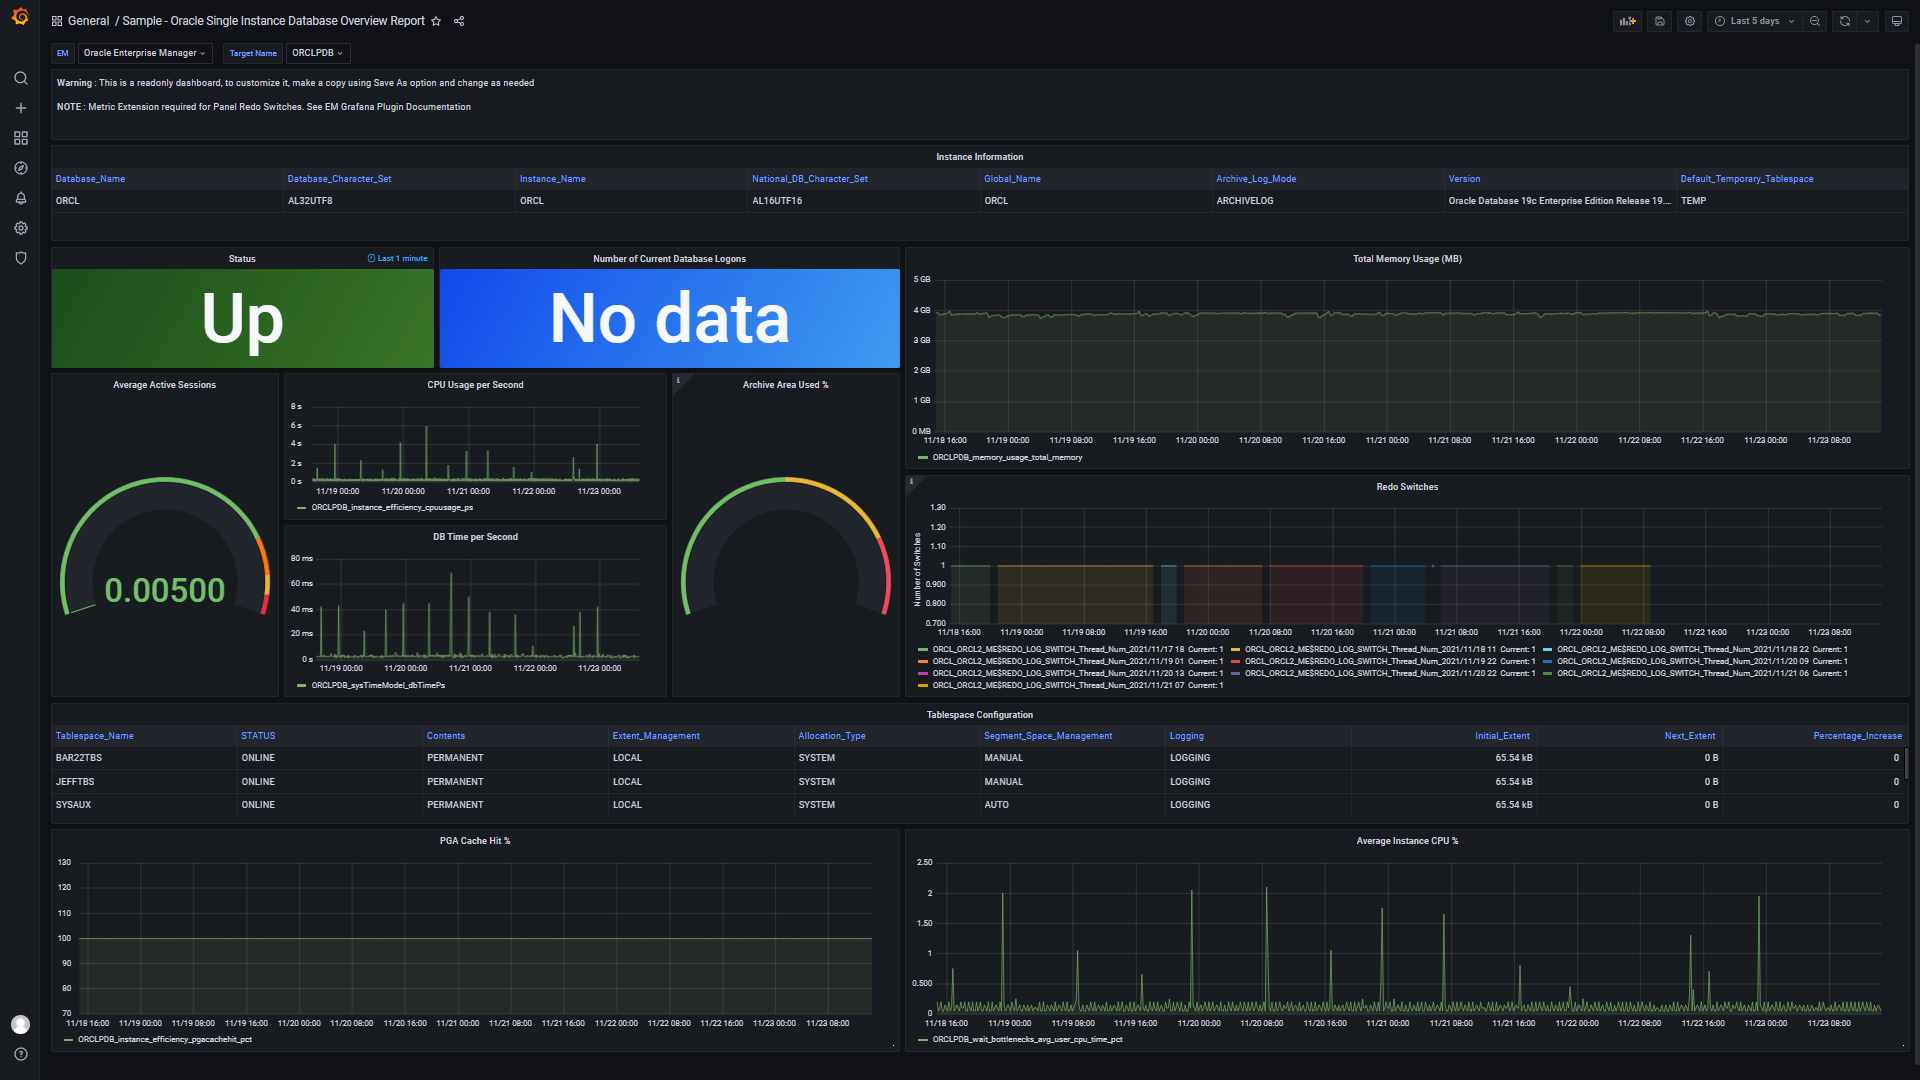
Oracle Single Instance Database Overview Report dashboard provides a comprehensive look at the status and health of a single instance database:
Note:
The Redo Switches panel in this dashboard requires a Metric Extension to be created and deployed to each database target you want to monitor from this dashboard. For information on creating a SQL Metric Extension, see Using Metric Extensions in the Enterprise Manager Administrators Guide.
When creating the Metric Extension, use the following SQL:
select *
From (SELECT to_char(first_time,'YYYY/MM/DD HH24') day_hour, count(*) "#"
     from v$log_history
     GROUP by to_char(first_time,'YYYY/MM/DD HH24')
     order by 1 DESC)
where rownum=1;
Note:
The Archive Area Used % panel in the Oracle Single Instance Database Overview Report dashboard requires the metric to be enabled from Enterprise Manager. Archiving must be configured on the database for value add.
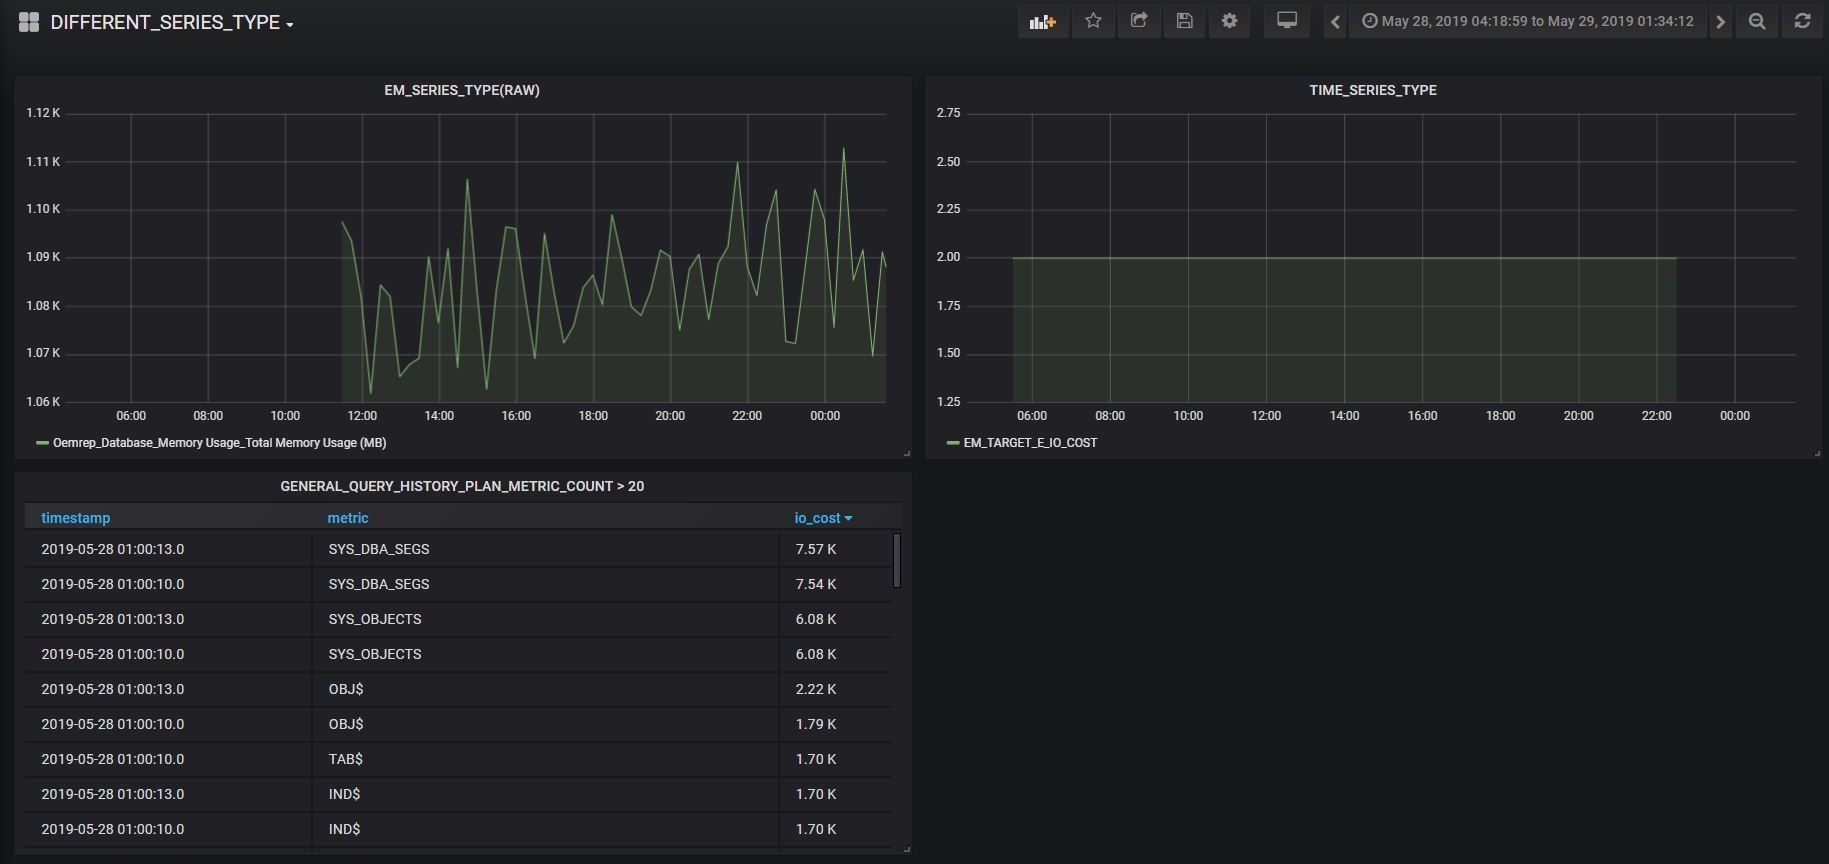
Dashboard with different series types:
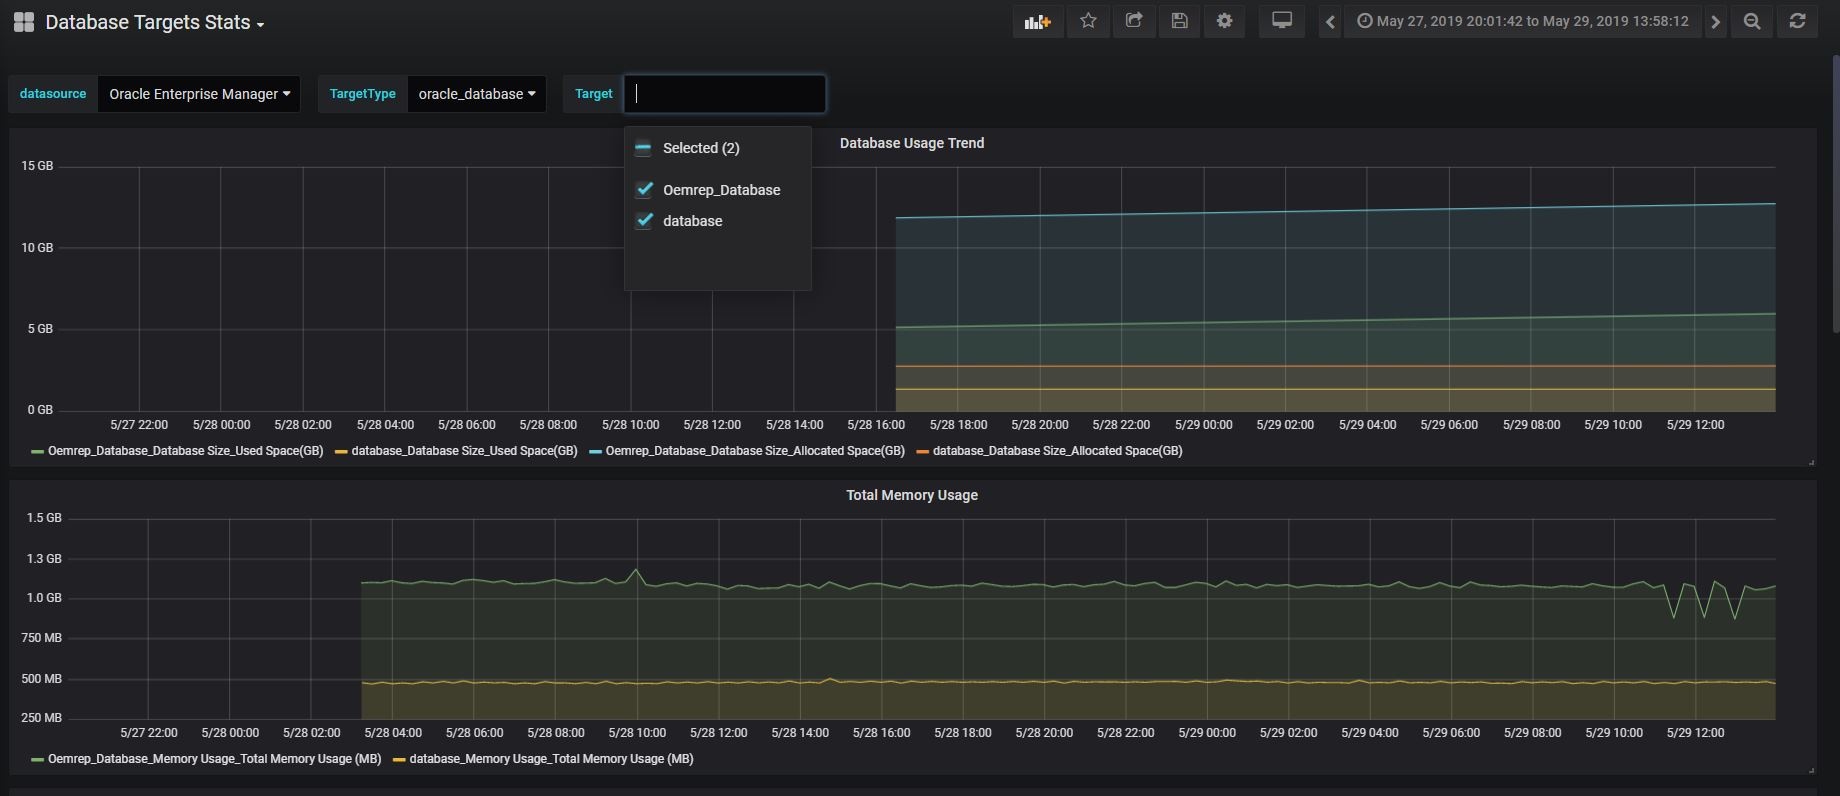
Dashboard with single target type and multiple targets ( Data from a Single Enterprise Manager site, multiple targets) :
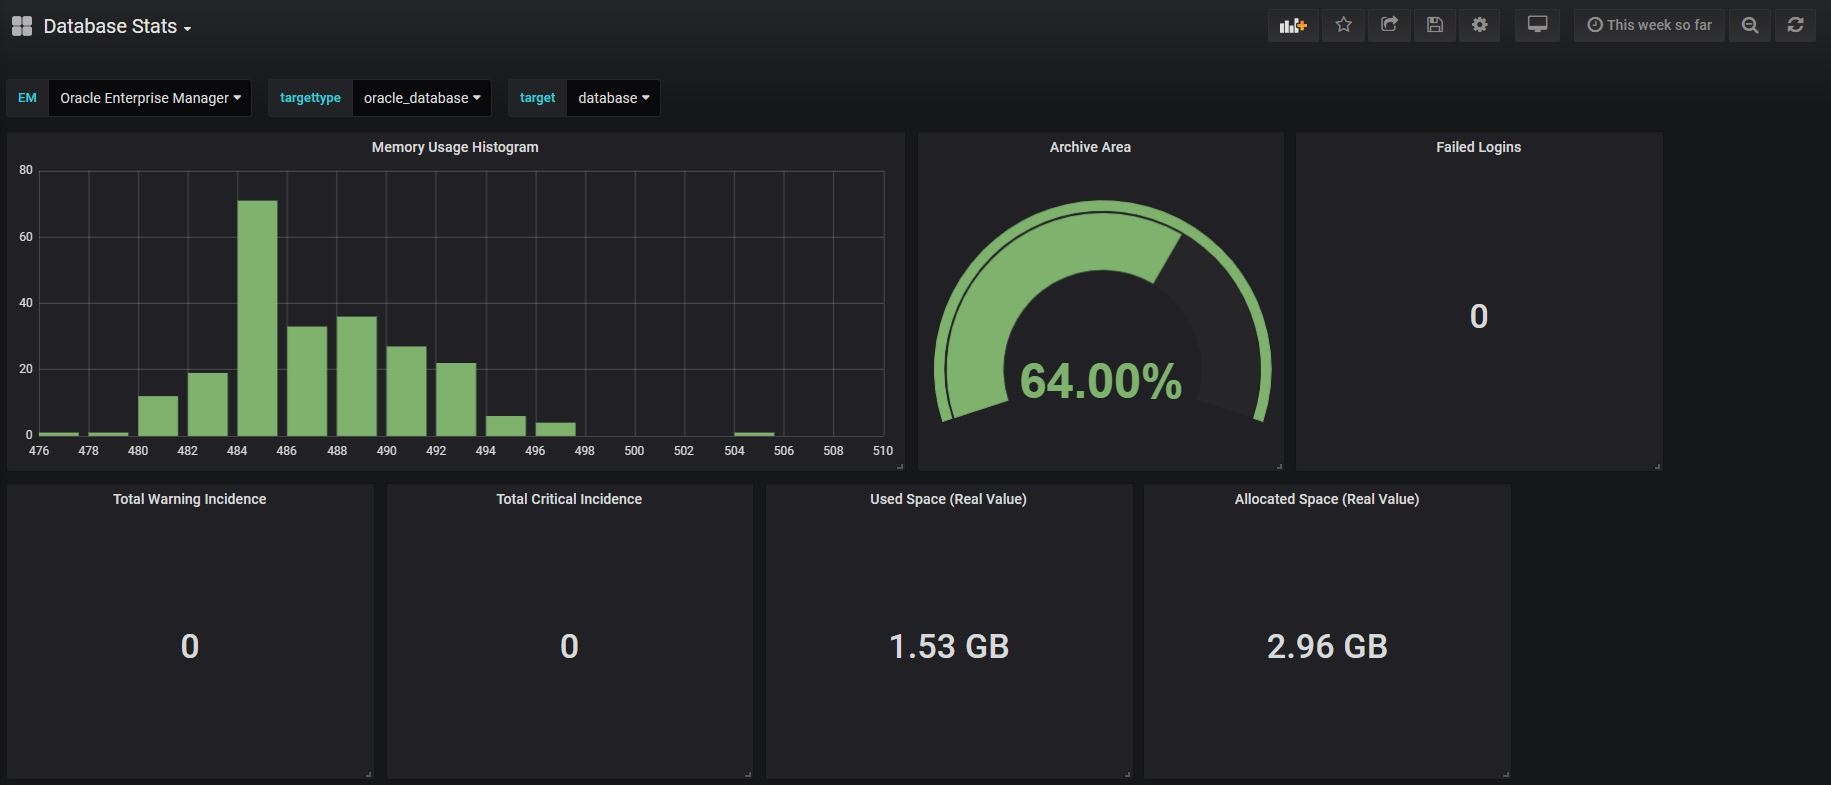
Dashboard with single target type and single target selection( Data from a single Enterprise Manager site, single targets):
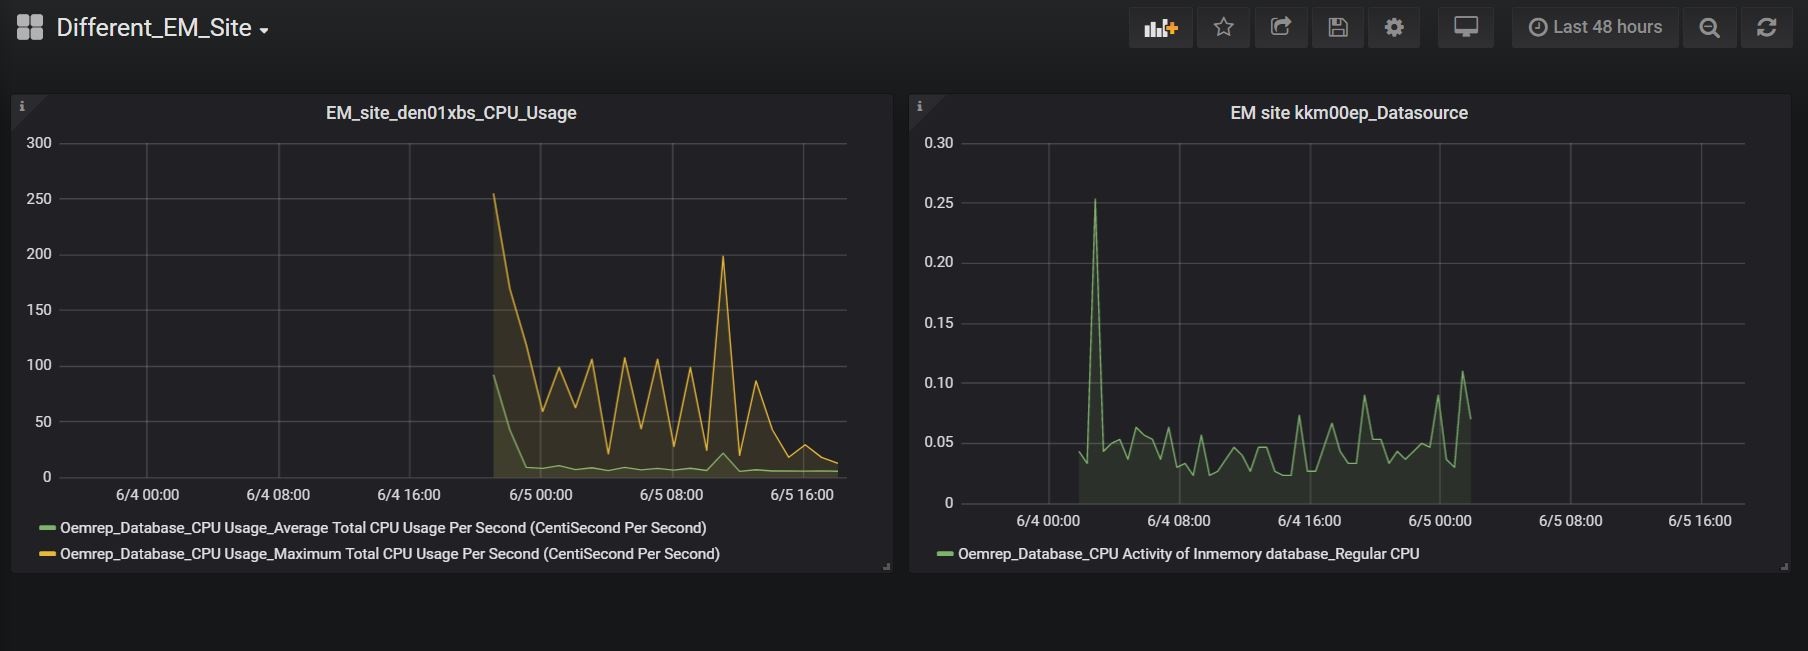
Dashboard with separate panels, pulling data from the different Enterprise Manager sites ( Data from multiple Enterprise Manager sites, multiple targets) :
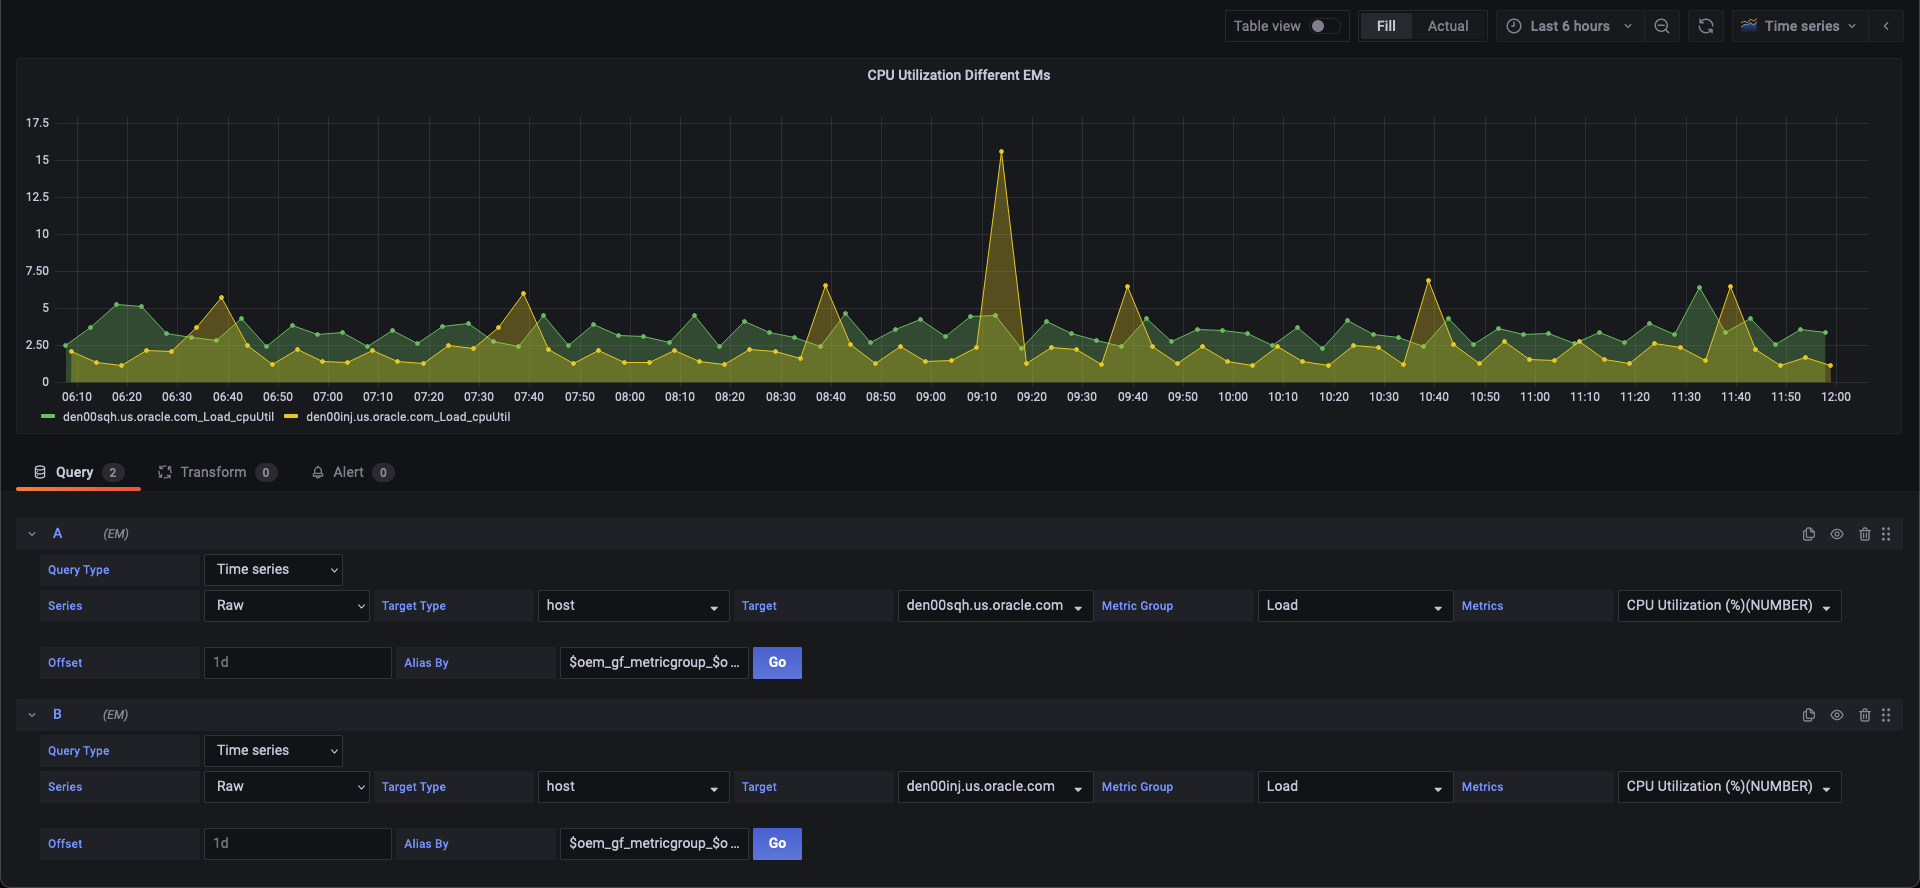
Dashboard with a single panel pulling data from a different Enterprise Manager sites (Data from multiple Enterprise Manager sites , single panel):
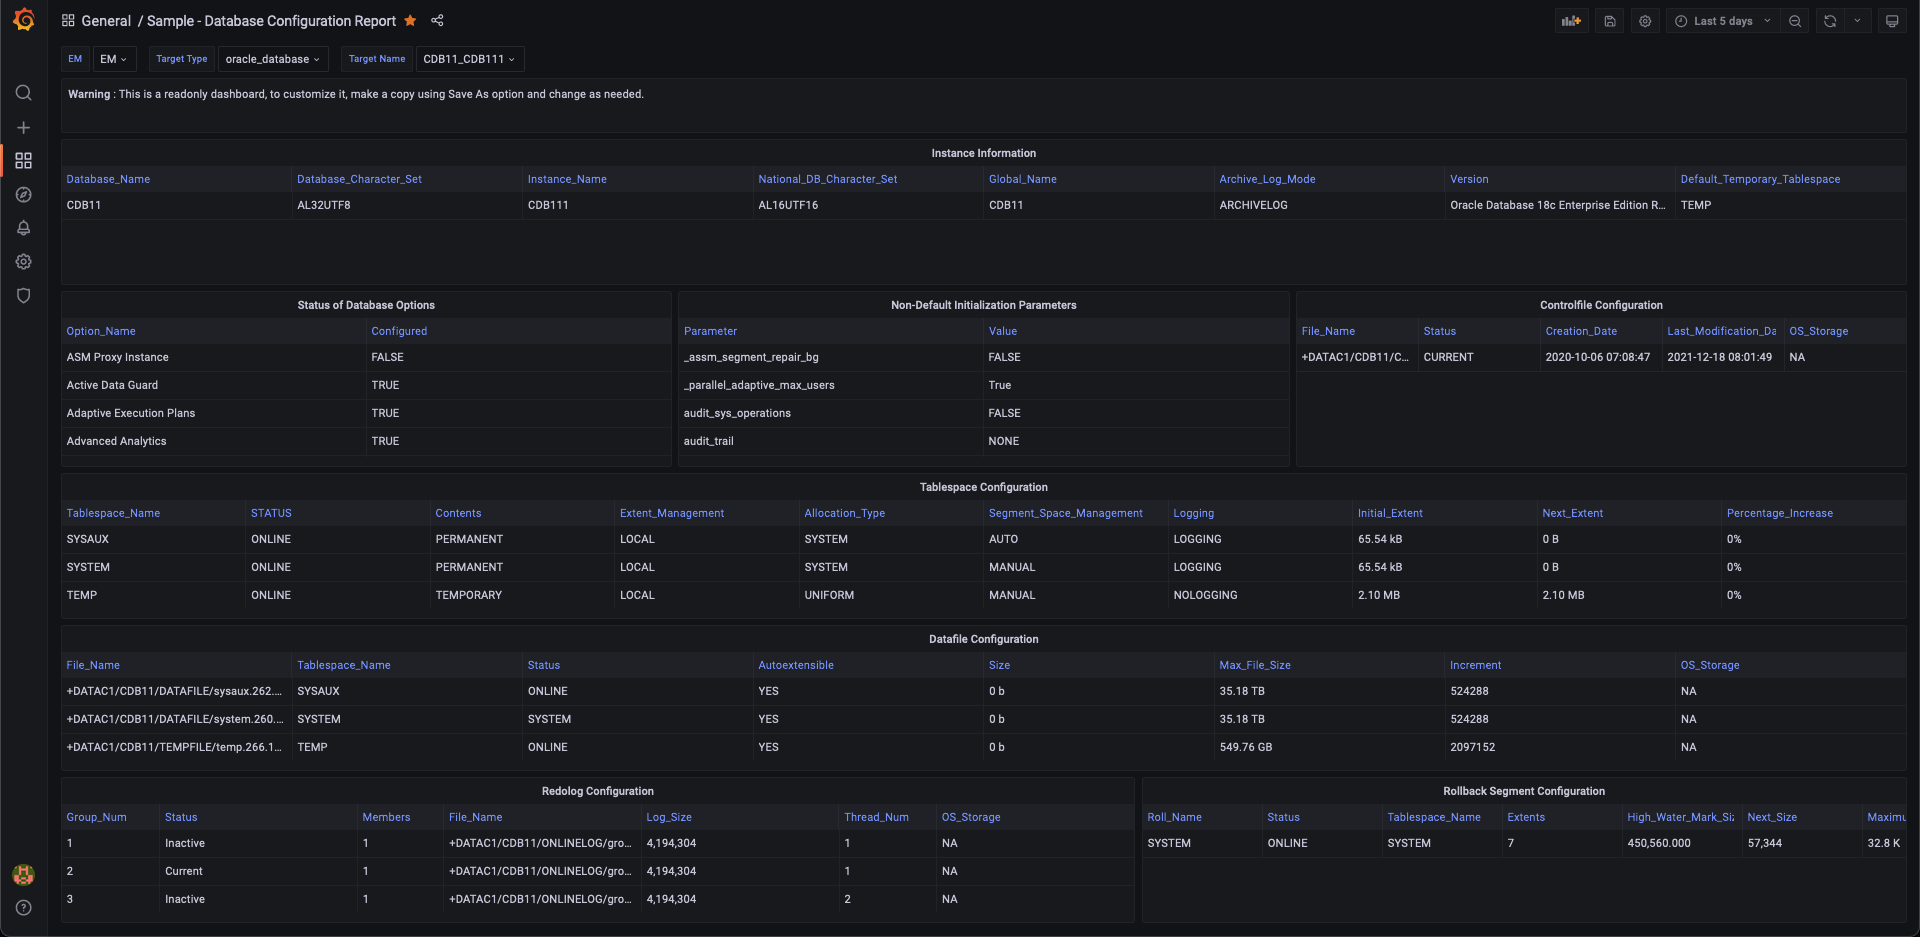
Database Configuration Dashboard
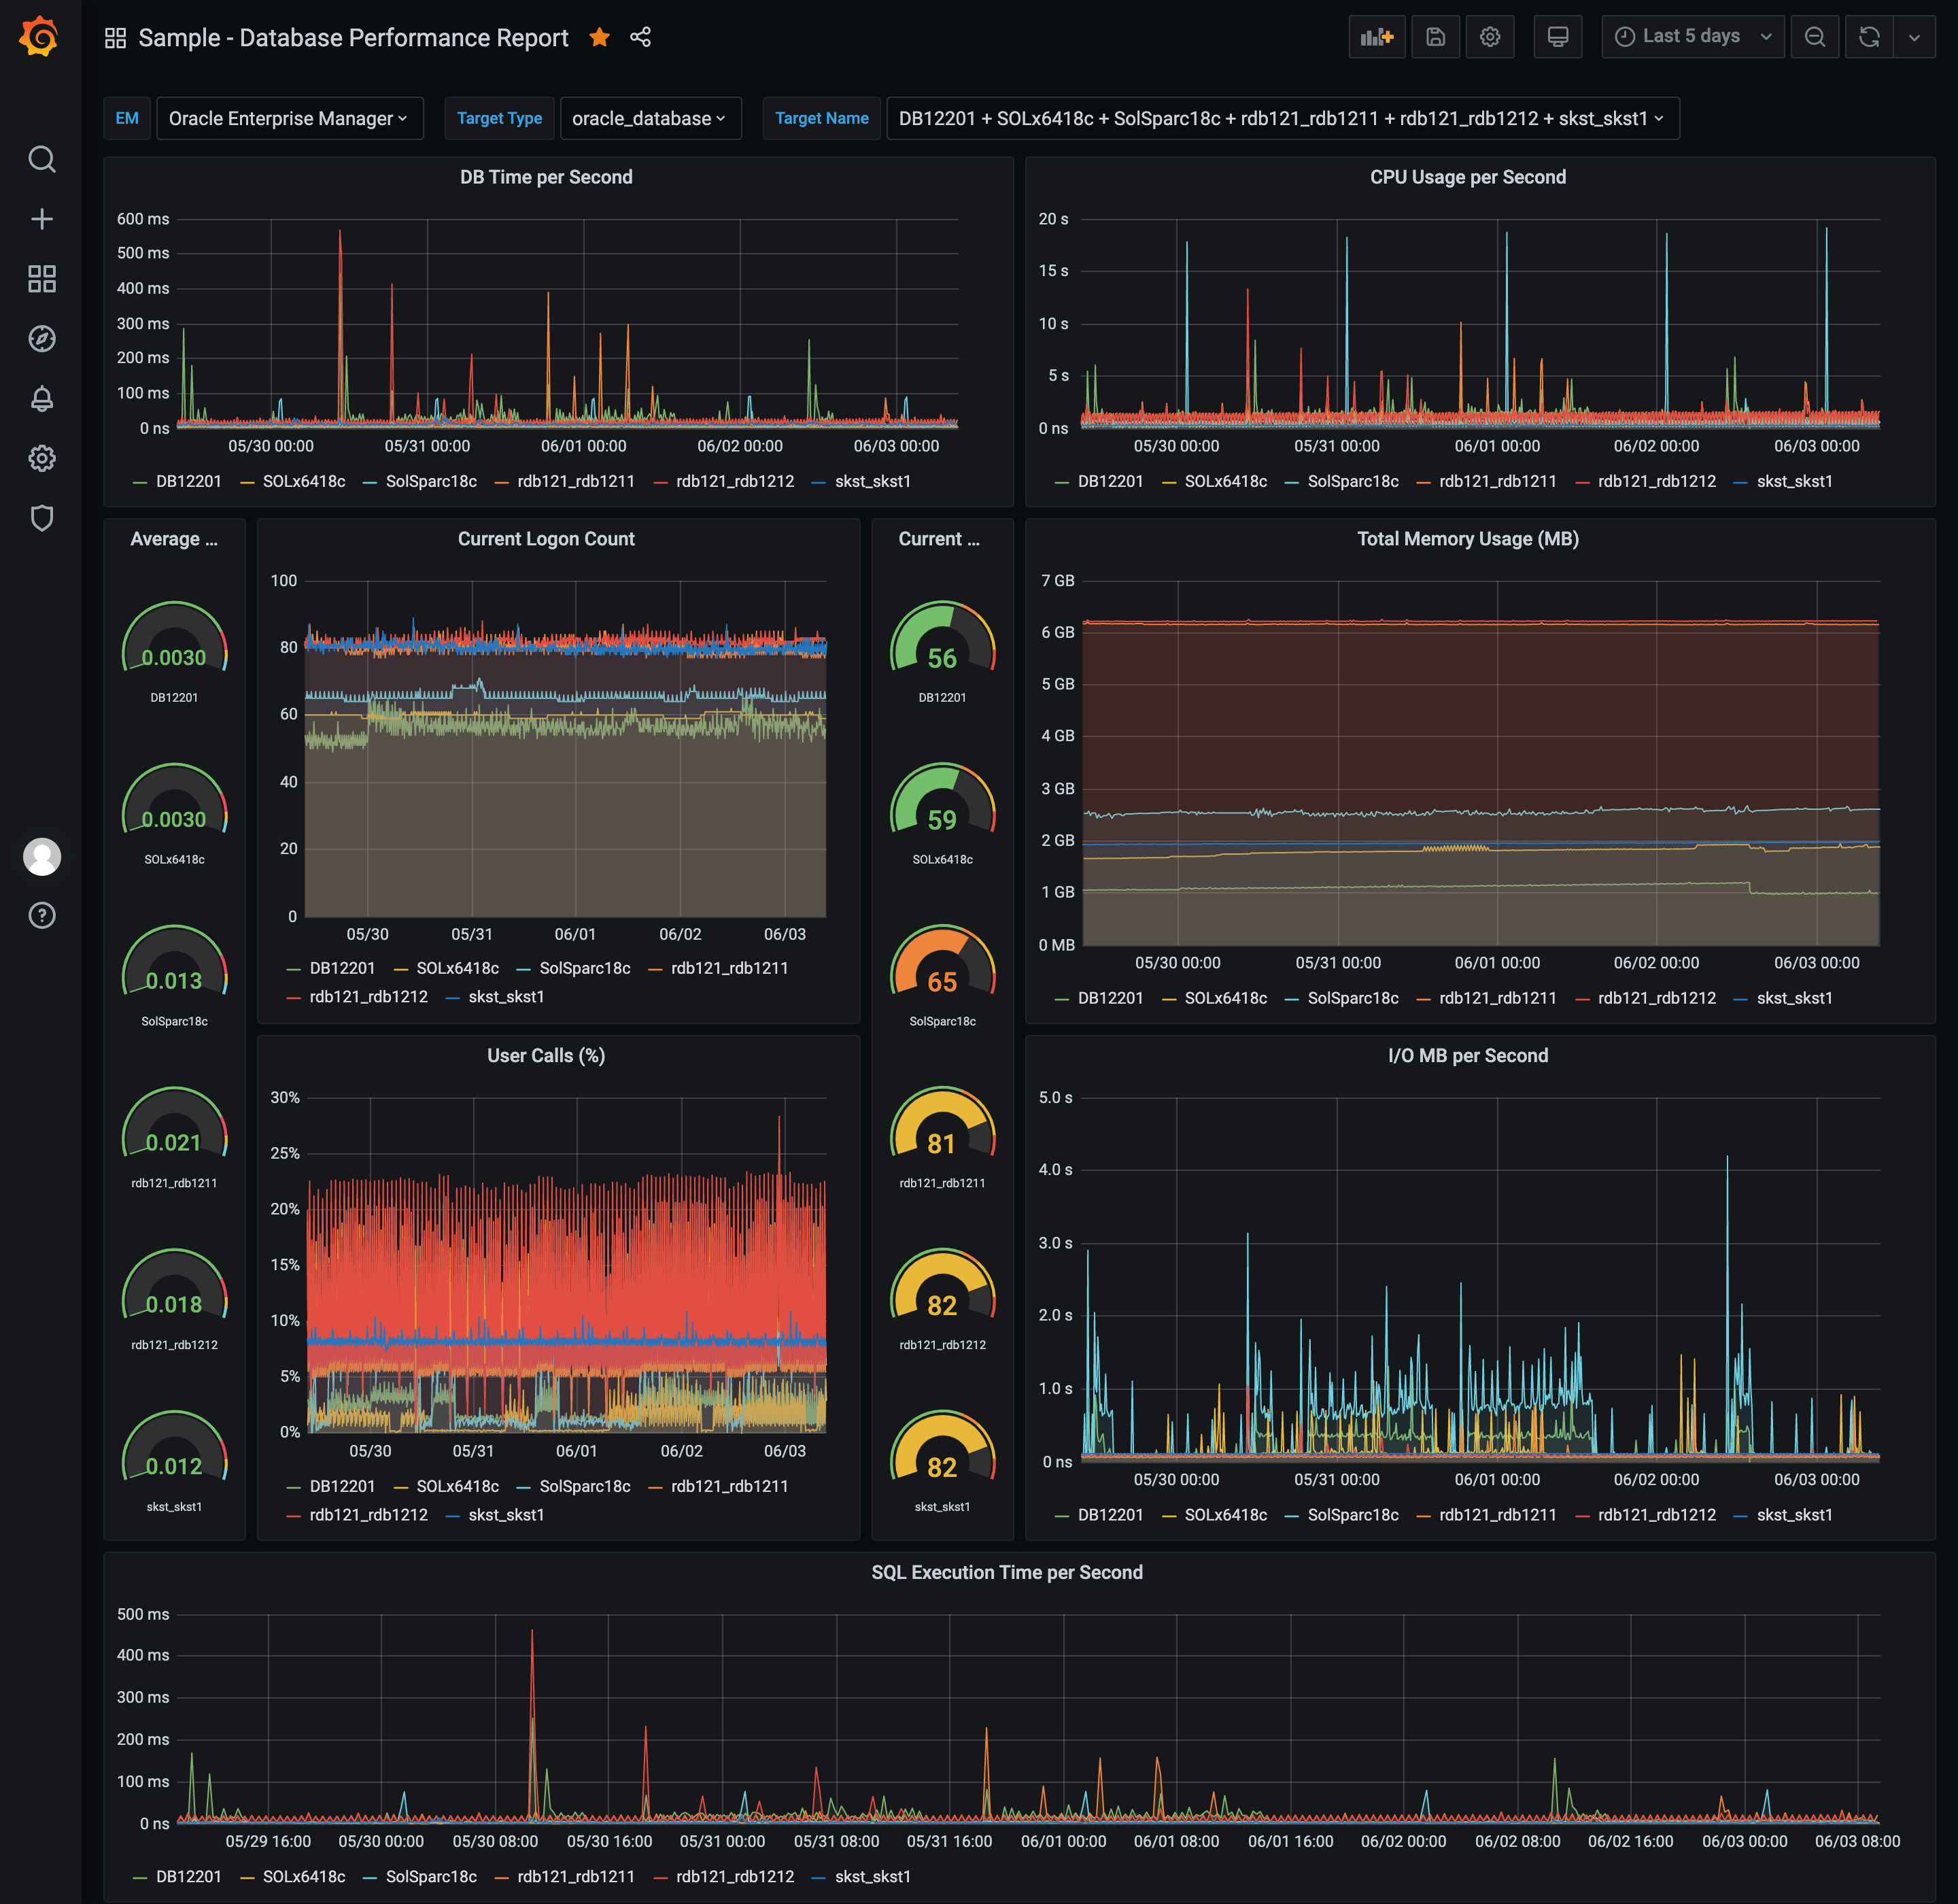
Database Performance Dashboard
WebLogic Server Performance Summary Dashboard
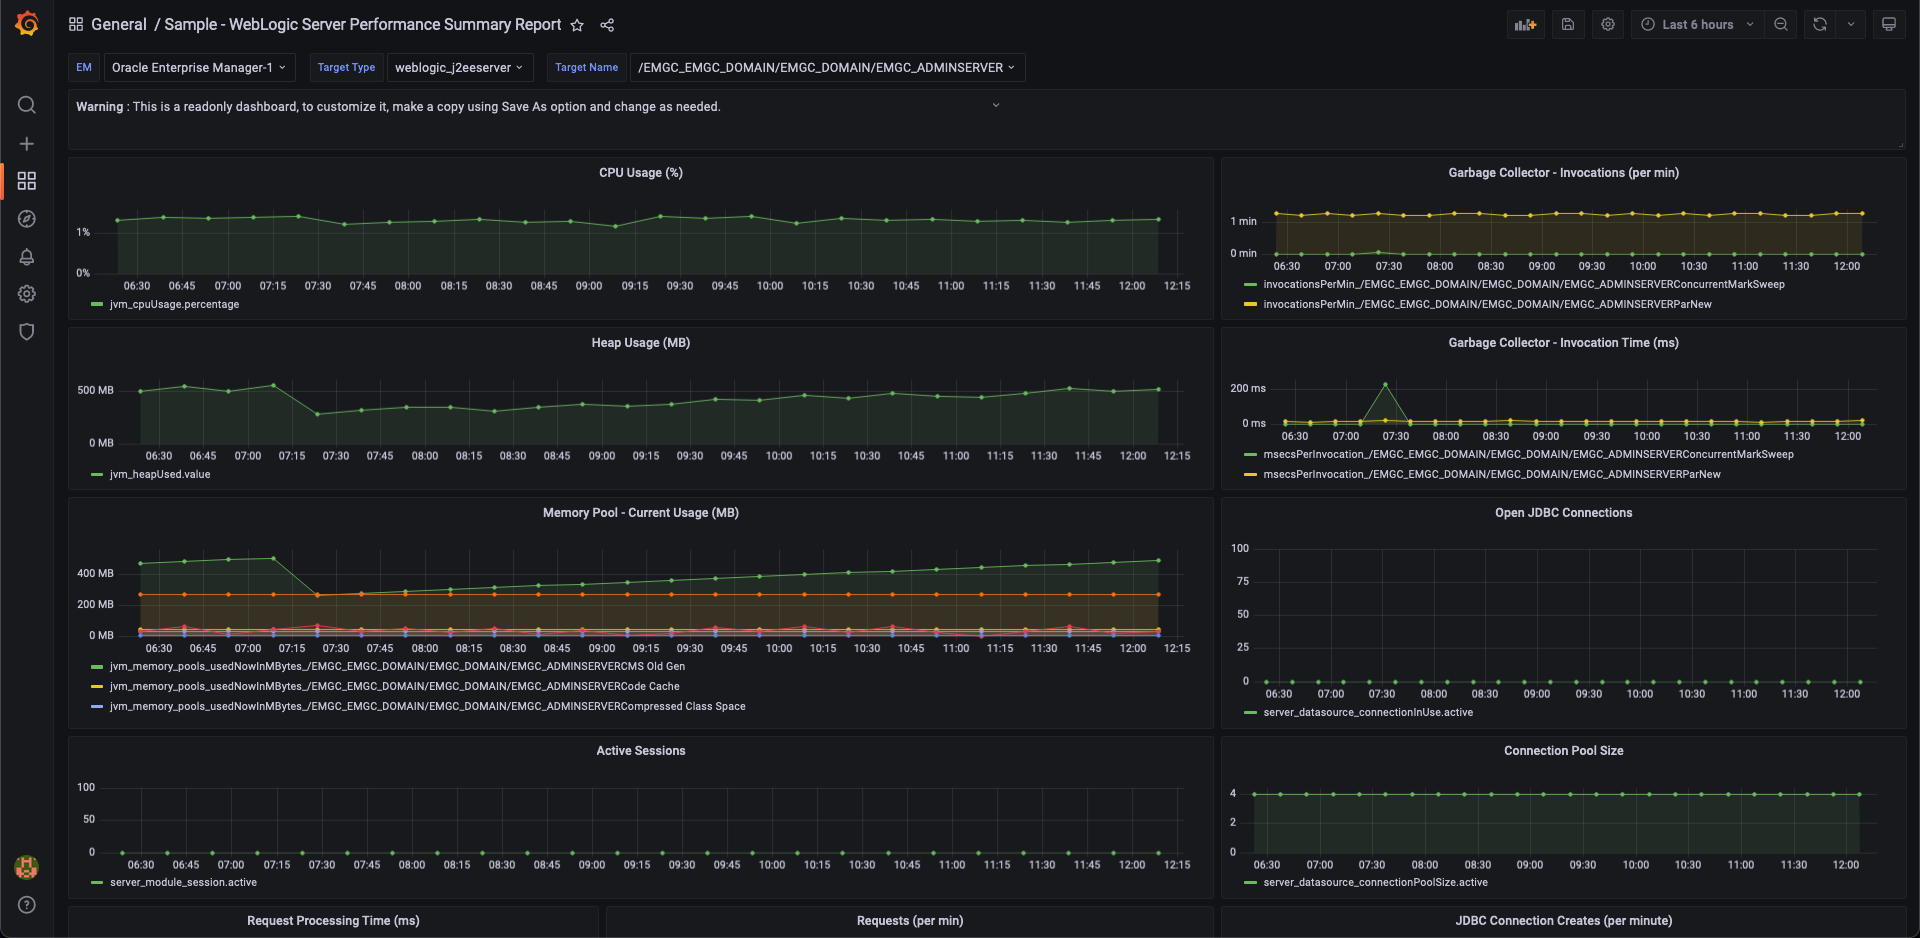
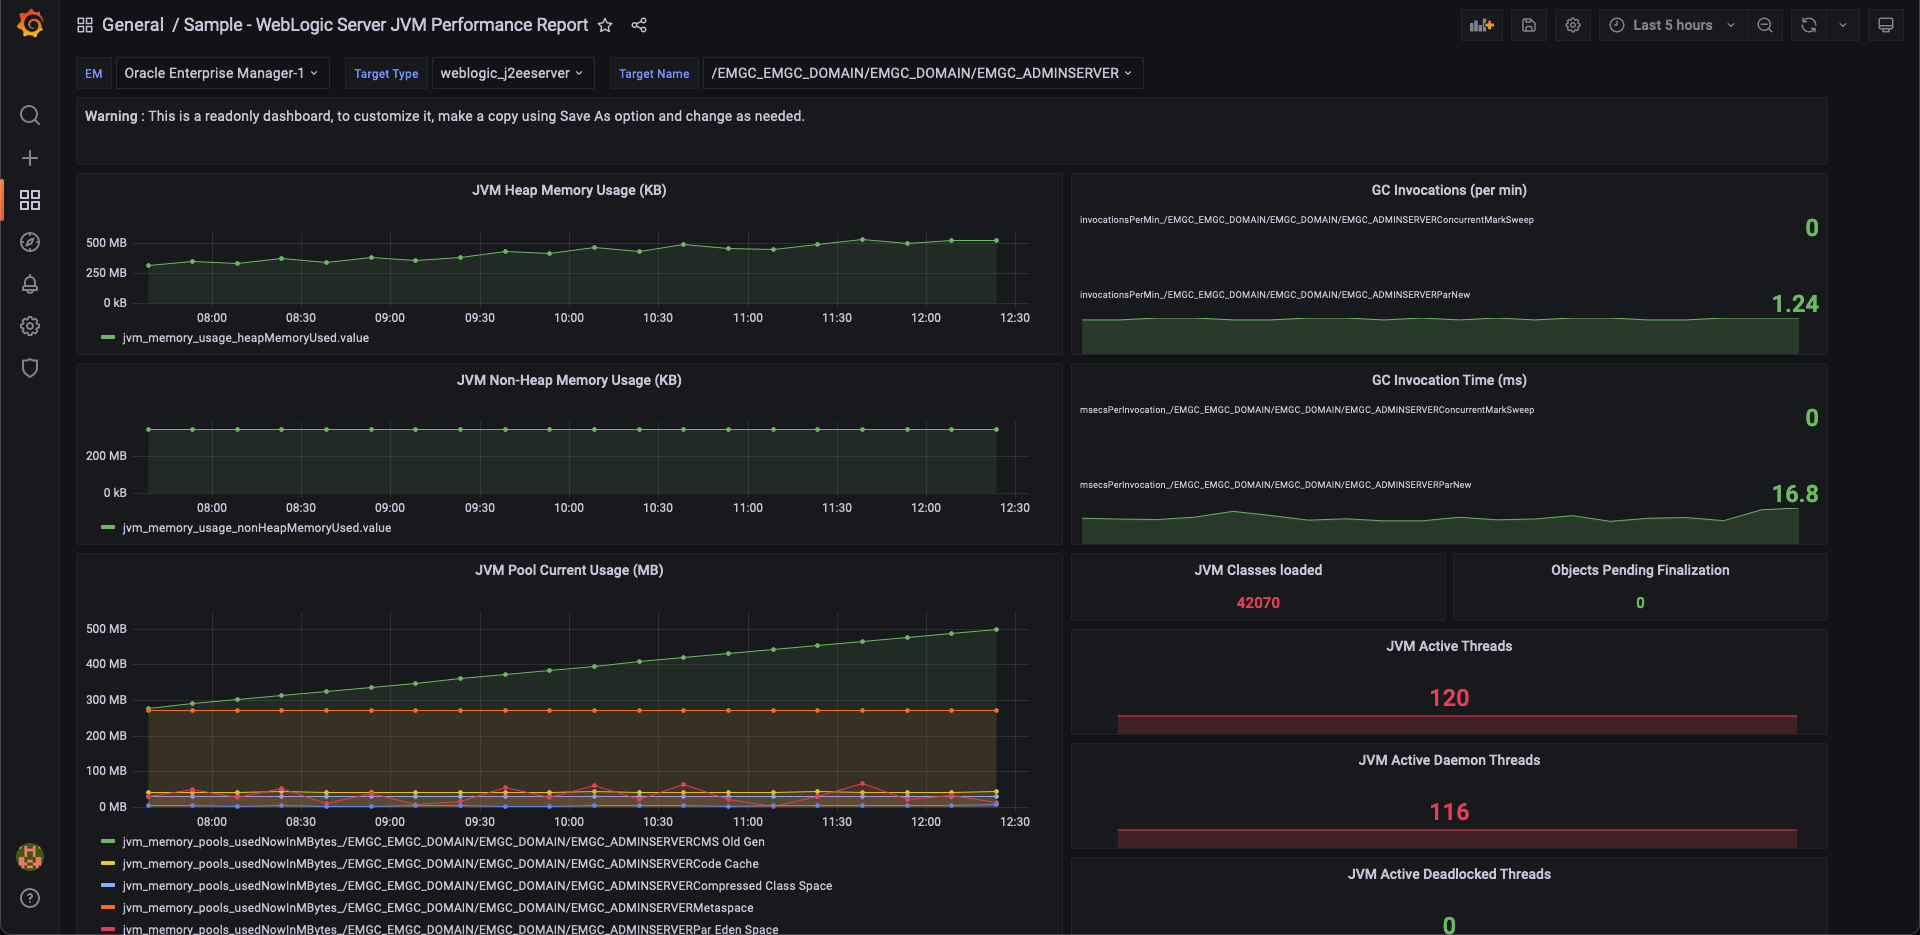
WebLogic Server JVM Performance Dashboard
