Use SQL Queries
You can create visualization panels by querying the Enterprise Manager data.
Query Builder
MGMT$ repository views, for example MGMT$METRIC_DETAILS, utilizing SQL queries.
Note:
MGMT$_views are only needed when extracting data from an Oracle Enterprise Manager Repository.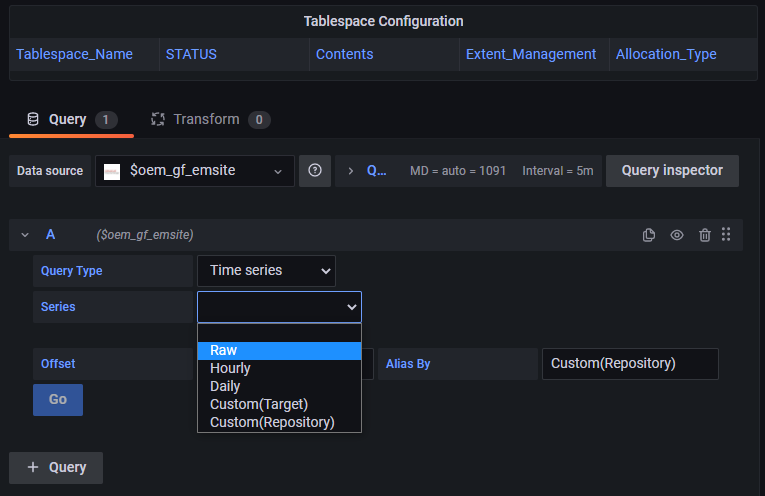
There are three built-in time series queries.
- Raw: Option pulls data from
sysman.MGMT$METRIC_DETAIL.Usage Guideline: Data kept for a month.
- Hourly: Option pulls data from
sysman.MGMT$METRIC_HOURLY.Usage Guideline: Data kept for three months.
- Daily: Option pulls data from
sysman.MGMT$METRIC_DAILY.Usage Guideline: Data kept for six months.
- Custom (Target)/Custom (Repository) Option pulls data from any tables based on your own query. You extract data from and Enterprise Manager Repository using repository views.
Note:
When writing your own timeseries SQL query, it must have following column aliases:- time_sec - This column must be a date/timestamp data type column.
- value - This column must be a number data type column.
- metric - This column must be a string data type. It can also be a hard-coded string.
SELECT
<time_column> as time_sec,
<value column> as value,
<series name column> as metric
FROM <table name>
WHERE <your where conditions>
ORDER BY <time_column> ASC;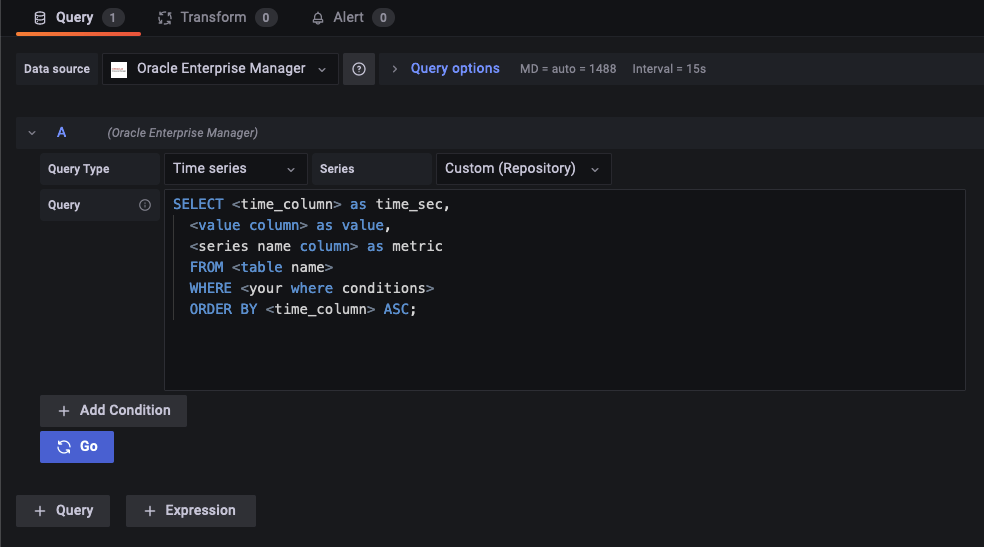
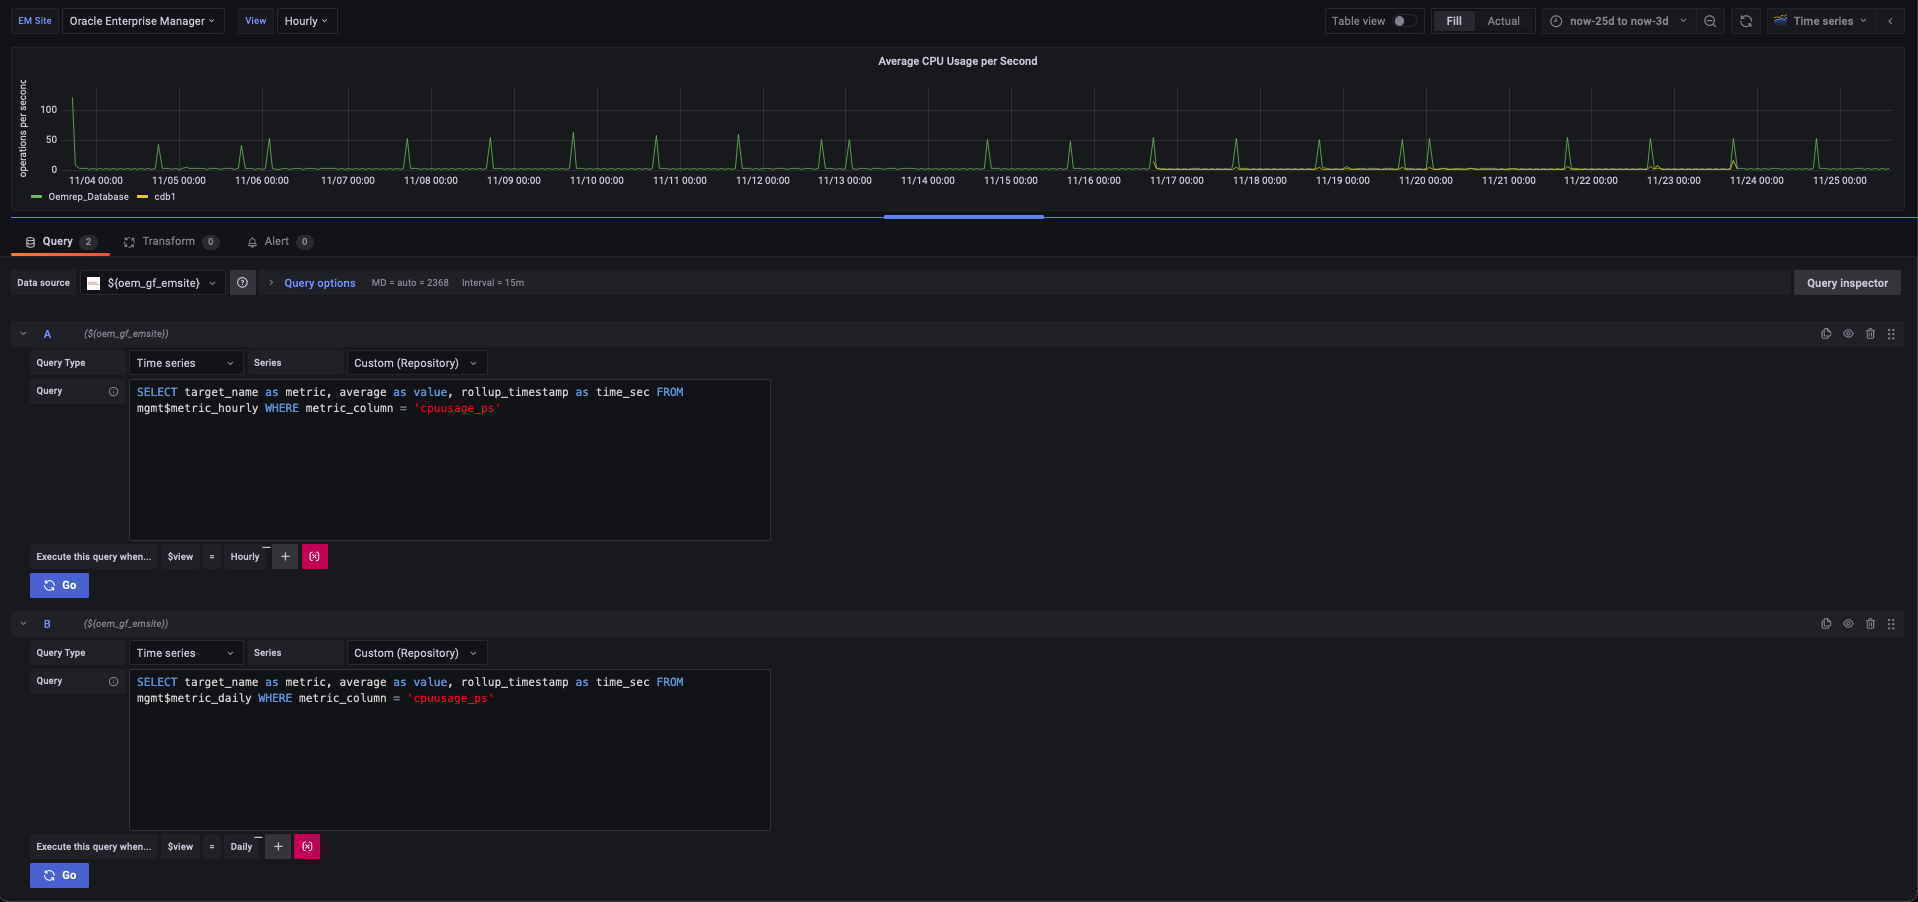
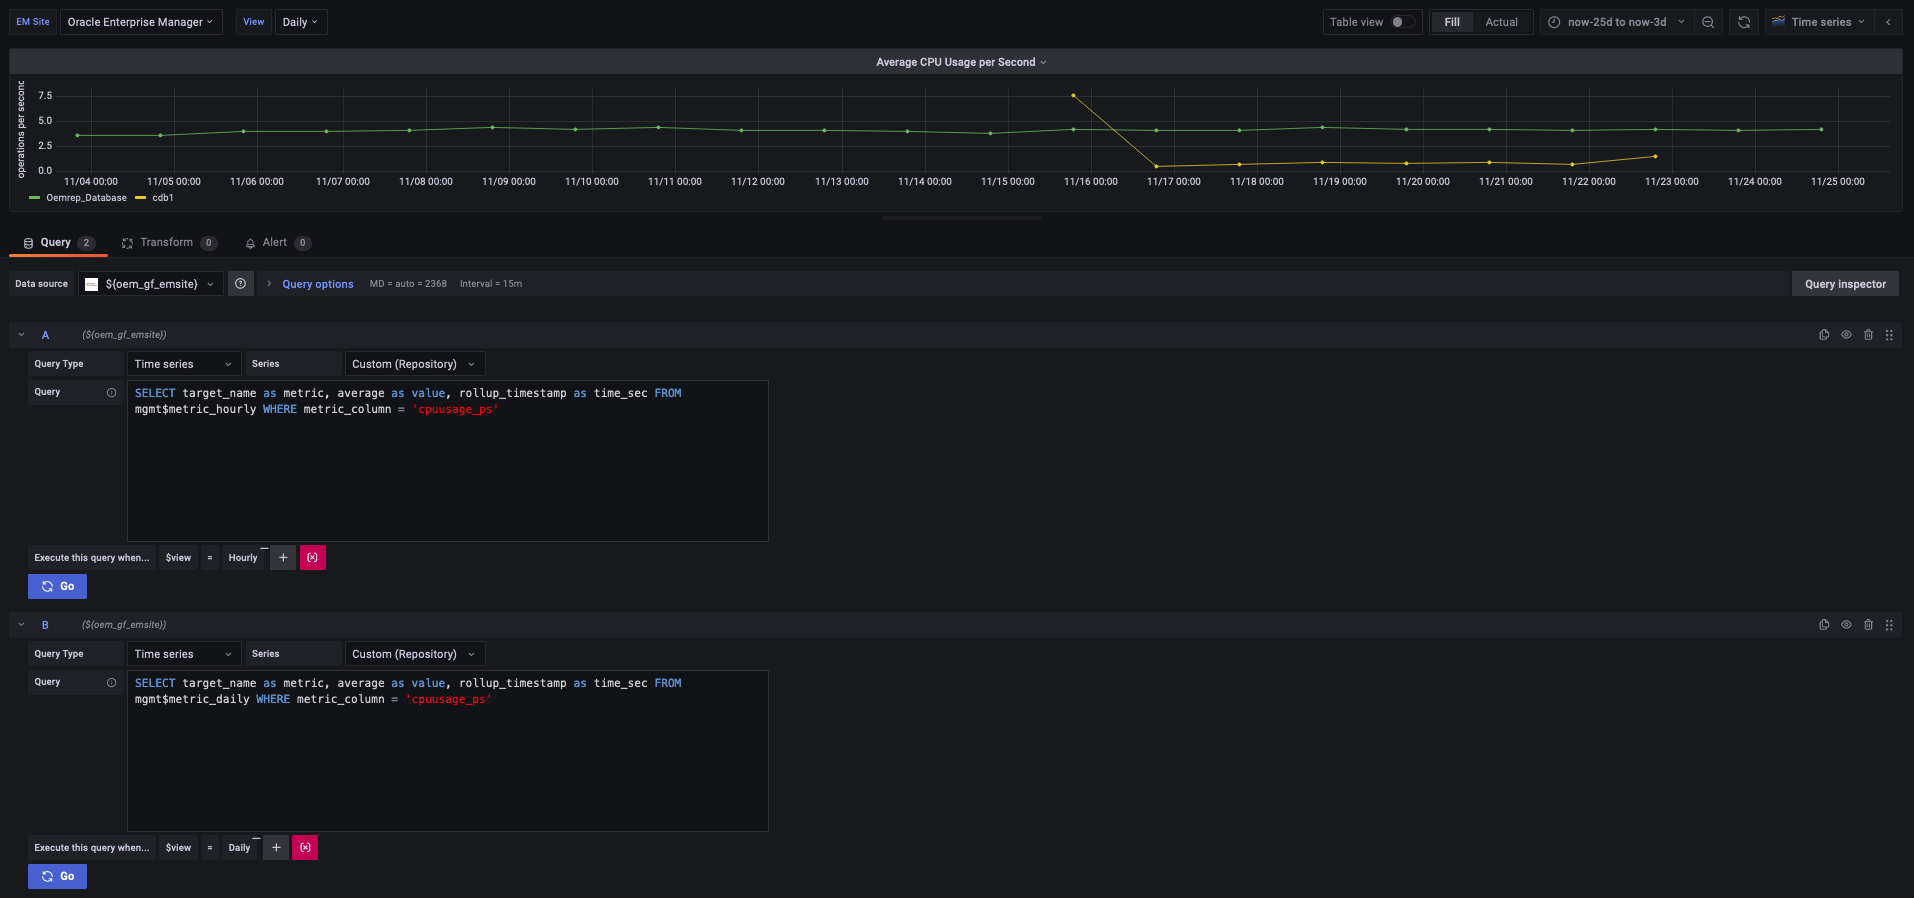
Starting with Enterprise Manager App for Grafana v4.0.0, users can condition the execution of their queries using expressions. The query will execute if and only if the expression evaluates to TRUE. The expressions are comparisons between two values, yet multiple expressions can be linked using logical operators (AND and OR). The supported comparison operators are:
- Equals: =
- Not equals: !=
- Greater than: >
- Greater than or equal to: >=
- Less than: <
- Less than or equal to: <=

Here's an example of a single dashboard panel that utilizes these filters to render data from distinct tables based on the "View" selected by a dashboard viewer. This assists dashboard designers in creating a single pane view within the same dashboard panel to customize the data rendered.
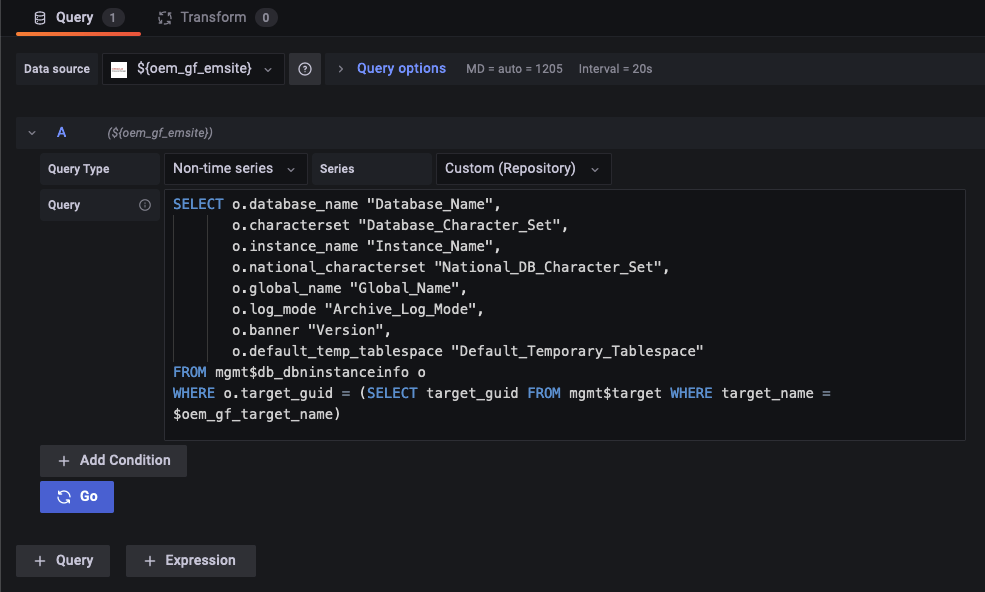
Non-time Series Query Type using MGMT$ Views
Select the Non-time series Query Type to query from the Enterprise Manager repository tables:
Note:
For more information about Enterprise Manager Management Views, see About Management Repository Views.