GraalVM Visual Studio Code Extension
The GraalVM Extension for Visual Studio Code (VS Code) provides basic support for editing and debugging programs running on GraalVM. The extension is Technology Preview.
The GraalVM extension on pair with Apache NetBeans Language Server extension will also enable a full-fledged support for Java 8 and higher, as well as Java to scripting languages polyglot debugging in VS Code.
GraalVM VSCode Extension enables a polyglot environment in VSCode, thus making it suitable and convenient to work with GraalVM from an integrated development environment, and to allow VS Code users to edit and debug applications written in any of the GraalVM supported languages (Java, JS, Ruby, R, and Python).
Table of contents
- Features
- Installation and Setup
- Java Development and Debugging
- JavaScript and Node.js Debugging
- Python Debugging
- R Debugging
- Ruby Debugging
- Polyglot Applications Debugging
- Debug Adapter Protocol
- Language Server Protocol Integration
- R Language Server
- Ruby Language Server
- Additional Editor Features
- Extension Settings
- Recommendations
- Feedback
- Privacy Policy
Features
The installation wizard for the GraalVM VS Code Extension simplifies setting up the development environment. You can now download and install any available GraalVM distribution right from the user interface, or, alternatively, you can select an existing GraalVM installation from your local disk.
The GraalVM Extension brings support for Java projects development and debugging in VS Code. This extension for VS Code also provides editing and debugging capabilities for JavaScript and Node.js, Python, R, and Ruby applications running on GraalVM by default.
The GraalVM VS Code Extension is a prerequisite for the Micronaut support in VS Code, which brings many more possibilities for Java developers.
The future development of the extension should also enable generating native executables right from the VS Code console. The development team is actively working on further improvements and are focused on tne GraalVM Extension providing high usability to developers.
Installation and Setup
To install the GraalVM Extension in VS Code, navigate to Extensions in the left-hand side Activity Bar (or use the Ctrl+Shift+X hot keys combination). Search for “GraalVM” in the search field. Once found, press Install. That action will install the GraalVM Extension from the VS Code Marketplace. Reload will be required.
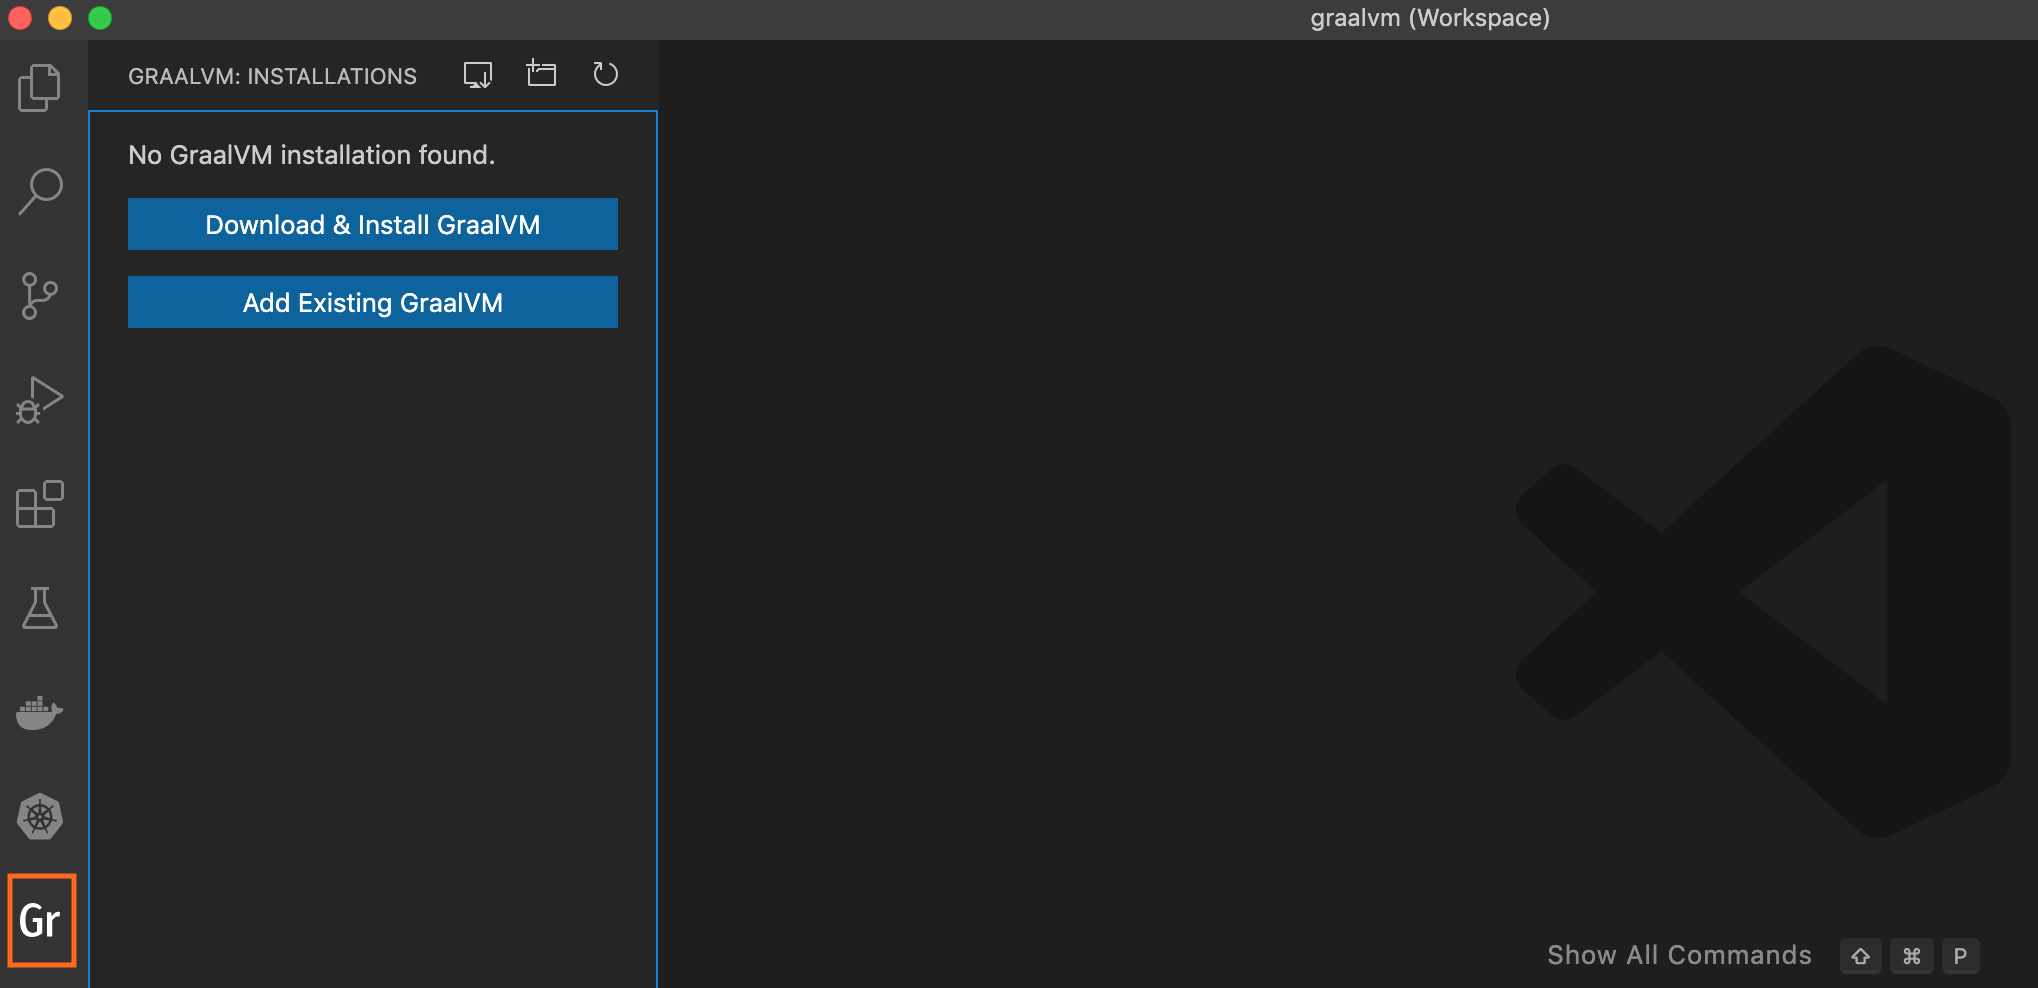
Once installed, notice the “Gr” icon in the left-hand side Activity Bar. By clicking on the icon, a dialogue with the following choices displays:
- Download & Install GraalVM
- Add Existing GraalVM
Download & Install GraalVM
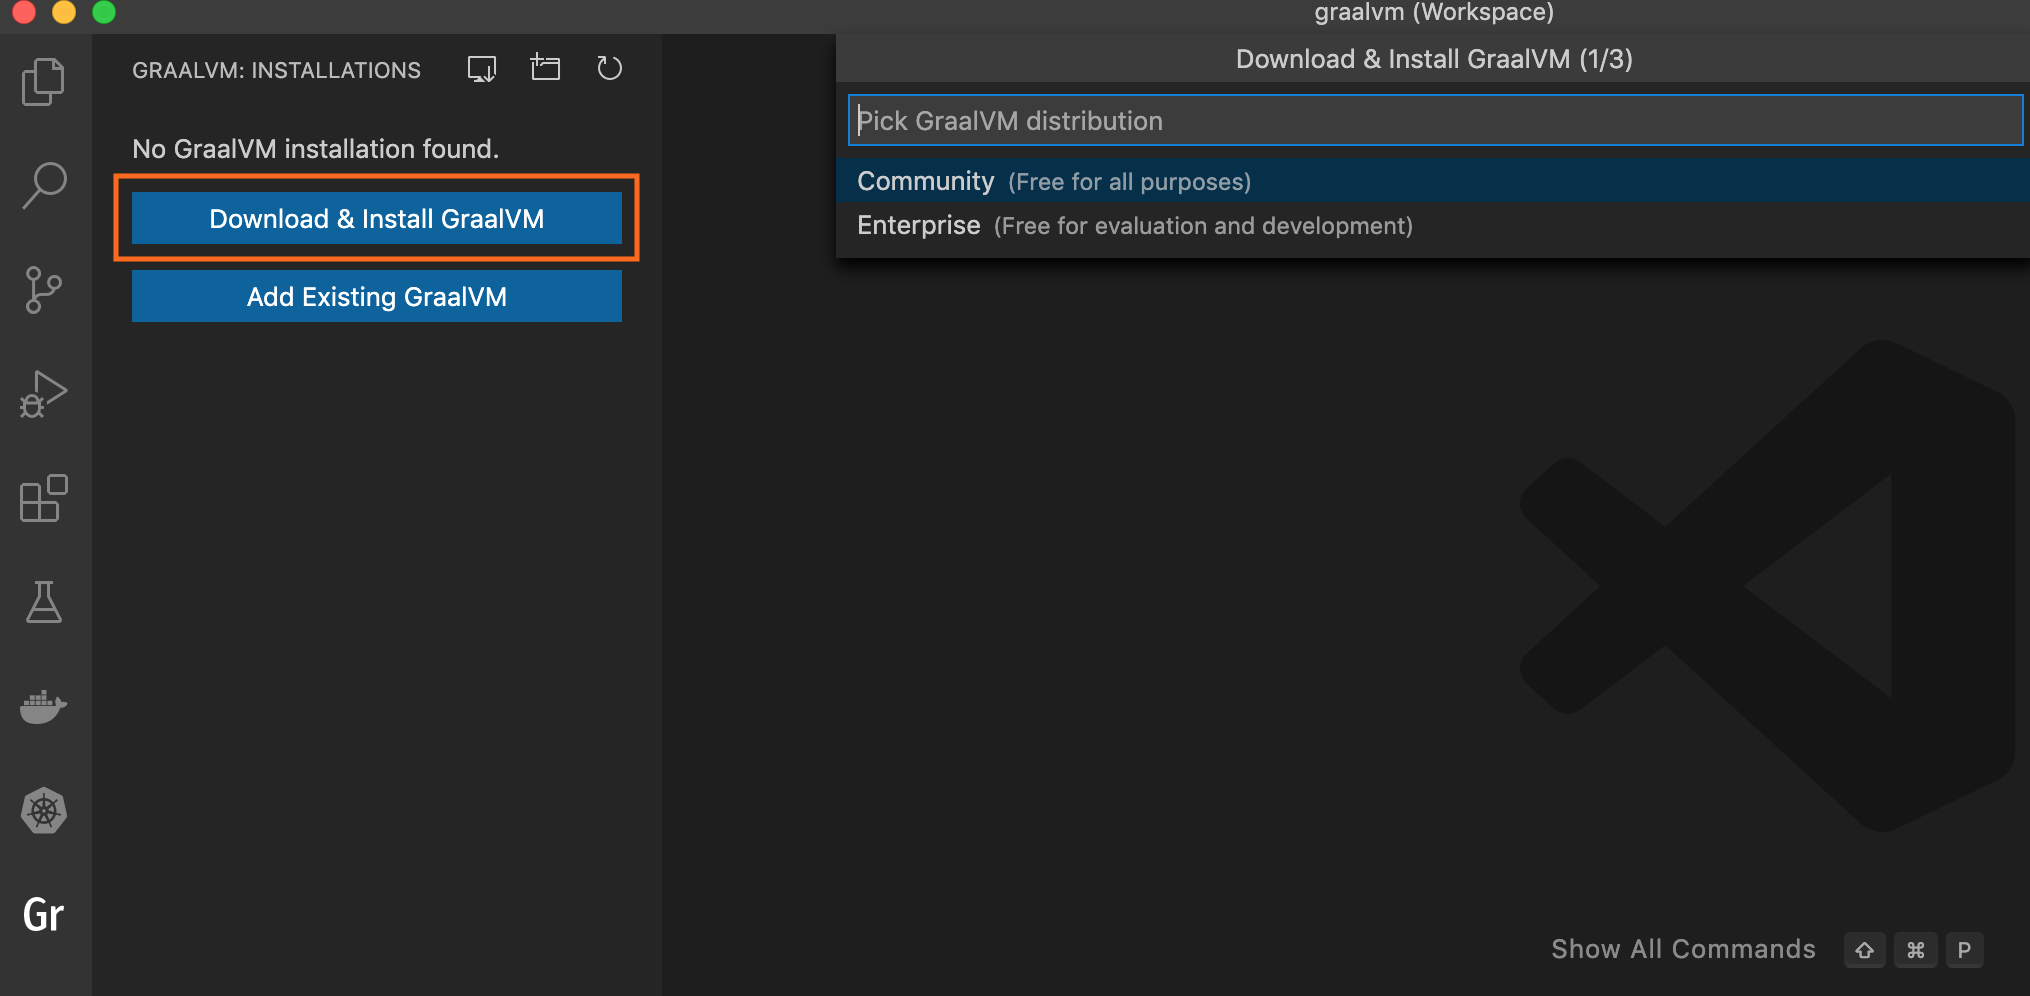
The Download & Install GraalVM action prompts you to:
- Pick the GraalVM distribution: Community (free for all purposes) or Enterprise (free for evaluation and development).
- Pick the GraalVM version: Current (20.3), Annual (19.3), Latest Snapshot (Nightly Build 21.0-dev).
- Pick a Java version: 8 or 11.
- Select the destination folder.
If you prefer GraalVM Community Edition, the installation wizard will download the package from Github in the background and display the progress.
If you select GraalVM Enterprise Editon, you will be prompted to accept the Oracle Technology Network License Agreement and requested to enter your email address. Providing your email address is optional, but if you do not enter it, the GraalVM Enterprise Edition License will prompt everytime.

The installation wizard will download the package from Oracle Software Downloads in the background and display the progress.
If you are behind a proxy, setup your proxy configuration by the “Setup Proxy” command or by overriding the http_proxy and https_proxy environment variables.
Upon completion, the “Set as Default Java” action is invoked. At the same time, the “Install Optional GraalVM Components” window pops up:
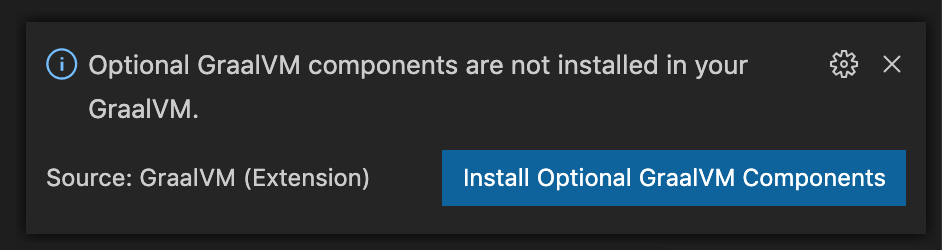
Once you confirm, you are taken to the selection list:
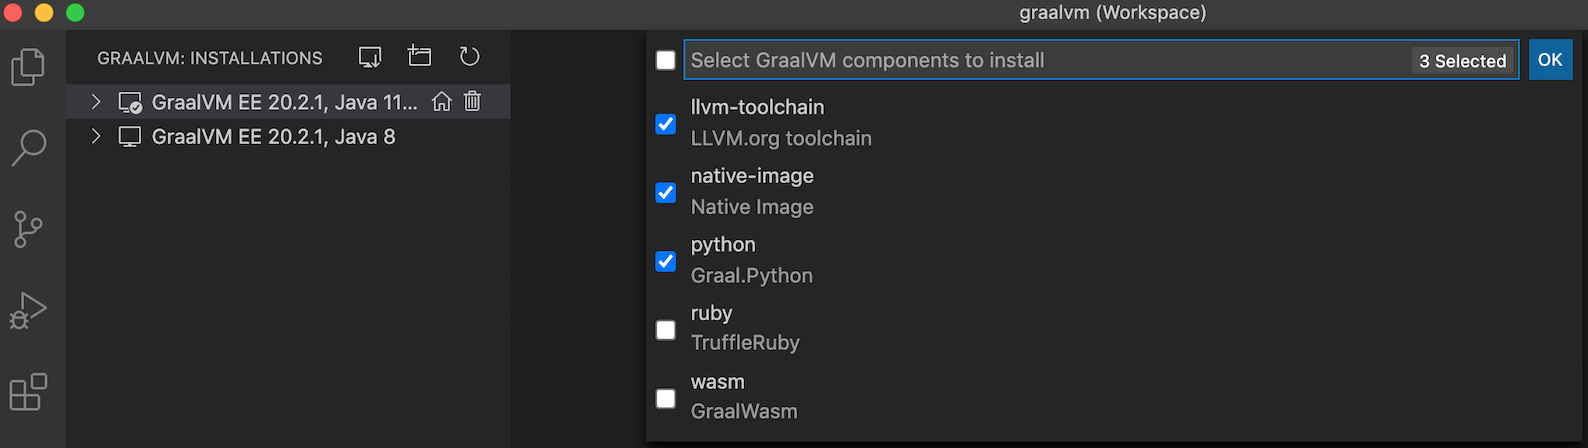
Note: You can download and install multiple GraalVM distributions and components at the same time.
Add Existing GraalVM
The “Add Existing GraalVM” action allows you to select the existing GraalVM installation from your local disk. As in the previous installation scenario, you are prompted to set the GraalVM installation as default, and to install optional components, if not already installed.
The “Add Existing GraalVM” action can also be invoked by using an icon on the side of the “GRAALVM: INSTALLATIONS” panel. To make a newly added GraalVM runtime active, you can use the “home” icon by the side of the installation.
![]()
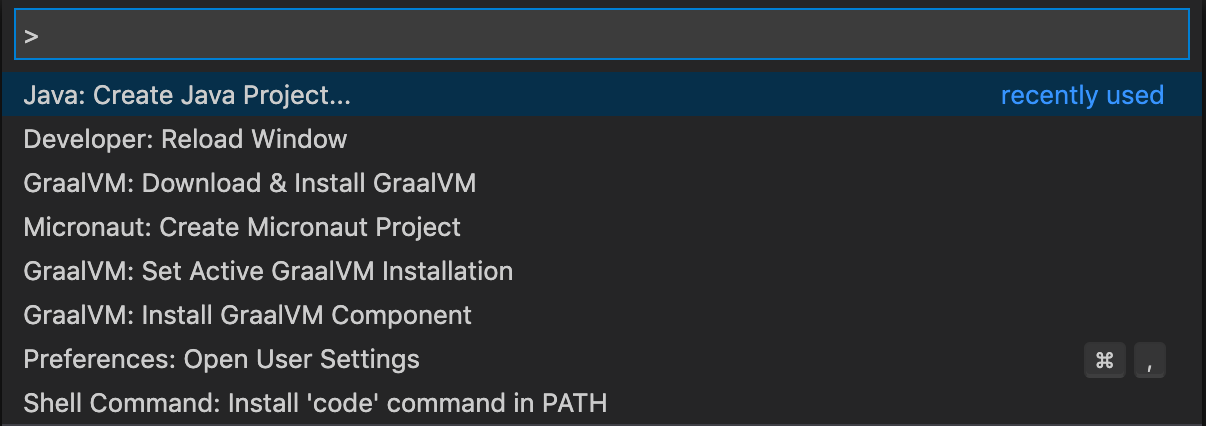
Alternatively, you can invoke the same actions from the View > Command Palette (Command Palette can be also opened by pressing F1, or the Ctrl+Shift+P hot keys combination for Linux, and Command+Shift+P for macOS):
- GraalVM: Download & Install GraalVM
- GraalVM: Install GraalVM Component
- GraalVM: Set Active GraalVM Installation
Each registered GraalVM instance displays its installation location and all its available components. The active one is placed on top. Components are either installed or available for download - the context actions to install (the plus icon) or remove (the bucket icon) are displayed when hovering over the component name.

All registered GraalVM instances for java.home will be listed in the configuration file under File > Preferences > Settings (Code > Preferences > Settings on macOS).
This installation model greatly simplifies setting up the GraalVM development environment in VS Code:
- It permits multiple GraalVM and components installations at the same time.
- It allows an easy switch from one runtime version to another.
- It enables quick removal of unnecessary GraalVM installations from VS Code global storage or even from your local disk.
The “Download & Install GraalVM” action is a preferable way, as it eliminates the fuss around setting up environment variables and prepares the GraalVM runtime in VS Code for you.
Java Development and Debugging
To enable support for Java development with GraalVM in VS Code, you have to install the Apache NetBeans Language Server extension. Reload will be required.
To start developping or debugging Java applications, ensure GraalVM is used as your Java runtime in VS Code.
If the current path is not pointing to the GraalVM folder, go to the User Settings window and use the netbeans.jdkhome value in the settings.json file.
This configuration is then used to launch the Java Language Server.
The project you create from scratch or a Java project you open in VS Code will run in the GraalVM runtime.
To debug a Java application running on GraalVM, creating a launch configuration for the application is necessary. Having opened the file to be debugged or run in VS Code, switch to the Debug view by clicking on the “bug” icon in the left-hand side panel. The newly opened window will suggest you create a launch.json file:
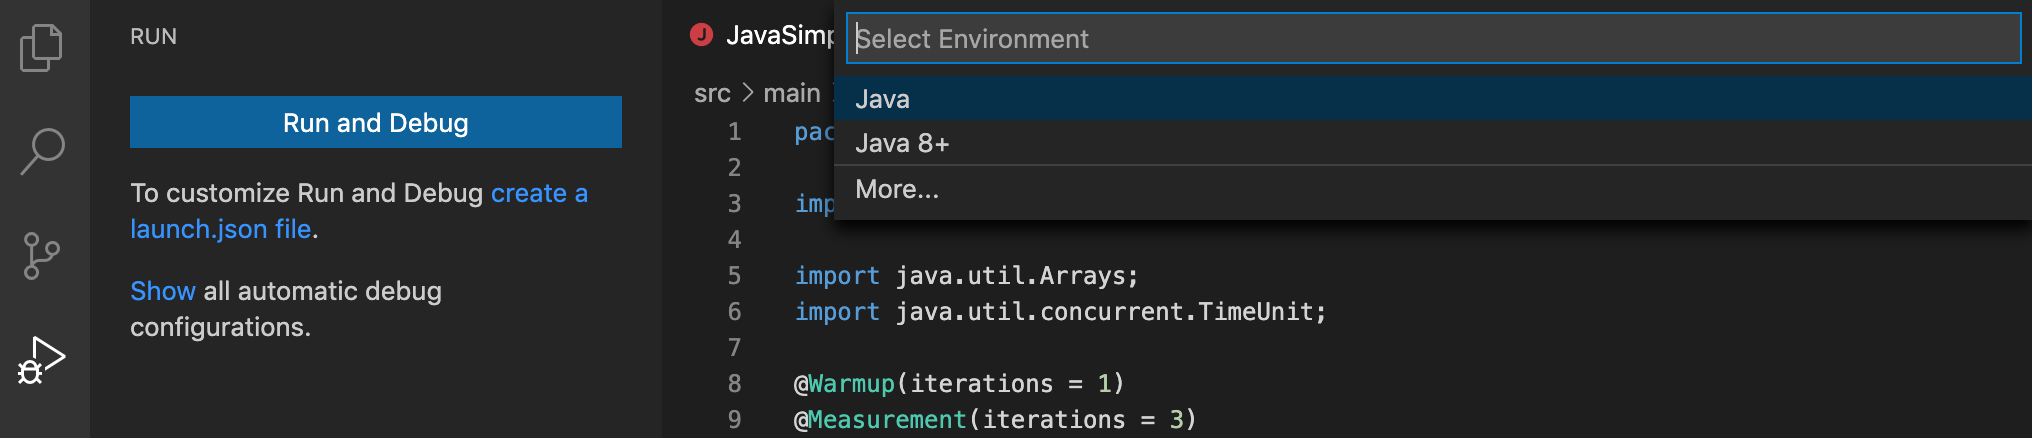
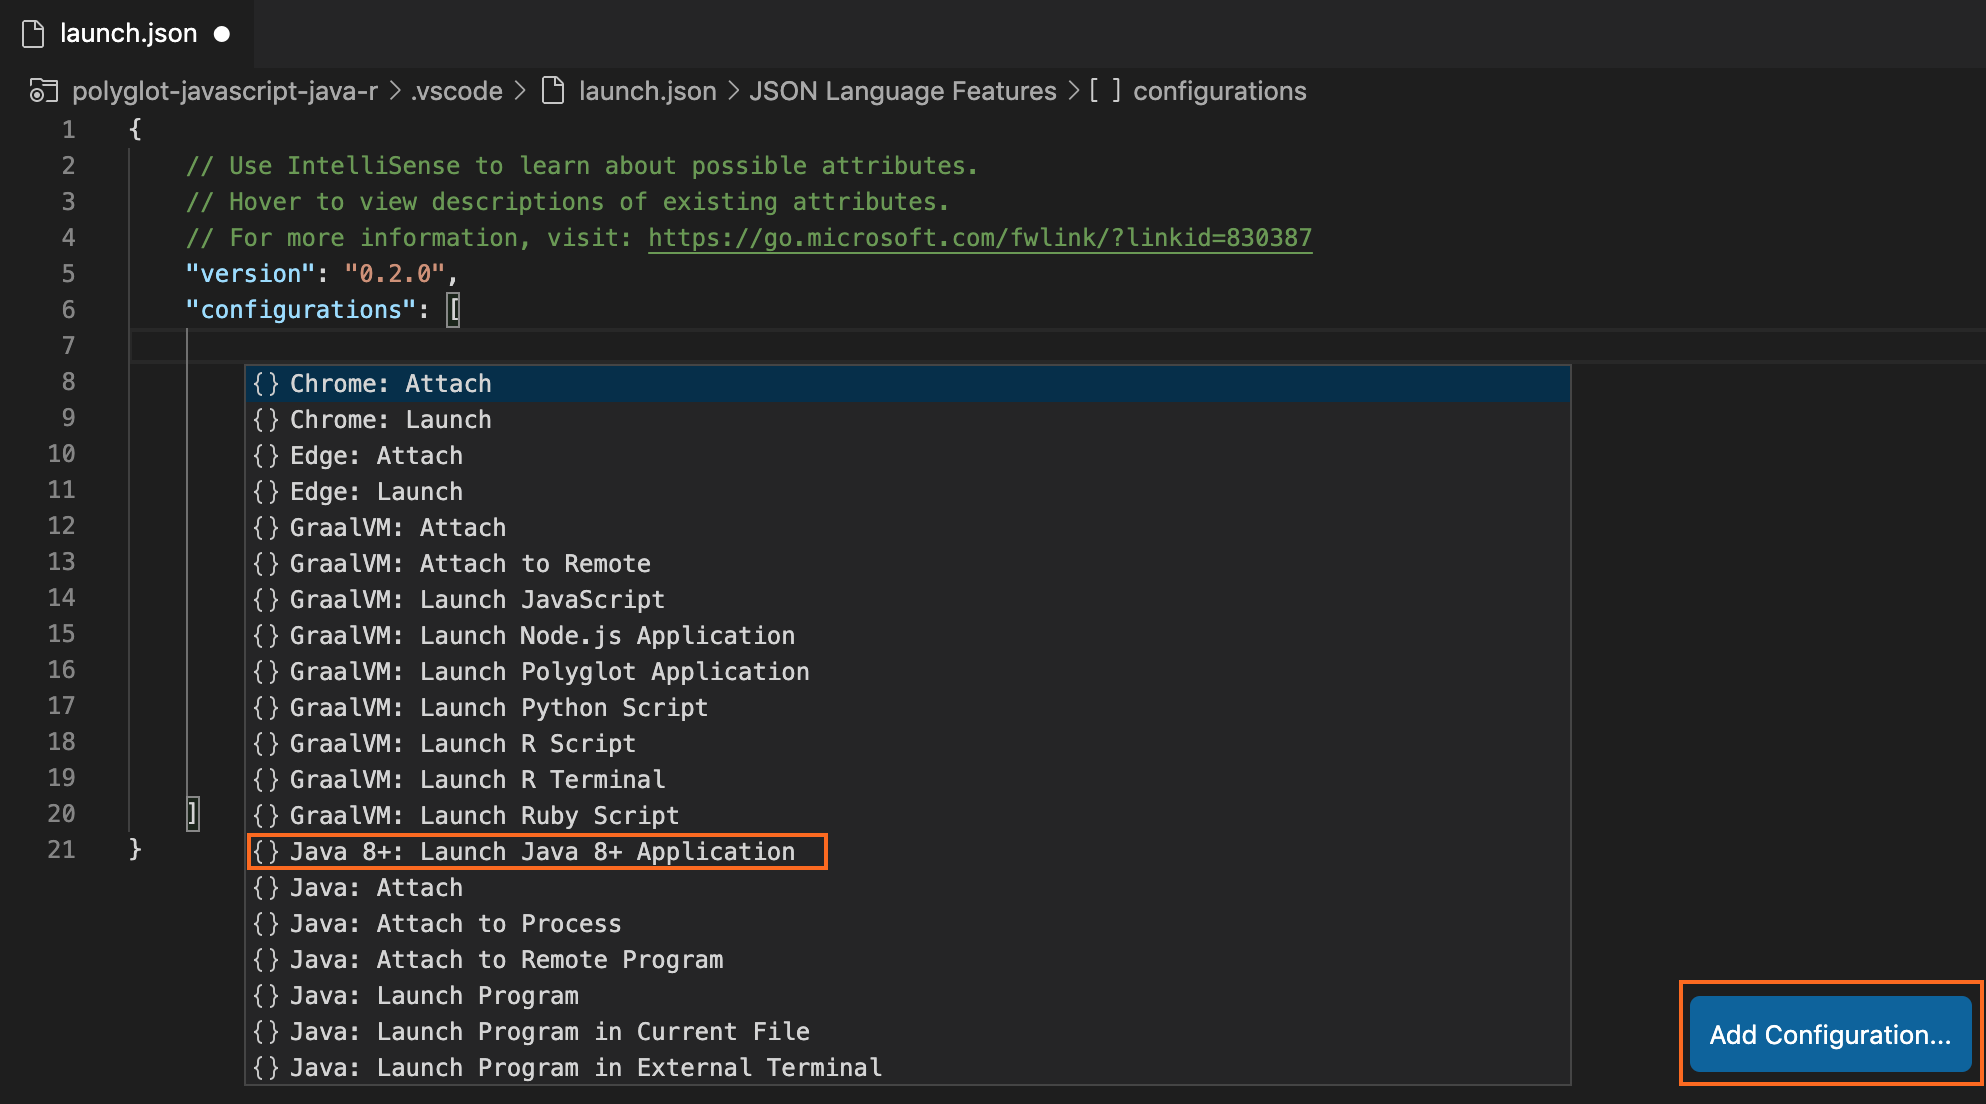
Make sure to select the “Java 8+” environment. To start debugging, press F5 or navigate to Run > Start Debugging. To add more launch configurations, navigate to Run > Add Configuration or open the .vscode/launch.json file and press the Add Configuration button in the right-hand corner.
JavaScript and Node.js Debugging
To debug a JavaScript or Node.js application running on GraalVM, creating a launch configuration for the application is necessary. To do so, open the application project folder in VS Code (File > Open Folder), then switch to the Debug view by clicking on the “bug” icon in the left-hand side panel. The newly opened window will suggest you create a launch.json file.
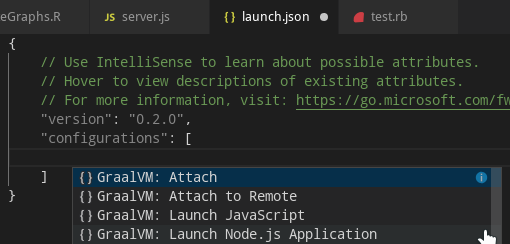
If debugging is not yet configured (no launch.json has been created), select GraalVM from the list of available debug environmnets.
The following techniques can be used to add a new configuration:
- Use IntelliSense if your cursor is located inside the configurations array.
- Press the Add Configuration button to invoke snippet IntelliSense at the start of the array.
- Choose Add Configuration option in the Debug menu.
Note: The attributes available in launch configurations vary from configuration to configuration. You can use IntelliSense suggestions (Ctrl+Space) to find out which attributes exist for a specific debug configuration. Hover help is also available for all attributes.
The GraalVM extension provides the following debug configurations that can be used to run and debug JavaScript and Node.js applications running on GraalVM:
- Launch Node.js Application - Launches a Node.js Application using GraalVM in a debug mode.
- Launch JavaScript - Launches a JavaScript using GraalVM in a debug mode.
- Attach - Attaches debugger to a locally running GraalVM runtime.
- Attach to Remote - Attaches debugger to the debug port of a remote GraalVM runtime.
You now have the possibility to choose which debugging protocol to use (Debug Adapter Protocol or Chrome Dev Tools protocol) by setting the protocol attribute in the corresponding debug configuration to either chromeDevTools or debugAdapter.
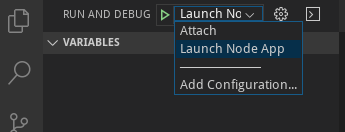
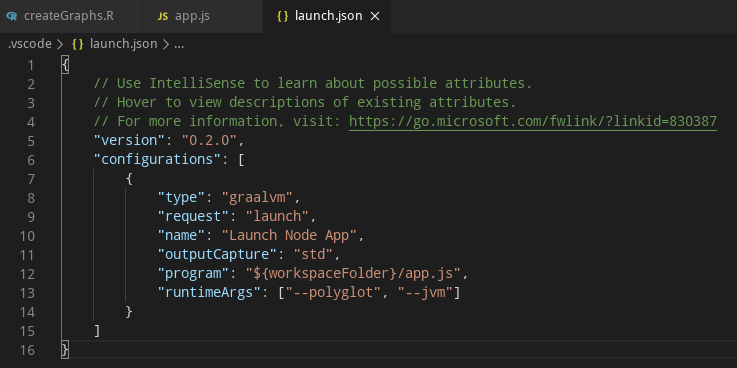
For example, to connect to the open Debug Adapter Protocol port, the content of the launch.json should be:
{
    "version": "0.2.0",
    "configurations": [
        {
            "type": "graalvm",
            "request": "launch",
            "name": "Launch Node App",
            "outputCapture": "std",
            "protocol": "debugAdapter",
            "program": "${workspaceFolder}/App.js"
        }
    ]
}
In order to start a debug session, first select the proper configuration using the Configuration drop-down in the Debug view. Once you have your launch configuration set, start your debug session with F5. Alternatively, you can run your configuration through the Command Palette (Command Palette can be opened by pressing F1, or the Ctrl+Shift+P hot keys combination for Linux, and Command+Shift+P for macOS). Set filtering to Debug: Select and Start Debugging, or type “debug” and select the configuration you want to debug.
Python Debugging
To debug a Python application running on GraalVM, creating a launch configuration for the application is necessary.
To do so, open the application project folder in VS Code (File > Open Folder), then switch to the Debug view by clicking on the “bug” icon in the left-hand side panel. The newly opened window will suggest you create a launch.json file.
If debugging is not yet configured (no launch.json has been created), select GraalVM from the list of available debug environmnets.
Once the launch.json file is opened in the editor, one of the following techniques can be used to add a new configuration:
- Use IntelliSense if your cursor is located inside the configurations array.
- Press the Add Configuration button to invoke snippet IntelliSense at the start of the array.
- Choose Add Configuration option in the Debug menu.
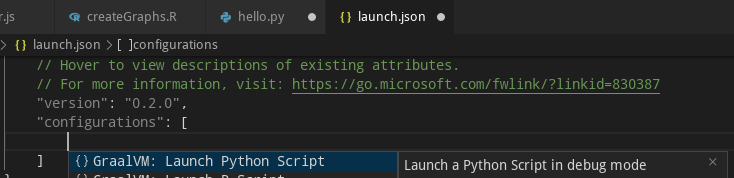
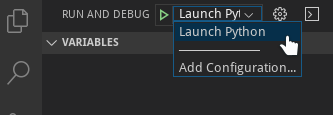
The GraalVM Python extension provides the following debug configuration that can be used to debug Python applications/scripts running on GraalVM:
- Launch Python Script - Launches a Python script using GraalVM in a debug mode.
You now have the possibility to choose which debugging protocol to use (Debug Adapter Protocol or Chrome Dev Tools protocol) by setting the protocol attribute in the corresponding debug configuration to either chromeDevTools or debugAdapter.
For example, to connect to the Chrome Dev Tools protocol port, the content of the launch.json should be:
{
    "version": "0.2.0",
    "configurations": [
        {
            "type": "graalvm",
            "request": "launch",
            "name": "Launch Python App",
            "outputCapture": "std",
            "protocol": "chromeDevTools",
            "program": "${workspaceFolder}/App.py"
        }
    ]
}
When editing debug configurations, you can use IntelliSense suggestions (Ctrl+Space) to find out which attributes exist for a specific debug configuration. Hover help is also available for all attributes.
In order to start a debug session, first select the proper configuration using the Configuration drop-down in the Debug view. Once you have your launch configuration set, start your debug session with F5. Alternatively, you can run your configuration through the Command Palette (Command Palette can be also opened by pressing F1, or Ctrl+Shift+P hot keys combination for Linux and Command+Shift+P for macOS), by filtering on Debug: Select and Start Debugging or typing “debug”, and selecting the configuration you want to debug.
R Debugging
To debug an R application running on GraalVM, creating a launch configuration for the application is necessary.
To do so, open the application project folder in VS Code (File > Open Folder), then switch to the Debug view by clicking on the “bug” icon in the left-hand side panel. The newly opened window will suggest you create a launch.json file.
If debugging is not yet configured (no launch.json has been created), select GraalVM from the list of available debug environmnets.
Once the launch.json file is opened in the editor, one of the following techniques can be used to add a new configuration:
- Use IntelliSense if your cursor is located inside the configurations array.
- Press the Add Configuration button to invoke snippet IntelliSense at the start of the array.
- Choose Add Configuration option in the Debug menu.
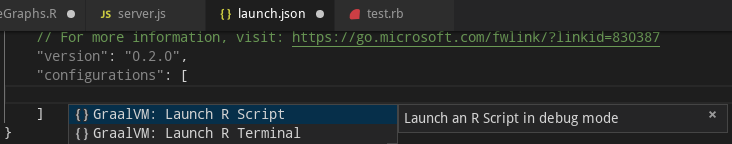
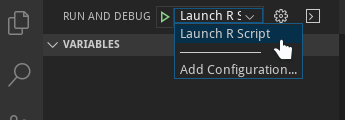
The GraalVM R extension provides the following debug configurations that can be used to debug R applications/scripts running on GraalVM:
- Launch R Script - Launches an R script using GraalVM in a debug mode.
- Launch R Terminal - Launches an integrated R terminal running on GraalVM in a debug mode.
You now have the possibility to choose which debugging protocol to use (Debug Adapter Protocol or Chrome Dev Tools protocol) by setting the protocol attribute in the corresponding debug configuration to either chromeDevTools or debugAdapter.
For example, to connect to the Chrome Dev Tools protocol port, the content of the launch.json should be:
{
    "version": "0.2.0",
    "configurations": [
        {
            "type": "graalvm",
            "request": "launch",
            "name": "Launch R Script",
            "outputCapture": "std",
            "protocol": "chromeDevTools",
            "program": "${workspaceFolder}/App.r"
        }
    ]
}
When editing debug configurations, you can use IntelliSense suggestions (Ctrl+Space) to find out which attributes exist for a specific debug configuration. Hover help is also available for all attributes.
In order to start a debug session, first select the proper configuration using the Configuration drop-down in the Debug view. Once you have your launch configuration set, start your debug session with F5. Alternatively, you can run your configuration through the Command Palette (Command Palette can be also opened by pressing F1, or Ctrl+Shift+P hot keys combination for Linux and Command+Shift+P for macOS), by filtering on Debug: Select and Start Debugging or typing “debug”, and selecting the configuration you want to debug.
Ruby Debugging
To debug a Ruby application running on GraalVM, creating a launch configuration for the application is necessary.
To do so, open the application project folder in VS Code (File > Open Folder), then switch to the Debug view by clicking on the “bug” icon in the left-hand side panel. The newly opened window will suggest you create a launch.json file.
If debugging is not yet configured (no launch.json has been created), select GraalVM from the list of available debug environmnets.
Once the launch.json file is opened in the editor, one of the following techniques can be used to add a new configuration:
- Use IntelliSense if your cursor is located inside the configurations array.
- Press the Add Configuration button to invoke snippet IntelliSense at the start of the array.
- Choose Add Configuration option in the Debug menu.
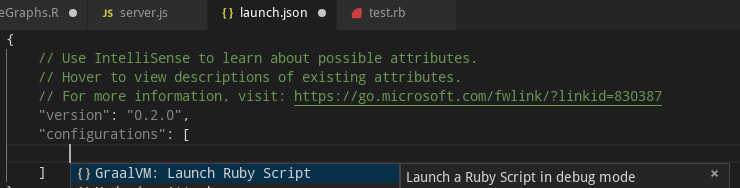
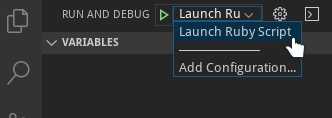
The GraalVM Ruby extension provides the following debug configuration that can be used to debug Ruby applications/scripts running on GraalVM:
- Launch Ruby Script - Launches a Ruby script using GraalVM in a debug mode.
You now have the possibility to choose which debugging protocol to use (Debug Adapter Protocol or Chrome Dev Tools protocol) by setting the protocol attribute in the corresponding debug configuration to either chromeDevTools or debugAdapter.
For example, to connect to the Chrome Dev Tools protocol port, the content of the launch.json should be:
{
    "version": "0.2.0",
    "configurations": [
        {
            "type": "graalvm",
            "request": "launch",
            "name": "Launch Ruby App",
            "outputCapture": "std",
            "protocol": "chromeDevTools",
            "program": "${workspaceFolder}/App.rb"
        }
    ]
}
When editing debug configurations, you can use IntelliSense suggestions (Ctrl+Space) to find out which attributes exist for a specific debug configuration. Hover help is also available for all attributes.
In order to start a debug session, first select the proper configuration using the Configuration drop-down in the Debug view. Once you have your launch configuration set, start your debug session with F5. Alternatively, you can run your configuration through the Command Palette (Command Palette can be also opened by pressing F1, or Ctrl+Shift+P hot keys combination for Linux and Command+Shift+P for macOS), by filtering on Debug: Select and Start Debugging or typing “debug”, and selecting the configuration you want to debug.
Polyglot Applications Debugging
To run a polyglot application on GraalVM in VS Code, you have to either pass the --polyglot option to any of the existing application lauchers (e.g., js --polyglot or node --polyglot), or use an experimental launcher called polyglot that runs code for JavaScript, Python, Ruby, and R without requiring the selection of a primary language.
The polyglot launcher does not require the --polyglot option, it is enabled by default.
For more information see the GraalVM polyglot documentation.
To debug a polyglot application on GraalVM in VS Code, creating a launch configuration for the application is necessary.
To do so, open the application project folder in VS Code (File > Open Folder), switch to the Debug view by clicking on the “bug” icon in the left-hand side panel. The newly opened window will suggest to create a launch.json file.
If debugging is not yet configured (no launch.json has been created), select GraalVM from the list of available debug environmnets.
Once the launch.json file is opened in the editor, one of the following techniques can be used to add a new configuration:
- Use IntelliSense if your cursor is located inside the configurations array.
- Press the Add Configuration button to invoke snippet IntelliSense at the start of the array.
- Choose Add Configuration option in the Debug menu.
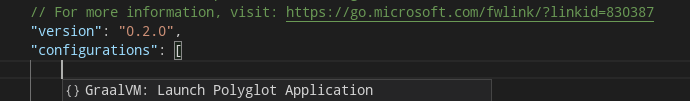
The GraalVM extension provides the following debug configuration that can be used to debug an applications running on GraalVM using the polyglot launcher:
- Launch Polyglot Application - Launches a Polyglot Application in a debug mode.
You now have the possibility to choose which protocol (Debug Adapter Protocol or Chrome Dev Tools protocol) to use to debug a polyglot application by setting the protocol attribute in the corresponding debug configuration to either chromeDevTools or debugAdapter.
For example, to connect to the Chrome Dev Tools protocol port, the content of the launch.json can be:
{
    "version": "0.2.0",
    "configurations": [
        {
            "type": "graalvm",
            "request": "launch",
            "name": "Launch Polyglot App",
            "outputCapture": "std",
            "protocol": "chromeDevTools",
            "program": "${workspaceFolder}/polyglot.js"
        }
    ]
}
Alternatively, to pass the --polyglot option to any of the existing application launchers, add the runtimeArgs attribute containing the --polyglot value to their respective debug configurations.
Note: In some cases (polyglot application calls Java or R, or native launcher accesses languages installed with gu without rebuilding images), also passing the --jvm option is necessary.
Debug Adapter Protocol
When creating the Run/Debug Configurations in VS Code, Chrome DevTools Protocol is provisioned by default. However, GraalVM provides a built-in implementation of the Debug Adapter Protocol (DAP) and, with the GraalVM Extention for VS Code, a user now can choose a protocol to use by setting the protocol attribute in the corresponding debug configuration to either chromeDevTools or debugAdapter.
To open a debugger port serving the Debug Adapter Protocol, you need to pass the --dap option to the command-line launcher.
Other available options to pass to GraalVM’s Debug Adapter Protocol are:
--dap.Suspend=false: Disable the execution suspension at first source line, enabled by default.--dap.WaitAttached: Do not execute any source code until debugger client is attached. The default is false.--dap=<[[host:]port]>: Start the debugger on a different port than default (<host>:4711).
Then you need a DAP client to connect to the open DAP port. To connect to the open DAP port, the content of launch.json for a Node.js application, for example, should be:
{
    "version": "0.2.0",
    "configurations": [
        {
            "type": "graalvm",
            "request": "launch",
            "name": "Launch Node App",
            "outputCapture": "std",
            "protocol": "debugAdapter",
            "program": "${workspaceFolder}/App.js"
        }
    ]
}
The advantage of using the Debug Adapter Protocol over Chrome Dev Tools is that (1) it is ‘native’ to Visual Studio Code (VS Code), meaning it does not require any intermediate translatation, and (2) it supports multithreading, which can be particually useful to debug, e.g., a Ruby application.
Language Server Protocol Integration
GraalVM supports smart editing features of development tools used to create guest language applications by providing a built-in implementation of the Language Server Protocol. This allows you to attach compatible development tools such as VS Code to GraalVM and to get features like auto complete, go to declaration, or documentation on hover.
Currently, GraalVM’s Language Server Protocol implementation supports the following services:
- Text Document Synchronization
- Hover Provider
- Completion Provider
- Signature Help Provider
- Document Highlight Provider
- Code Action Provider
- Code Lens Provider
- Execute Command Provider
Note: The Language Server Protocol is offered as a technology preview and requires to pass the --experimental-options option for its activation.
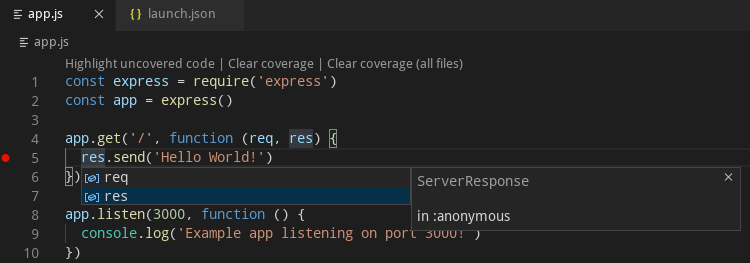
To start the Language Server Protocol, pass the --lsp option to the command-line launcher as in the following example with a Node.js application:
node --experimental-options --lsp app.js
[Graal LSP] Starting server and listening on localhost/127.0.0.1:8123
Example app listening on port 3000!
Note: GraalVM’s Language Server Protocol itself does not provide the static data usually gathered by parsing the application sources (as these data are sometimes fuzzy in the case of dynamic languages). Instead, it was designed to provide the accurate dynamic data gathered from the application runtime.
However, GraalVM’s Language Server Protocol could delegate to the existing language servers written specially for the particular languages (using the --lsp.Delegates launcher option) and merge the static data returned from these servers with its own dynamic data to a single result.
This extension works as a client to the Language Server Protocol. By default, a language server is started as a part of every process being executed or debugged via the VS Code user interface. The other possibility (available on option) is a language server started as a separated process that gets informed about every application being executed or debugged. It tries to “dry-run” the same code as the original application and serve the run-time data afterwards. Currently, both approaches start the language server, providing the smart editing features for the following GraalVM-supported languages - JavaScript, Python, R, Ruby, and SimpleLanguage.
R Language Server
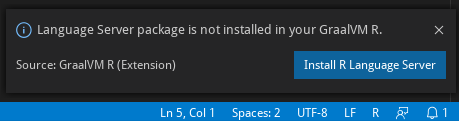
This extension provides an option to automatically install and run the languageserver which is an implementation of the Language Server Protocol for the R language.
Enabling this option, the GraalVM R installation is checked for the presence of the languageserver package and the user is provided with the option of an automatic installation of the missing package.
Once the languageserver package is installed, the R Language Server is automatically started and passed to the Language Server Protocol as delegate when necessary.
Ruby Language Server
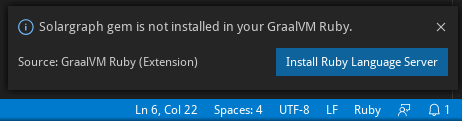
This extension provides an option to automatically install and run the solargraph which is an implementation of the Language Server Protocol for the Ruby language.
Enabling this option, the GraalVM Ruby installation is checked for the presence of the solargraph gem and the user is provided with the option of an automatic installation of the missing gem.
Once the solargraph gem is installed, the Ruby Language Server is automatically started and passed to the Language Server Protocol as delegate when necessary.
Additional Editor Features
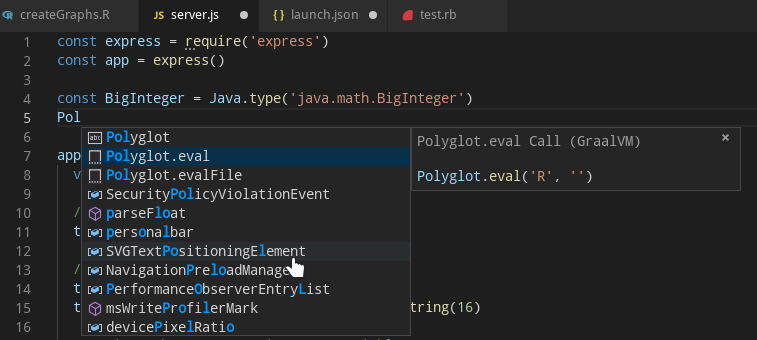
Since the easy writing of polyglot applications is one of the defining features of GraalVM, the code completion invoked inside JavaScript sources provides items for Polyglot.eval(...), Polyglot.evalFile(...), and Java.type(...) calls.
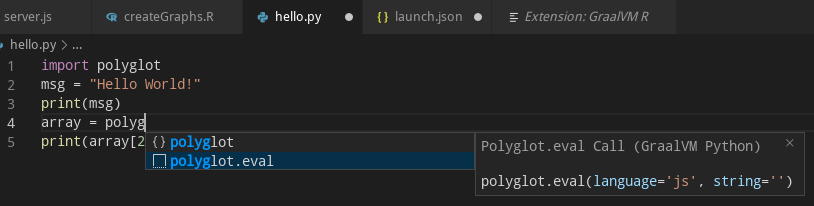
Similarly, the code completion invoked inside Python sources provides items for Polyglot.eval(...), Polyglot.eval_file(...), and Java.type(...) calls.
The code completion invoked inside R sources provides items for eval.polyglot(...) and new("<Java type>", ...) calls.

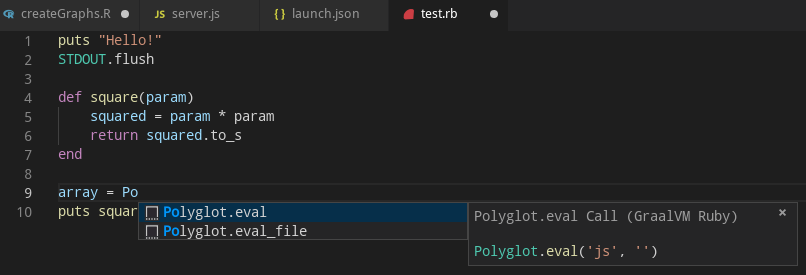
And finally, the code completion invoked inside Ruby sources provides items for Polyglot.eval(...), Polyglot.eval_file(...), and Java.type(...) calls.
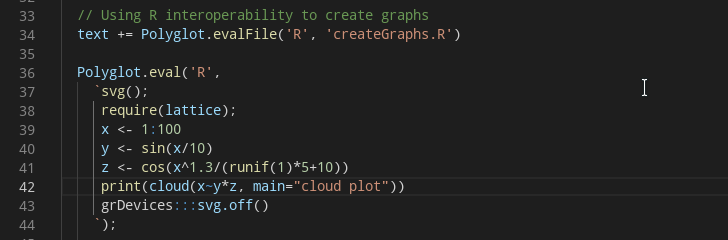
For JavaScript, Python, R, and Ruby sources opened in the editor, all the Polyglot.eval(...) calls are detected and the respective embedded languages are injected to their locations.
For example, having an R code snippet called via the Polyglot API from inside a JavaScript source, the R language code is embedded inside the corresponding JavaScript String and all VS Code’s editing features (syntax highlighting, bracket matching, auto closing pairs, code completion, etc.) treat the content of the String as the R source code.
Extension Settings
This extension contributes the following settings:
- graalvm.home - the path to the GraalVM installation
- graalvm.installations - all registered GraalVM installations
- graalvm.systemDetect - detect GraalVM’s installation from the system environment variables
- graalvm.languageServer.currentWorkDir - an absolute path to the working directory of GraalVM’s Language Server Protocol
- graalvm.languageServer.inProcessServer - start GraalVM’s Language Server Protocol within processes being run or debugged
- graalvm.languageServer.delegateServers - a comma-separated list of
language@[host:]portwhere other language servers run - graalvm.languageServer.startRLanguageServer - start the R Language Server
- graalvm.languageServer.startRubyLanguageServer - start the Ruby Language Server
Recommendations
The GraalVM Extension for VS Code recommends the following extensions:
- Python - the Python language support
- R - a basic support for the R language
- Ruby - the Ruby language support
- Apache NetBeans Language Server - the Java 8+ language support
Feedback
Privacy Policy
Read the Oracle Privacy Policy to learn more.