7 Troubleshooting Provisioning Gateway
- Execute the following command to verify the working condition of
Provisioning Gateway specific pods:
kubectl get pods -n
                            <provw-namespace>
A sampe output screen is shown below:Figure 7-1 Provisioning Gateway Pod Status
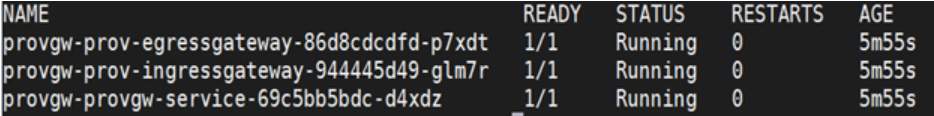
Note:
All the pods in the above screen are running. If not, refer to sections below on possible reasons for pod creation failure.
Checking PROVGW-SERVICE Logs
The PROVGW-SERVICE has all the response status from both the UDRs. You can check its logs to view the response from both the UDR’s. Execute the following command to view the logs:
kubectl logs <provgw-service pod> -n
                    <provgw-namespace>
Alternatively, you can check the logs directly on the pods using the following command:
kubectl exec –it <provgw-service pod> -n
                    <provgw-namespace> bash
Figure 7-2 PROVGW-SERVICE Logs

You can check the logs in the application.log file.
Changing PROVGW-SERVICE Logging Level
Note:
You need to redeploy the setup for the changes to take effect.- Open the latest provgw_value.yaml file used during Provisioning Gateway installation.
- Under provgw-service, change the value of "logging level root"
attribute to
"INFO"/"DEBUG".
Extract from provgw_values.yaml

provgw-service:
...
...
...
    logging:
        level:
          root:"WARN"
Other logging level values are DEBUG, INFO, WARN, ERROR.
Debugging Pod Creation Failure
- Incorrect Pod Image: You need to check if any pod is in
the ImagePullBackOff state. If it is there, it means that the image
name used for one of the pods is not correct. You need to check the
following values in the values.yaml
file.
provgw-service:

       ...

         image:

              name: reg-1:5000/provgw/provgateway

              tag: 1.8.0

      prov-ingressgateway:

       ...

         image:

              name: reg-1:5000/provgw/ocingress_gateway

              tag: 1.8.0

      prov-egressgateway:

       ...

         image:

              name: reg-1:5000/provgw/ocegress_gateway

              tag: 1.8.0
After updating the values.yaml file, execute the following command to install helm:
helm install –-name
                                <release-name> --namespace
                            <release-namespace>
It helps you to purge the old setup and reinstall for the changes or upgrade the helm instance.
- Resource Allocation Failure: You need to check if any pod
is in the Pending state. If yes, then execute the following command for
those pods:
kubectl describe <provgw-service pod
                                id> --n <provgw-namespace>
In the output, check whether there is any warning for Insufficient CPU. If any warning is found, it means there are not sufficient CPU resources to start the pod.
You can address this issue by either increasing the number of CPUs as a hardware or reducing the number of CPUs allotted to a pod in the values.yaml file.provgw-service: . . . . . . . . . resources: limits: cpu: 3 memory: 4Gi requests: cpu: 3 memory: 4Gi prov-ingressgateway: ... ... ... resources: limits: cpu: 3 memory: 4Gi requests: cpu: 3 memory: 4GiAfter updating the values.yaml file, execute the following command to install helm:
helm install –-name
                                <release-name> --namespace
                            <release-namespace>
Debugging UDR Registration with ProvGw
Before deploying Provisioning Gateway, you need to ensure that UDR pods are in running state and the FQDN of UDRs are correct.
Figure 7-3 UDR FQDN Info

Initially, Provisioning Gateway registers with the preferred FQDN in each segment irrespective of its active state and later, it internally verifies the status of other FQDNs in each segment and updates, if the preferred FQDN is down.
Before deploying Provisioning Gateway, you need to ensure that:- All the pods of UDR are in running state.
- FQDN of the UDR is correctly mentioned.
- The preferred FQDN is considered as active when all the FQDN’s are down in one segment.
- The active FQDN is checked every 15 seconds (This value is configurable).
- The get requests sent to UDR for updating the active FQDN, are not dumped in the logs of ProvGw.
- There is only one
provgw-servicethat receives all the requests from Ingress Gateway. If any request fails:- With 500 status code without Problem Details information: It means the flow ended in prov-ingressgateway service pod without route. To confirm the same, you need to check the prov-ingressgateway pod logs for errors/exception.
- With 503 status code with SERVICE_UNAVAILABLE in
Problem Details: It means the provgw-service pod is
not reachable due to some reason.
Figure 7-4 503 Status Code

You can confirm this error in the prov-ingressgateway pod logs for errors/exception. Check the provgw-service pod status and fix the issue.
- Try to find the root cause using metrics as follows:
- If the count of oc_ingressgateway_http_requests_total measurement increases, then check the content of incoming requests. You need to ensure that the incoming JSON data blob is as per specification.
- If the udr_rest_request measurement increases more than one per request then you need to ensure that UDR is working fine and the Ingress Gateways of UDR are not down.
- To debug HTTPS related issues, refer to Unified Data
Repository Installation and Upgrade Guide.
Figure 7-5 ProvGw - HTTPS Port Exposure

- To debug HPA Issues, refer to Unified Data Repository Installation and Upgrade Guide
Debugging Provisioning Gateway with Service Mesh Failures
- Istio-Proxy side car container not attached to Pod: This
particular failure arise when istio injection is not enabled on the NF
installed namespace. Execute the following command to verify the same:
kubectl get namespace -L
                            istio-injection
Figure 7-6 Verifying Istio-Proxy

To enable the istio injection, execute the following command:
kubectl label --overwrite namespace
                                <nf-namespace> istio-injection=enabled
Other possible reason for this error could be that the below highlighted annotation is missing from the deployment.Figure 7-7 Global Section - Istio-Proxy Info
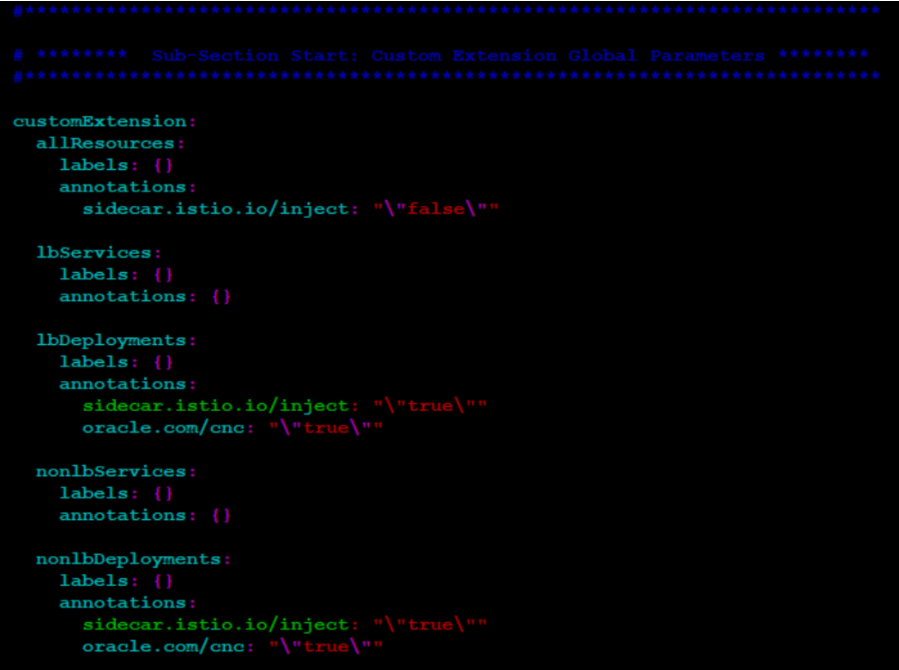
You need to add the highlighted annotation as shown above to the global section for lbDeployments and nonlbDeployments parameters.
- If the provisioning system outside service mesh is not able to contact
provgw service through its ingress gateway, then you have to:
- Exclude the HTTP container port traffic for prov-ingressgateway from istio side car.
- Configure proper port as shown below under prov-ingressgateway
section.
Figure 7-8 Annotation under prov-ingressgateway section

- If there are issues in viewing PROVGW metrics on OSO prometheus then you
have to add the annotation given below to all the deployments for the
NF.
Figure 7-9 Annotation to View ProvGw Metrics

Troubleshooting provgw-service via Metrics
If provgw-service requests fail, you can try to find the root cause from metrics as well. Some of the troubleshooting tips are as follows:
- If the count of oc_ingressgateway_http_requests_total measurement increases, you should check the content of incoming request and make sure that incoming json data blob is proper and as per the specification.
- If on one request, the udr_rest_request measurement increases
more than once then:
- Make sure the UDR's are working fine
- Make sure the ingress gateways of UDR are not down.