3 Understanding CNC NF Data Collector
You can run CNC NF Data Collector to generate the required tarballs and examine the log files present in the tarballs for debugging purposes. Using this data, you can determine an NF issue by accessing logs, metrics, traces, and alerts of the NF.
CNC NF Data Collector consists of the following modules:
- Network Function Deployment Data Collector
- Network Function Logs, Metrics, Traces, Alerts Data Collector
3.1 Network Function Deployment Data Collector
- Helm deployment status mapped to Namespace entered by users.
- Helm configuration used for deploying the NF mapped to Namespace entered by users.
- Status of all the Kubernetes resources used in the Helm deployment.
- Deployment description of all the Kubernetes resources, such as pods, deployments(deploy), services(svc), replicasets(rs), horizontalpodautoscaler(hpa), configmaps(cm), PodDisruptionBudeget(pdb), EndPoint(ep), used in the Helm deployment.
- Logs from all the pods in the Helm deployment.
- Kubernetes events.
- cnDBTier logs.
If the cnDBTier log collection is enabled through the
cndbTierLogCollectionparameter, it collects data from DBTIER_REPLICATION_CHANNEL_INFO, DBTIER_REPL_SITE_INFO, DBTIER_INITIAL_BINLOG_POSTION, REPLICATION_CONNECTION_STATUS, and NDB_BINLOG_INDEX tables. Also, it collects the following data:- Slave status, bin logs, relay, and MySQL logs from MySQL pods.
- Trace logs and cluster status from MySQL data pods.
- Cluster logs from MySQL management pods.
Note:
If the Helm release is unavailable, then Helm specific data is not collected. If multiple Helm releases are mapped to the same Kubernetes namespace, then Helm specific data is collected for all Helm releases mapped to entered namespace.
3.2 Network Function Logs, Metrics, Traces, Alerts Data Collector
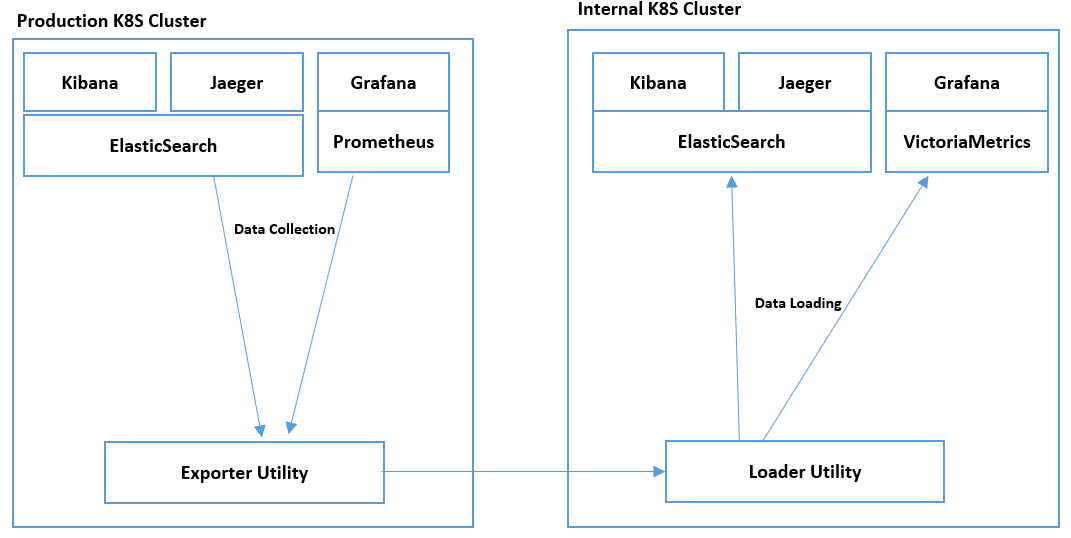
- Exporter utility
- Loader utility
Exporter Utility
Run this utility on the same system from which the data has to be
collected. Exporter utility uses Elastic Search and Prometheus Server to collect the
following data for a specified time interval provided in the
exporter-custom-values.yaml file:
- Logs
- Metrics
- Traces
- Alarms
Loader Utility
Run this utility on the same system to which the data needs to be loaded in plain files. Loader utility uses Elastic Search and Victoria Metrics to load the same data that was exported using the Exporter utility.
Note:
Victoria Metrics is a time series database similar to Prometheus. Victoria Metrics is used instead of Prometheus because Prometheus does not support push mechanism to store data into its time series database.The following image explains data collection and data loading by using Exporter and Loader utilities.
Figure 3-1 Data Collection and Data Loading
