3 Benchmarking Policy Call Models
This section describes different Policy call models and the performance test scenarios which were run using these call model.
3.1 PCRF Call Model 1
The following diagram describes the architecture for a multisite PCRF deployment.
Figure 3-1 PCRF 4 Site GR Deployment Architecture

To test this PCRF call model, the Policy application is deployed in converged mode on a four-site georedundant site. The cnDBTier database and PCRF application are replicated on all the four-sites. The database replication is used to perform data synchronization between databases over the replication channels.
3.1.1 Test Scenario 1: PCRF Data Call Model on Four-Site GeoRedundant setup, with 7.5K Transaction Per Second (TPS) on each site and ASM disabled
This test run benchmarks the performance and capacity of PCRF data call model that is deployed in converged mode on a four-site georedundant setup. Each site in the setup handles an incoming traffic of 7.5K TPS. Aspen Service Mesh (ASM) is disabled.
3.1.1.1 Test Case and Setup Details
Table 3-1 Test Case Parmeters
| Parameters | Values |
|---|---|
| Call Rate | 30K TPS (7.5K TPS on each site) |
| Execution Time | 12 Hours |
| ASM | Disable |
Table 3-2 Call Model Data
| Messages | Total CPS Instance-1 | sy Traffic | Ldap Traffic | Total TPS |
|---|---|---|---|---|
| CCR-I | 320 | 320 | 320 | 960 |
| CCR-U | 320 | 0 | 0 | 320 |
| CCR-T | 320 | 320 | 0 | 640 |
| Total Messages | 960 | 640 | 320 | 1920 |
Table 3-3 PCRF Configurations
| Service Name | Status |
|---|---|
| Binding Service | Disable |
| Policy Event Record (PER) | Disable |
| Subscriber Activity Log (SAL) | Enable |
| LDAP | Enable |
| Online Charging System (OCS) | Enable |
Table 3-4 PCF Interfaces
| Feature Name | Status |
|---|---|
| N36 UDR query (N7/N15-Nudr) | Disable |
| N36 UDR subscription (N7/N15-Nudr) | Disable |
| UDR on-demand nrf discovery | Disable |
| CHF (SM-Nchf) | Disable |
| BSF (N7-Nbsf) | Disable |
| AMF on demand nrf discovery | Disable |
| LDAP (Gx-LDAP) | Enable |
| Sy (PCF N7-Sy) | Enable |
Table 3-5 PCRF Interfaces
| Feature Name | Status |
|---|---|
| Sy (PCRF Gx-Sy) | Enable |
| Sd (Gx-Sd) | Disable |
| Gx UDR query (Gx-Nudr) | Disable |
| Gx UDR subscription (Gx-Nudr | Disable |
| CHF enabled (AM) | Disable |
| Usage Monitoring (Gx) | Disable |
| Subscriber HTTP Notifier (Gx) | Disable |
Table 3-6 Configuring cnDBTier Helm Parameters
| Helm Parameter | New Value |
|---|---|
| ndb_batch_size | 2G |
| TimeBetweenEpochs | 100 |
| NoOfFragmentLogFiles | 50 |
| FragmentLogFileSize | 256M |
| RedoBuffer | 1024M |
| ndbappmysqld Pods Memory | 19/20 Gi |
| ndbmtd pods CPU | 8/8 |
| ndb_report_thresh_binlog_epoch_slip | 50 |
| ndb_eventbuffer_max_alloc | 19G |
| ndb_log_update_minimal | 1 |
| ndbmysqld Pods Memory | 25/25 Gi |
| replicationskiperrors | enable: true |
| replica_skip_errors | '1007,1008,1050,1051,1022' |
| numOfEmptyApiSlots | 4 |
Table 3-7 Policy Microservices Resource
| Service Name | CPU Request Per Pod | CPU Limit Per Pod | Memory Request Per Pod (Gi) | Memory Limit Per Pod (Gi) | Replica |
|---|---|---|---|---|---|
| ocpcf-appinfo | 1 | 1 | 0.5 | 1 | 1 |
| ocpcf-oc-binding | 5 | 6 | 1 | 8 | 15 |
| ocpcf-oc-diam-connector | 3 | 4 | 1 | 2 | 8 |
| ocpcf-oc-diam-gateway | 3 | 4 | 1 | 2 | 7 |
| ocpcf-occnp-config-server | 2 | 4 | 0.5 | 2 | 1 |
| ocpcf-occnp-egress-gateway | 3 | 4 | 4 | 6 | 2 |
| ocpcf-ocpm-ldap-gateway | 3 | 4 | 1 | 2 | 10 |
| ocpcf-occnp-ingress-gateway | 3 | 4 | 4 | 6 | 2 |
| ocpcf-occnp-nrf-client-nfdiscovery | 3 | 4 | 0.5 | 2 | 2 |
| ocpcf-occnp-nrf-client-nfmanagement | 1 | 1 | 1 | 1 | 2 |
| ocpcf-ocpm-audit-service | 1 | 2 | 1 | 1 | 1 |
| ocpcf-ocpm-cm-service | 2 | 4 | 0.5 | 2 | 1 |
| ocpcf-ocpm-policyds | 5 | 6 | 1 | 4 | 25 |
| ocpcf-ocpm-pre | 5 | 5 | 0.5 | 4 | 25 |
| ocpcf-ocpm-queryservice | 1 | 2 | 1 | 1 | 1 |
| ocpcf-pcf-smservice | 7 | 8 | 1 | 4 | 2 |
| ocpcf-pcrf-core | 7 | 8 | 8 | 8 | 30 |
| ocpcf-performance | 1 | 1 | 0.5 | 1 | 2 |
Note:
Min Replica = Max ReplicaTable 3-8 cnDBTier Services Resources:
| Service Name | CPU Request Per Pod | CPU Limit Per Pod | Memory Request Per Pod (Gi) | Memory Limit Per Pod (Gi) | Replica |
|---|---|---|---|---|---|
| ndbappmysqld | 8 | 8 | 19 | 20 | 5 |
| ndbmgmd | 2 | 2 | 9 | 11 | 2 |
| ndbmtd | 8 | 8 | 73 | 83 | 8 |
| ndbmysqld | 4 | 4 | 19 | 20 | 12 |
Note:
Min Replica = Max Replica3.1.1.2 CPU Utilization
This section lists the CPU utilization for Policy and cnDBTier microservices. The CPU utilization is the ratio between the (total CPU utilization against total CPU request (X)) versus (target CPU Utilization (Y) configured for the Pod).
Table 3-9 Policy Microservices Resource Utilization
| Service | CPU (X/Y) - Site 1 | CPU (X/Y)- Site 2 | CPU(X/Y) - Site 3 | CPU(X/Y) - Site 4 |
|---|---|---|---|---|
| ocpcf-alternate-route | 0%/80% | 0%/80% | 0%/80% | 0%/80% |
| ocpcf-appinfo | 1%/80% | 2%/80% | 2%/80% | 3%/80% |
| ocpcf-occnp-config-server | 10%/80% | 11%/80% | 12%/80% | 12%/80% |
| ocpcf-oc-diam-connector | 10%/40% | 11%/40% | 10%/40% | 10%/40% |
| ocpcf-occnp-egress-gateway | 0%/80% | 0%/80% | 0%/80% | 0%/80% |
| ocpcf-occnp-ingress-gateway | 0%/80% | 0%/80% | 0%/80% | 0%/80% |
| ocpcf-ocpm-ldap-gateway | 4%/60% | 4%/60% | 5%/60% | 4%/60% |
| ocpcf-occnp-nrf-client-nfdiscovery | 0%/80% | 0%/80% | 0%/80% | 0%/80% |
| ocpcf-occnp-nrf-client-nfmanagement | 0%/80% | 0%/80% | 0%/80% | 0%/80% |
| ocpcf-oc-binding | 0%/60% | 0%/60% | 0%/60% | 0%/60% |
| ocpcf-occnp-chf-connector | 0%/50% | 0%/50% | 0%/50% | 0%/50% |
| ocpcf-occnp-udr-connector | 0%/50% | 0%/50% | 0%/50% | 0%/50% |
| ocpcf-ocpm-audit-service | 0%/60% | 0%/60% | 0%/60% | 0%/60% |
| ocpcf-ocpm-policyds | 11%/60% | 11%/60% | 11%/60% | 11%/60% |
| ocpcf-ocpm-soapconnector | 0%/60% | 0%/60% | 0%/60% | 0%/60% |
| ocpcf-ocpm-pre | 13%/80% | 13%/80% | 13%/80% | 13%/80% |
| ocpcf-pcf-smservice | 0%/50% | 0%/50% | 0%/50% | 0%/50% |
| ocpcf-pcrf-core | 7%/40% | 7%/40% | 7%/40% | 7%/40% |
| ocpcf-ocpm-queryservice | 0%/80% | 0%/80% | 0%/80% | 0%/80% |
Table 3-10 cnDBTier Services Resource Utilization
| Name | CPU (X/Y) - Site 1 | CPU (X/Y) - Site 2 | CPU (X/Y) - Site 3 | CPU (X/Y) - Site 4 |
|---|---|---|---|---|
| ndbappmysqld | 35%/80% | 36%/80% | 35%/80% | 35%/80% |
| ndbmgmd | 1%/80% | 1%/80% | 0%/80% | 0%/80% |
| ndbmtd | 15%/80% | 15%/80% | 18%/80% | 17%/80% |
| ndbmysqld | 5%/80% | 5%/80% | 5%/80% | 5%/80% |
3.1.1.3 Results
Table 3-11 Result and Observations
| Parameter | Values |
|---|---|
| Test Duration | 12 Hours |
| TPS Achieved | 30K TPS (7.5KTPS on each site) |
It was observed that on a four-site GR setup, handling an incoming traffic of 7.5K TPS on each site, the call model was working successfully without any replication delay and traffic drop.
3.1.2 Test Scenario 2: PCRF Voice Call Model on Two-Sites of Four-Site GeoRedundant setup, with 15K Transaction Per Second (TPS) on each site and ASM disabled
This test run benchmarks the performance and capacity of PCRF voice call model that is deployed in converged mode on a two-site of a four-site georedundant setup. Each site in the setup handles an incoming traffic of 15K TPS, and with Aspen Service Mesh (ASM) disabled.
3.1.2.1 Test Case and Setup Details
Table 3-12 Test Case Parmeters
| Parameters | Values |
|---|---|
| Call Rate | 30K TPS (15K TPS on each site) |
| Execution Time | 10 Hours |
| ASM | Disable |
Table 3-13 Call Model Data
| Command | Messages per call |
|---|---|
| CCRI (Single APN) | 9.08% |
| CCRU (Single APN) | 18.18% |
| CCRT (Single APN) | 9.09 % |
| Gx RAR | 18.18% |
| AARI | 9.09 % |
| AARU | 9.09 % |
| Rx RAR | 18.18% |
| STR | 9.09% |
Table 3-14 PCRF Configurations
| Service Name | Status |
|---|---|
| Binding Service | Enable |
| Policy Event Record (PER) | Disable |
| Subscriber Activity Logging (SAL) | Enable |
| LDAP | Disable |
| Online Charging System (OCS) | Disable |
Table 3-15 PCF Interfaces
| Feature Name | Status |
|---|---|
| N36 UDR query (N7/N15-Nudr) | Disable |
| N36 UDR subscription (N7/N15-Nudr) | Disable |
| UDR on-demand nrf discovery | Disable |
| CHF (SM-Nchf) | Disable |
| BSF (N7-Nbsf) | Disable |
| AMF on demand nrf discovery | Disable |
| LDAP (Gx-LDAP) | Disable |
| Sy (PCF N7-Sy) | Disable |
Table 3-16 PCRF Interfaces
| Feature Name | Status |
|---|---|
| Sy (PCRF Gx-Sy) | Disable |
| Sd (Gx-Sd) | Disable |
| Gx UDR query (Gx-Nudr) | Disable |
| Gx UDR subscription (Gx-Nudr | Disable |
| CHF enabled (AM) | Disable |
| Usage Monitoring (Gx) | Disable |
| Subscriber HTTP Notifier (Gx) | Disable |
Table 3-17 Configuring cnDBTier Helm Parameters
| Helm Parameter | Value |
|---|---|
| ndb_batch_size | 2G |
| TimeBetweenEpochs | 100 |
| NoOfFragmentLogFiles | 50 |
| FragmentLogFileSize | 256M |
| RedoBuffer | 1024M |
| ndbappmysqld Pods Memory | 19/20 Gi |
| ndbmtd pods CPU | 8/8 |
| ndb_report_thresh_binlog_epoch_slip | 50 |
| ndb_eventbuffer_max_alloc | 19G |
| ndb_log_update_minimal | 1 |
| ndbmysqld Pods Memory | 25/25 Gi |
| replicationskiperrors | enable: true |
| replica_skip_errors | '1007,1008,1050,1051,1022' |
| numOfEmptyApiSlots | 4 |
Table 3-18 Policy Microservices Resource
| Service Name | CPU Request Per Pod | CPU Limit Per Pod | Memory Request Per Pod (Gi) | Memory Limit Per Pod (Gi) | Replica |
|---|---|---|---|---|---|
| ocpcf-appinfo | 1 | 1 | 0.5 | 1 | 1 |
| ocpcf-oc-binding | 5 | 6 | 1 | 8 | 18 |
| ocpcf-oc-diam-connector | 3 | 4 | 1 | 2 | 8 |
| ocpcf-oc-diam-gateway | 3 | 4 | 1 | 2 | 9 |
| ocpcf-occnp-config-server | 2 | 4 | 0.5 | 2 | 2 |
| ocpcf-occnp-egress-gateway | 3 | 4 | 4 | 6 | 1 |
| ocpcf-ocpm-ldap-gateway | 3 | 4 | 1 | 2 | 0 |
| ocpcf-occnp-ingress-gateway | 3 | 4 | 4 | 6 | 2 |
| ocpcf-occnp-nrf-client-nfdiscovery | 3 | 4 | 0.5. | 2 | 1 |
| ocpcf-occnp-nrf-client-nfmanagement | 1 | 1 | 1 | 1 | 1 |
| ocpcf-ocpm-audit-service | 1 | 2 | 1 | 1 | 1 |
| ocpcf-ocpm-cm-service | 2 | 4 | 0.5 | 2 | 1 |
| ocpcf-ocpm-policyds | 5 | 6 | 1 | 4 | 2 |
| ocpcf-ocpm-pre | 5 | 5 | 0.5 | 4 | 15 |
| ocpcf-ocpm-queryservice | 1 | 2 | 1 | 1 | 1 |
| ocpcf-pcf-smservice | 7 | 8 | 1 | 4 | 2 |
| ocpcf-pcrf-core | 7 | 8 | 8 | 8 | 24 |
| ocpcf-performance | 1 | 1 | 0.5 | 1 | 2 |
Note:
Min Replica = Max ReplicaTable 3-19 cnDBTier Microservices Resources:
| Service Name | CPU Request Per Pod | CPU Limit Per Pod | Memory Request Per Pod (Gi) | Memory Limit Per Pod (Gi) | Replica |
|---|---|---|---|---|---|
| ndbappmysqld | 8 | 8 | 19 | 20 | 5 |
| ndbmgmd | 2 | 2 | 9 | 11 | 3 |
| ndbmtd | 8 | 8 | 73 | 83 | 8 |
| ndbmysqld | 4 | 4 | 19 | 20 | 6 |
Note:
Min Replica = Max Replica3.1.2.2 CPU Utilization
This section lists the CPU utilization for Policy and cnDBTier microservices. The CPU utilization is the ratio between the (total CPU utilization against total CPU request (X)) versus (target CPU Utilization (Y) configured for the pod).
Table 3-20 Policy Microservices Resource Utilization
| Service | CPU (X/Y) - Site 1 | CPU (X/Y) - Site 2 |
|---|---|---|
| ocpcf-appinfo | 2%/80% | 1%/80% |
| ocpcf-occnp-config-server | 8%/80% | 8%/80% |
| ocpcf-oc-diam-connector | 0%/40% | 0%/40% |
| ocpcf-occnp-egress-gateway | 0%/80% | 0%/80% |
| ocpcf-occnp-ingress-gateway | 0%/80% | 1%/80% |
| ocpcf-occnp-nrf-client-nfdiscovery | 0%/80% | 0%/80% |
| ocpcf-occnp-nrf-client-nfmanagement | 0%/80% | 0%/80% |
| ocpcf-oc-binding | 12%/60% | 0%/60% |
| ocpcf-ocpm-audit-service | 0%/60% | 0%/60% |
| ocpcf-ocpm-policyds | 0%/60% | 0%/60% |
| ocpcf-ocpm-pre | 13%/80% | 0%/80% |
| ocpcf-pcf-smservice | 0%/50% | 0%/50% |
| ocpcf-pcrf-core | 25%/40% | 0%/40% |
| ocpcf-ocpm-queryservice | 0%/80% | 0%/80% |
Table 3-21 cnDBTier Services Resource Utilization
| Name | CPU (X/Y) - Site 1 | CPU (X/Y) - Site 2 |
|---|---|---|
| ndbappmysqld | 75%/80% | 76%/80% |
| ndbmgmd | 0%/80% | 0%/80% |
| ndbmtd | 19%/80% | 6%/80% |
| ndbmysqld | 8%/80% | 3%/80% |
3.1.3 Test Scenario: PCRF Data Call Model on Two-Site GeoRedundant setup, with each site handling 11.5K TPS and ASM disabled
This test run benchmarks the performance and capacity of PCRF data call model that is deployed in converged mode on a two-site georedundant setup. Each site in the setup handles an incoming traffic of 11.5K Transaction Per Second (TPS). Aspen Service Mesh (ASM) is disabled.
The cnDBTier database and PCRF application is replicated on both the sites using Multi-channel replication. The database replication is used to perform data synchronization between databases over the replication channels.
3.1.3.1 Test Case and Setup Details
Table 3-22 Test Case Parmeters
| Parameters | Values |
|---|---|
| Call Rate | 23K TPS (11.5K TPS on each site) |
| Execution Time | 60 Hours |
| ASM | Disable |
Table 3-23 Call Model Data
| Messages | Total TPS |
|---|---|
| CCR-I | 2320 |
| CCR-U | 1220 |
| CCR-T | 2320 |
| SNR | 450 |
| RAR | 450 |
| Sy | 2440 |
| LDAP | 2320 |
| Total Messages | 11520 |
Table 3-24 PCRF Configurations
| Service Name | Status |
|---|---|
| Binding Service | Enable |
| Policy Event Record (PER) | Disable |
| Subscriber Activity Log (SAL) | Enable |
| LDAP | Enable |
| Online Charging System (OCS) | Enable |
| PDS and Binding Compression | Enable |
| Audit Service | Enable |
| Replication | Enable |
| Bulwark Service | Disable |
| Alternate Route Service | Disable |
Table 3-25 PCF Interfaces
| Feature Name | Status |
|---|---|
| N36 UDR query (N7/N15-Nudr) | Disable |
| N36 UDR subscription (N7/N15-Nudr) | Disable |
| UDR on-demand nrf discovery | Disable |
| CHF (SM-Nchf) | Disable |
| BSF (N7-Nbsf) | Disable |
| AMF on demand nrf discovery | Disable |
| LDAP (Gx-LDAP) | Enable |
| Sy (PCF N7-Sy) | Enable |
Table 3-26 PCRF Interfaces
| Feature Name | Status |
|---|---|
| Sy (PCRF Gx-Sy) | Enable |
| Sd (Gx-Sd) | Disable |
| Gx UDR query (Gx-Nudr) | Disable |
| Gx UDR subscription (Gx-Nudr | Disable |
| CHF enabled (AM) | Disable |
| Usage Monitoring (Gx) | Disable |
| Subscriber HTTP Notifier (Gx) | Disable |
Table 3-27 Configuring cnDBTier Helm Parameters
| Helm Parameter | New Value |
|---|---|
| ndb_batch_size | 2G |
| TimeBetweenEpochs | 100 |
| NoOfFragmentLogFiles | 50 |
| FragmentLogFileSize | 256M |
| RedoBuffer | 1024M |
| ndbappmysqld Pods Memory | 19/20 Gi |
| ndbmtd pods CPU | 8/8 |
| ndb_report_thresh_binlog_epoch_slip | 50 |
| ndb_eventbuffer_max_alloc | 19G |
| ndb_log_update_minimal | 1 |
| ndbmysqld Pods Memory | 25/25 Gi |
| replicationskiperrors | enable: true |
| replica_skip_errors | '1007,1008,1050,1051,1022' |
| numOfEmptyApiSlots | 4 |
Table 3-28 Policy Microservices Resource
| Name | CPU Request Per Pod | CPU Limit Per Pod | Memory Request Per Pod (Gi) | Memory Limit Per Pod (Gi) | Replica |
|---|---|---|---|---|---|
| Appinfo Service | 1 | 1 | 0.5 | 1 | 1 |
| Binding Service | 5 | 6 | 1 | 8 | 15 |
| Diameter Connector Service | 3 | 4 | 1 | 2 | 8 |
| Diameter Gateway Service | 3 | 4 | 2 | 2 | 7 |
| Config Server | 2 | 4 | 0.5 | 2 | 2 |
| Egress Gateway Service | 3 | 4 | 4 | 6 | 1 |
| LDAP Gateway Service | 3 | 4 | 1 | 2 | 10 |
| Ingress Gateway | 3 | 4 | 4 | 6 | 1 |
| Nrf-client-Nfdiscovery Service | 3 | 4 | 0.5 | 2 | 1 |
| Nrf-client-Nfmanagement Service | 1 | 1 | 1 | 1 | 1 |
| Audit Service | 1 | 2 | 1 | 1 | 1 |
| CM Service | 2 | 4 | 0.5 | 2 | 2 |
| PolicyDS Service | 5 | 6 | 1 | 2 | 25 |
| PRE Service | 5 | 5 | 2 | 4 | 25 |
| Query Service | 1 | 2 | 1 | 1 | 1 |
| PCRF Core Service | 7 | 8 | 8 | 8 | 30 |
| Performance | 1 | 1 | 0.5 | 1 | 2 |
Note:
Min Replica = Max ReplicaTable 3-29 cnDBTier Services Resources:
| Service Name | CPU Request Per Pod | CPU Limit Per Pod | Memory Request Per Pod (Gi) | Memory Limit Per Pod (Gi) | Replica |
|---|---|---|---|---|---|
| ndbappmysqld | 8 | 8 | 19 | 20 | 5 |
| ndbmgmd | 2 | 2 | 9 | 11 | 2 |
| ndbmtd | 10 | 10 | 73 | 83 | 8 |
| ndbmysqld | 8 | 8 | 25 | 25 | 4 |
Note:
Min Replica = Max Replica3.1.3.2 CPU Utilization
This section lists the CPU utilization for Policy and cnDBTier microservices. The CPU utilization is the ratio between the (total CPU utilization against total CPU request (X)) versus (target CPU Utilization (Y) configured for the Pod).
Table 3-30 Policy Microservices Resource Utilization
| Service | CPU (X/Y) - Site1 | CPU (X/Y)- Site2 |
|---|---|---|
| ocpcf-appinfo | 3%/80% | 3%/80% |
| ocpcf-occnp-config-server | 10%/80% | 15%/80% |
| ocpcf-oc-diam-connector | 23%/40% | 17%/40% |
| ocpcf-occnp-egress-gateway | 0%/80% | 0%/80% |
| ocpcf-occnp-ingress-gateway | 1%/80% | 1%/80% |
| ocpcf-ocpm-ldap-gateway | 10%/60% | 8%/60% |
| ocpcf-occnp-nrf-client-nfdiscovery | 0%/80% | 0%/80% |
| ocpcf-occnp-nrf-client-nfmanagement | 0%/80% | 0%/80% |
| ocpcf-oc-binding | 16%/60% | 13%/60% |
| ocpcf-ocpm-audit-service | 0%/60% | 0%/60% |
| ocpcf-ocpm-policyds | 25%/60% | 25%/60% |
| ocpcf-ocpm-pre | 15%/80% | 15%/80% |
| ocpcf-pcrf-core | 19%/40% | 18%/40% |
| ocpcf-ocpm-queryservice | 0%/80% | 0%/80% |
Observed CPU utilization Values of cnDBTier Services
The following table provides information about observed values of cnDBTier services.
Table 3-31 cnDBTier Microservices Resource Utilization
| Service | CPU (X/Y)- Site1 | CPU (X/Y)- Site2 |
|---|---|---|
| ndbappmysqld | 51%/80% | 51%/80% |
| ndbmgmd | 0%/80% | 0%/80% |
| ndbmtd | 23%/80% | 23%/80% |
| ndbmysqld | 5%/80% | 4%/80% |
3.1.4 Test Scenario: PCRF Voice Call Model on Two-Site GeoRedundant setup, with 15K TPS on each site and ASM disabled
This test run benchmarks the performance and capacity of PCRF voice call model that is deployed in converged mode on a two-site georedundant setup. Each site in the setup handles an incoming traffic of 15K TPS. Aspen Service Mesh (ASM) is disabled.
The cnDBTier database and PCRF application is replicated on both the sites using Single-channel replication. The database replication is used to perform data synchronization between databases over the replication channels.
3.1.4.1 Test Case and Setup Details
Table 3-33 Test Case Parmeters
| Parameters | Values |
|---|---|
| Call Rate | 30K TPS (15K TPS on each site) |
| Execution Time | 110 Hours |
| Traffic Ratio | CCRI-I, AARI –1, CCRU-2, AARU - 1, RAR-Gx-1, RAR-Rx-1, STR –1, CCRT-1 |
| ASM | Disable |
Table 3-34 PCRF Configurations
| Service Name | Status |
|---|---|
| Binding Service | Enable |
| Policy Event Record (PER) | Enable |
| Subscriber Activity Log (SAL) | Enable |
| LDAP | Disable |
| Online Charging System (OCS) | Disable |
| Audit Service | Enable |
| Replication | Enable |
| Bulwark Service | Disable |
| Alternate Route Service | Disable |
Table 3-35 PCF Interfaces
| Feature Name | Status |
|---|---|
| N36 UDR query (N7/N15-Nudr) | Disable |
| N36 UDR subscription (N7/N15-Nudr) | Disable |
| UDR on-demand nrf discovery | Disable |
| CHF (SM-Nchf) | Disable |
| BSF (N7-Nbsf) | Disable |
| AMF on demand nrf discovery | Disable |
| LDAP (Gx-LDAP) | Disable |
| Sy (PCF N7-Sy) | Enable |
Table 3-36 PCRF Interfaces
| Feature Name | Status |
|---|---|
| Sy (PCRF Gx-Sy) | Enable |
| Sd (Gx-Sd) | Disable |
| Gx UDR query (Gx-Nudr) | Disable |
| Gx UDR subscription (Gx-Nudr | Disable |
| CHF enabled (AM) | Disable |
| Usage Monitoring (Gx) | Disable |
| Subscriber HTTP Notifier (Gx) | Disable |
Table 3-37 Configuring cnDBTier Helm Parameters
| Helm Parameter | New Value |
|---|---|
| ndb_batch_size | 2G |
| TimeBetweenEpochs | 100 |
| NoOfFragmentLogFiles | 50 |
| FragmentLogFileSize | 256M |
| RedoBuffer | 1024M |
| ndbappmysqld Pods Memory | 19/20 Gi |
| ndbmtd pods CPU | 8/8 |
| ndb_report_thresh_binlog_epoch_slip | 50 |
| ndb_eventbuffer_max_alloc | 19G |
| ndb_log_update_minimal | 1 |
| ndbmysqld Pods Memory | 25/25 Gi |
| replicationskiperrors | enable: true |
| replica_skip_errors | '1007,1008,1050,1051,1022' |
| numOfEmptyApiSlots | 4 |
Table 3-38 Policy Microservices Resource
| Name | CPU Request Per Pod | CPU Limit Per Pod | Memory Request Per Pod (Gi) | Memory Limit Per Pod (Gi) | Replica |
|---|---|---|---|---|---|
| Appinfo Service | 1 | 1 | 0.5 | 1 | 1 |
| Binding Service | 5 | 6 | 1 | 8 | 18 |
| Diameter Connector Service | 3 | 4 | 1 | 2 | 5 |
| Diameter Gateway Service | 3 | 4 | 1 | 2 | 9 |
| Config Server | 2 | 4 | 0.5 | 2 | 2 |
| Egress Gateway Service | 3 | 4 | 4 | 6 | 1 |
| Ingress Gateway Service | 3 | 4 | 4 | 6 | 1 |
| Nrf-client-Nfdiscovery Service | 3 | 4 | 0.5 | 2 | 1 |
| Nrf-client-Nfmanagement Service | 1 | 1 | 1 | 1 | 1 |
| Audit Service | 1 | 2 | 1 | 1 | 1 |
| CM Service | 2 | 4 | 0.5 | 2 | 2 |
| PolicyDS Service | 5 | 6 | 1 | 4 | 5 |
| PRE Service | 3 | 8 | 0.5 | 4 | 15 |
| Query Service | 1 | 2 | 1 | 1 | 1 |
| PCRF Core Service | 7 | 8 | 8 | 8 | 24 |
| Performance | 1 | 1 | 0.5 | 1 | 2 |
Note:
Min Replica = Max ReplicaTable 3-39 cnDBTier Services Resources:
| Service Name | CPU Request Per Pod | CPU Limit Per Pod | Memory Request Per Pod (Gi) | Memory Limit Per Pod (Gi) | Replica |
|---|---|---|---|---|---|
| ndbappmysqld | 8 | 8 | 19 | 20 | 5 |
| ndbmgmd | 4 | 4 | 9 | 11 | 2 |
| ndbmtd | 10 | 10 | 73 | 83 | 8 |
| ndbmysqld | 10 | 10 | 25 | 25 | 2 |
Note:
Min Replica = Max Replica3.1.4.2 CPU Utilization
This section lists the CPU utilization for Policy and cnDBTier microservices. The CPU utilization is the ratio between the (total CPU utilization against total CPU request (X)) versus (target CPU Utilization (Y) configured for the Pod).
Table 3-40 Policy Microservices Resource Utilization
| Service | CPU (X/Y) - Site 1 | CPU (X/Y)- Site 2 |
|---|---|---|
| ocpcf-appinfo | 2%/80% | 1%/80% |
| ocpcf-occnp-config-server | 7%/80% | 6%/80% |
| ocpcf-oc-diam-connector | 0%/40% | 0%/40% |
| ocpcf-occnp-egress-gateway | 0%/80% | 0%/80% |
| ocpcf-occnp-ingress-gateway | 0%/80% | 0%/80% |
| ocpcf-occnp-nrf-client-nfdiscovery | 0%/80% | 0%/80% |
| ocpcf-occnp-nrf-client-nfmanagement | 0%/80% | 0%/80% |
| ocpcf-oc-binding | 0%/60% | 0%/60% |
| ocpcf-ocpm-audit-service | 0%/60% | 0%/60% |
| ocpcf-ocpm-policyds | 0%/60% | 0%/60% |
| ocpcf-ocpm-pre | 0%/80% | 0%/80% |
| ocpcf-pcrf-core | 0%/40% | 0%/40% |
| ocpcf-ocpm-queryservice | 0%/80% | 0%/80% |
Observed CPU utilization Values of cnDBTier Services
The following table provides information about observed values of cnDBTier services.
Table 3-41 cnDBTier Microservices Resource Utilization
| Service | CPU (X/Y)- Site1 | CPU (X/Y)- Site2 |
|---|---|---|
| ndbappmysqld | 78%/80% | 78%/80% |
| ndbmgmd | 0%/80% | 0%/80% |
| ndbmtd | 1%/80% | 1%/80% |
| ndbmysqld | 0%/80% | 0%/80% |
3.2 PCF Call Model 2
3.2.1 Test Scenario: PCF Call Model on Two-Site GeoRedundant setup, with 15K TPS each for AM/UE and ASM enabled.
This test run benchmarks the performance and capacity of Policy data call model that is deployed in PCF mode. The PCF application handles an incoming traffic of 30K TPS, with 15K TPS each for AM and UE services. For this setup Aspen Service Mesh (ASM) was enabled.
3.2.1.1 Test Case and Setup Details
Table 3-43 Test Case Parmeters
| Parameters | Values |
|---|---|
| Call Rate | 30K TPS on Single site |
| Execution Time | 17 Hours |
| ASM | Enable |
| Traffic Ratio | 1:0:1 (AM/UE Create: AM/UE Update: AM/UE delete) |
| Active Subscribers | ~10000000 |
Table 3-44 Call Model
| Service Name | AM Service | UE Service | Total MPS | Total TPS | ||||
|---|---|---|---|---|---|---|---|---|
| Ingress | Egress | Total MPS | Ingress | Egress | Total MPS | |||
| Ingress | 3600 | 3600 | 7200 | 3600 | 3600 | 7200 | 14400 | 7200 |
| PRE | 3600 | 0 | 3600 | 3600 | 0 | 3600 | 7200 | 3600 |
| PDS | 9000 | 9000 | 18000 | 8100 | 6300 | 14400 | 34200 | 17100 |
| Egress | 9900 | 9900 | 19800 | 13500 | 13500 | 27000 | 46800 | 23,400 |
| Nrf Discovery | 1800 | 1800 | 3600 | 1800 | 1800 | 3600 | 7200 | 3600 |
| UDR Connector | 6300 | 8100 | 14400 | 6300 | 6300 | 12600 | 27000 | 13500 |
| CHF Connector | 3600 | 3600 | 7200 | 0 | 0 | 0 | 7200 | 3600 |
| AM | 3600 | 18900 | 22500 | 0 | 0 | 0 | 22500 | 11250 |
| UE | 0 | 0 | 0 | 3600 | 20700 | 24300 | 24300 | 12150 |
| Bulwark | 7200 | 0 | 7200 | 7200 | 0 | 7200 | 14400 | 7200 |
Table 3-45 PCF Configuration
| Service Name | Status |
|---|---|
| Bulwark Service | Enable |
| Binding Service | Disable |
| Subscriber State Variable (SSV) | Enable |
| Validate_user | Disable |
| Alternate Route Service | Disable |
| Audit Service | Enable |
| Binlog | Enable |
Table 3-46 PCF Interfaces
| Feature Name | Status |
|---|---|
| N36 UDR query (N7/N15-Nudr) | Enable |
| N36 UDR subscription (N7/N15-Nudr) | Enable |
| UDR on-demand nrf discovery | Disable |
| CHF (SM-Nchf) | Disable |
| BSF (N7-Nbsf) | Disable |
| AMF on demand nrf discovery | Disable |
| LDAP (Gx-LDAP) | Disable |
| Sy (PCF N7-Sy) | Enable |
Table 3-47 PCRF Interfaces
| Feature Name | Status |
|---|---|
| Sy (PCRF Gx-Sy) | Disable |
| Sd (Gx-Sd) | Disable |
| Gx UDR query (Gx-Nudr) | Disable |
| Gx UDR subscription (Gx-Nudr | Disable |
| CHF enabled (AM) | Disable |
| Usage Monitoring (Gx) | Disable |
| Subscriber HTTP Notifier (Gx) | Disable |
Table 3-48 Configuring cnDBTier Helm Parameters
| Helm Parameter | Value |
|---|---|
| restartSQLNodesIfBinlogThreadStalled | true |
| binlog_cache_size | 65536 |
| ndbsqld node memory | 54Gi |
| NoOfFragmentLogFiles | 96 |
| ndb_allow_copying_alter_table | 1 |
Table 3-49 Policy Microservices Resources
| Service Name | CPU Request Per Pod | CPU Limit Per Pod | Memory Request Per Pod (Gi) | Memory Limit Per Pod (Gi) | Replica |
|---|---|---|---|---|---|
| Appinfo | 1 | 1 | 0.5 | 1 | 2 |
| Audit Service | 1 | 2 | 1 | 1 | 2 |
| CM Service | 2 | 4 | 0.5 | 2 | 2 |
| Config Service | 2 | 4 | 0.5 | 2 | 2 |
| Egress Gateway | 4 | 4 | 4 | 6 | 13 |
| Ingress Gateway | 4 | 4 | 4 | 6 | 4 |
| Nrf Client Management | 1 | 1 | 1 | 1 | 2 |
| Diameter Gateway | 4 | 4 | 1 | 2 | 0 |
| Diameter Connector | 4 | 4 | 1 | 2 | 0 |
| AM Service | 8 | 8 | 1 | 4 | 9 |
| UE Service | 8 | 8 | 1 | 4 | 11 |
| Nrf Client Discovery | 4 | 4 | 0.5 | 2 | 4 |
| Query Service | 1 | 2 | 1 | 1 | 2 |
| PCRF Core Service | 8 | 8 | 8 | 8 | 0 |
| Performance | 1 | 1 | 0.5 | 1 | 2 |
| PRE Service | 4 | 4 | 0.5 | 2 | 6 |
| SM Service | 8 | 8 | 1 | 4 | 0 |
| PDS | 6 | 6 | 1 | 4 | 17 |
| UDR Connector | 6 | 6 | 1 | 4 | 7 |
| CHF Connector | 6 | 6 | 1 | 4 | 2 |
| LDAP Gateway Service | 3 | 4 | 1 | 2 | 0 |
| Binding Service | 5 | 6 | 1 | 8 | 0 |
| SOAP Connector | 2 | 4 | 4 | 4 | 0 |
| Alternate Route Service | 2 | 2 | 2 | 4 | 4 |
| Bulwark Service | 8 | 8 | 1 | 4 | 3 |
Note:
Min Replica = Max ReplicaTable 3-50 cnDBTier Microservices Resources:
| Service Name | CPU Request Per Pod | CPU Limit Per Pod | Memory Request Per Pod (Gi) | Memory Limit Per Pod (Gi) | Replica |
|---|---|---|---|---|---|
| ndbappmysqld | 15 | 15 | 18 | 18 | 6 |
| ndbmgmd | 3 | 3 | 10 | 10 | 2 |
| ndbmtd | 12 | 12 | 96 | 96 | 12 |
| ndbmysqld | 4 | 4 | 54 | 54 | 2 |
Note:
Min Replica = Max Replica3.2.1.2 CPU Utilization
This section lists the CPU utilization for Policy and cnDBTier microservices. The CPU utilization is the ratio between the (total CPU utilization against total CPU request (X)) versus (target CPU Utilization (Y) configured for the pod).
Table 3-51 Policy Microservices Resource Utilization
| Service | CPU (X/Y) - Site1 |
|---|---|
| ocpcf-alternate-route | 0%/80% |
| ocpcf-appinfo | 0%/80% |
| ocpcf-bulwark | 0%/60% |
| ocpcf-occnp-config-server | 9%/80% |
| ocpcf-occnp-egress-gateway | 46%/80% |
| ocpcf-occnp-ingress-gateway | 38%/80% |
| ocpcf-occnp-nrf-client-nfdiscovery | 38%/80% |
| ocpcf-occnp-nrf-client-nfmanagement | 15%/80% |
| ocpcf-oc-binding | 0%/60% |
| ocpcf-occnp-chf-connector | 0%/50% |
| ocpcf-occnp-udr-connector | 46%/50% |
| ocpcf-ocpm-audit-service | 0%/60% |
| ocpcf-ocpm-policyds | 32%/60% |
| ocpcf-ocpm-pre | 18%/80% |
| ocpcf-pcf-amservice | 21%/30% |
| ocpcf-pcf-ueservice | 33%30% |
| ocpcf-ocpm-queryservice | 0%80% |
Table 3-52 cnDBTier Services Resource Utilization
| Name | CPU (X/Y) - Site1 |
|---|---|
| ndbappmysqld | 31%/80% |
| ndbmgmd | 0%/80% |
| ndbmtd | 43%/80% |
| ndbmysqld | 9%/80% |
3.2.1.3 Results
Table 3-53 Latency Observations
| NF | Procedure | NF Processing Time - (Average/50%) ms | NF Processing Time - (99%) ms |
|---|---|---|---|
| AM-PCF | AM-Create (simulator) | 56.2 | 47.6 |
| AM-Delete (simulator) | 50.2 | 44.6 | |
| UE-PCF | AM-Create (simulator) | 78.6 | 63.3 |
| AM-Delete (simulator) | 7.6 | 6.3 |
Table 3-54 Latency Observations for Policy Services:
| Services | Average Latency (ms) |
|---|---|
| Ingress | 45.6 |
| PDS | 26.9 |
| UDR | 7.60 |
| NrfClient Discovery - OnDemand | 6.39 |
| Egress | 0.914 |
- Able to achieve 30K TPS with AM (15K) and UE (15K) with constant approximate run of 17 Hours.
- Latency was constant through out the call model run, with
- approximate of 46ms for Ingress, and
- approximate of <=20ms for rest of the PCF services
3.2.2 Test Scenario: PCF AM/UE Call Model on Two-Site GeoRedundant setup, with each site handling 25K TPS traffic and ASM enabled
This test run benchmarks the performance and capacity of Policy AM/UE data call model that is deployed in PCF mode. The PCF application handles a total (Ingress + Egress) traffic of 50K TPS, with each site handling a traffic of 25K TPS. For this setup Aspen Service Mesh (ASM) was enabled.
In this test setup, the Georedundant (GR) mode was enabled in cnDBTier and it was configured for 3 channel replication.
3.2.2.1 Test Case and Setup Details
Table 3-55 Test Case Parmeters
| Parameters | Values |
|---|---|
| Call Rate (Ingress + Egress) | 50K TPS on Single site |
| Execution Time | 94 Hours |
| ASM | Enable |
| Traffic Ratio | 1:0:1 (AM/UE Create: AM/UE Update: AM/UE delete) |
| Active Subscribers | 12591141 |
Table 3-56 TPS Distribution
| TPS Distribution | Site1 | Site2 |
|---|---|---|
| AM Ingress | 6.12K | 0 |
| AM Egress | 18.88K | 0 |
| UE Ingress | 6.12K | 0 |
| UE Egress | 18.88K | 0 |
| Total TPS | 50K | 0 |
Table 3-57 Call Model
| Service Name | AM Service | UE Service | Total MPS | Total TPS | ||||
|---|---|---|---|---|---|---|---|---|
| Ingress | Egress | Total MPS | Ingress | Egress | Total MPS | |||
| Ingress | 6250 | 6250 | 12500 | 6250 | 6250 | 12500 | 25000 | 12500 |
| PRE | 6250 | 0 | 6250 | 6250 | 0 | 6250 | 12500 | 6250 |
| PDS | 9375 | 9375 | 18750 | 9375 | 9375 | 18750 | 37500 | 18750 |
| Egress | 12500 | 12500 | 25000 | 25000 | 25000 | 50000 | 75000 | 37500 |
| Nrf Discovery | 3125 | 3125 | 6250 | 6250 | 6250 | 12500 | 18750 | 9375 |
| UDR Connector | 9375 | 12500 | 21875 | 9375 | 12500 | 21875 | 43750 | 21875 |
| CHF Connector | 0 | 0 | 0 | 0 | 0 | 0 | 0 | 0 |
| AM | 6250 | 15625 | 21875 | 0 | 0 | 0 | 21875 | 10937.5 |
| UE | 0 | 0 | 0 | 6250 | 28125 | 34375 | 34375 | 17187.5 |
| Bulwark | 0 | 0 | 0 | 0 | 0 | 0 | 0 | 0 |
Table 3-58 PCF Configuration
| Service Name | Status |
|---|---|
| Bulwark Service | Disable |
| Binding Service | NA |
| Subscriber State Variable (SSV) | Enable |
| Validate_user | Disable |
| Alternate Route Service | Disable |
| Audit Service | Enable |
| Binlog | Enable |
Table 3-59 PCF Interfaces
| Feature Name | Status |
|---|---|
| N36 UDR query (N7/N15-Nudr) | Enable |
| N36 UDR subscription (N7/N15-Nudr) | Enable |
| UDR on-demand nrf discovery | Enable |
| CHF (SM-Nchf) | Disable |
| BSF (N7-Nbsf) | NA |
| AMF on demand nrf discovery | Enable |
| LDAP (Gx-LDAP) | Disable |
| Sy (PCF N7-Sy) | Disable |
Table 3-60 PCRF Interfaces
| Feature Name | Status |
|---|---|
| Sy (PCRF Gx-Sy) | NA |
| Sd (Gx-Sd) | NA |
| Gx UDR query (Gx-Nudr) | NA |
| Gx UDR subscription (Gx-Nudr | NA |
| CHF enabled (AM) | Enable |
| Usage Monitoring (Gx) | NA |
| Subscriber HTTP Notifier (Gx) | NA |
Table 3-61 Configuring cnDBTier Helm Parameters
| Helm Parameter | Value | cnDBTier Helm Configuration |
|---|---|---|
| restartSQLNodesIfBinlogThreadStalled | true |
|
| binlog_cache_size | 10485760 |
|
| ConnectCheckIntervalDelay | 500 |
|
| NoOfFragmentLogFiles | 32 |
|
| NoOfFragmentLogParts | 6 |
|
| MaxNoOfExecutionThreads | 14 |
|
| FragmentLogFileSize | 128M |
|
| binlogthreadstore.capacity | 5 |
|
| ndb_allow_copying_alter_table | ON |
|
Note:
The cnDBTier customized parameters values remains same for both site1 and site2.Table 3-62 Policy Microservices Resources
| Service Name | CPU Request Per Pod | CPU Limit Per Pod | Memory Request Per Pod (Gi) | Memory Limit Per Pod (Gi) | Min Replicas | Max Replicas | Request/Limit Isito CPU | Request/Limit Isito Memory |
|---|---|---|---|---|---|---|---|---|
| Appinfo | 1 | 1 | 0.5 | 1 | 2 | 2 | 2 | 2 |
| Audit Service | 2 | 2 | 4 | 4 | 2 | 2 | 2 | 2 |
| CM Service | 2 | 4 | 0.5 | 2 | 2 | 2 | 2 | 2 |
| Config Service | 4 | 4 | 0.5 | 2 | 2 | 2 | 2 | 2 |
| Egress Gateway | 4 | 4 | 6 | 6 | 2 | 27 | 2 | 2 |
| Ingress Gateway | 5 | 5 | 6 | 6 | 2 | 8 | 2.5 | 2 |
| Nrf Client Management | 1 | 1 | 1 | 1 | 2 | 2 | 2 | 2 |
| Diameter Gateway | 4 | 4 | 1 | 2 | 0 | 0 | 2 | 2 |
| Diameter Connector | 4 | 4 | 1 | 2 | 0 | 0 | 2 | 2 |
| AM Service | 8 | 8 | 1 | 4 | 2 | 6 | 2 | 2 |
| UE Service | 8 | 8 | 1 | 4 | 2 | 16 | 2 | 2 |
| Nrf Client Discovery | 4 | 4 | 0.5 | 2 | 2 | 7 | 2 | 2 |
| Query Service | 1 | 2 | 1 | 1 | 2 | 2 | 2 | 2 |
| PCRF Core Service | 8 | 8 | 8 | 8 | 0 | 0 | 2 | 2 |
| Performance | 1 | 1 | 0.5 | 1 | 2 | 2 | 2 | 2 |
| PRE Service | 4 | 4 | 4 | 4 | 2 | 4 | 1.5 | 2 |
| SM Service | 7 | 7 | 10 | 10 | 0 | 0 | 2.5 | 2 |
| PDS | 7 | 7 | 8 | 8 | 2 | 22 | 2.5 | 4 |
| UDR Connector | 6 | 6 | 4 | 4 | 2 | 14 | 2 | 2 |
| CHF Connector | 6 | 6 | 4 | 4 | 0 | 0 | 2 | 2 |
| LDAP Gateway Service | 3 | 4 | 1 | 2 | 0 | 0 | 2 | 2 |
| Binding Service | 6 | 6 | 8 | 8 | 2 | 0 | 2.5 | 2 |
| SOAP Connector | 2 | 4 | 4 | 4 | 0 | 0 | 2 | 2 |
| Alternate Route Service | 2 | 2 | 2 | 4 | 2 | 5 | 2 | 2 |
| Bulwark Service | 8 | 8 | 6 | 6 | 0 | 0 | 2.5 | 2 |
Table 3-63 cnDBTier Microservices Resources:
| Service Name | CPU Request Per Pod | CPU Limit Per Pod | Memory Request Per Pod (Gi) | Memory Limit Per Pod (Gi) | Replicas | Request/Limit Istio CPU | Request/Limit Istio Memory |
|---|---|---|---|---|---|---|---|
| ndbappmysqld | 12 | 20 | 12 | 5 | 5 | ||
| ndbmgmd | 3 | 10 | 2 | 2 | 2 | ||
| ndbmtd | 12 | 129 | 10 | 6 | 6 | ||
| ndbmysqld | 4 | 54 | 6 | 4 | 4 |
3.2.2.2 CPU Utilization
This section lists the CPU utilization for Policy and cnDBTier microservices. The average CPU utilization is the ratio between the (total CPU utilization against total CPU request (X)) versus (target CPU Utilization (Y) configured for the pod).
Table 3-64 Policy Microservices Resource Utilization
| Service | CPU (X/Y) - Site1 |
|---|---|
| ocpcf-alternate-route | 0%/80% |
| ocpcf-appinfo | 0%/80% |
| ocpcf-bulwark | 0%/60% |
| ocpcf-occnp-config-server | 16%/80% |
| ocpcf-occnp-egress-gateway | 60%/80% |
| ocpcf-occnp-ingress-gateway | 55%/80% |
| ocpcf-occnp-nrf-client-nfdiscovery | 43%/80% |
| ocpcf-occnp-nrf-client-nfmanagement | 0%/80% |
| ocpcf-oc-binding | 0%/60% |
| ocpcf-occnp-chf-connector | 0%/50% |
| ocpcf-occnp-udr-connector | 48%/50% |
| ocpcf-ocpm-audit-service | 0%/60% |
| ocpcf-ocpm-policyds | 49%/60% |
| ocpcf-ocpm-pre | 25%/80% |
| ocpcf-pcf-amservice | 32%/30% |
| ocpcf-pcf-ueservice | 54%30% |
| ocpcf-ocpm-queryservice | 0%80% |
Table 3-65 cnDBTier Services Resource Utilization
| Name | CPU (X/Y) - Site1 | CPU (X/Y) - Site2 |
|---|---|---|
| ndbappmysqld | 26%/80% | 20%/80% |
| ndbmgmd | 0%/80% | 0%/80% |
| ndbmtd | 63%/80% | 60%/80% |
| ndbmysqld | 6%/80% | 1%/80% |
3.2.3 Test Scenario: PCF SM Call Model on Two-Site GeoRedundant setup, with each site handling 43K TPS traffic and ASM Enabled
This test run benchmarks the performance and capacity of Policy SM data call model that is deployed in PCF mode on a two-site georedundant setup. The PCF application handles a total (Ingress + Egress) traffic of 60K TPS, with each site handling a traffic of 21.5K TPS. For this setup Aspen Service Mesh (ASM) was enabled.
In this test setup, the Georedundant (GR) mode was enabled in cnDBTier and it was configured for 3 channel replication.
3.2.3.1 Test Case and Setup Details
Table 3-67 Test Case Parmeters
| Parameters | Values |
|---|---|
| Call Rate (Ingress + Egress) | 21.5K TPS on Site1, 21.5K TPS on Site2 |
| ASM | Enable |
| Traffic Ratio | Internet:- 1 SM Create : 74 SM Updates : 1 SM DeleteIMS:- 1 SM Create : 8 SM Updates : 1 SM DeleteAPP:- 1 SM Create : 0 SM Updates : 1 SM DeleteADMIN:- 1 SM Create : 0 SM Updates : 1 SM DeleteIMS Rx:- 1 Create : 1 STR |
| Active Subscribers | 10000000 subscribers and 20000000 sessions |
Policy Project Details:
The Policy design editor based on the Blockly interface was used to set the Policy project for each of the Policy services. The complexity level of Policy Project configured for this run was High.
- Low– No Usage of Loops in Blockly logic, No JSON operations, No complex Java Script code in Object Expression /Statement Expression.
- Medium - Usage of Loops in Blockly logic, Policy Table Wildcard match <= 3 fields, MatchList < 3, 3 < RegEx match < 6
- High - JSON Operations – Custom, complex Java Script code in Object Expression /Statement Expression, Policy Table Wildcard match > 3 fields, MatchLists >= 3, RegEx mat >= 6
Table 3-68 PCF Configuration
| Name | Status |
|---|---|
| Bulwark Service | Enable |
| Binding Service | Enable |
| Subscriber State Variable (SSV) | Enable |
| Validate_user | Disable |
| Alternate Route | Disable |
| Audit Service | Enable |
| Enable Custom JSON | Enable |
Table 3-69 PCF Interfaces
| Feature Name | Status |
|---|---|
| N36 UDR query (N7/N15-Nudr) | Enable |
| N36 UDR subscription (N7/N15-Nudr) | Enable |
| UDR on-demand nrf discovery | Disable |
| CHF (SM-Nchf) | Enable |
| BSF (N7-Nbsf) | Enable |
| AMF on demand nrf discovery | NA |
| LDAP (Gx-LDAP) | NA |
| Sy (PCF N7-Sy) | NA |
Table 3-70 PCRF Interfaces
| Feature Name | Status |
|---|---|
| Sy (PCRF Gx-Sy) | NA |
| Sd (Gx-Sd) | NA |
| Gx UDR query (Gx-Nudr) | NA |
| Gx UDR subscription (Gx-Nudr | NA |
| CHF enabled (AM) | NA |
| Usage Monitoring (Gx) | NA |
| Subscriber HTTP Notifier (Gx) | NA |
Table 3-71 Configuring Policy Helm Parameters
| Service Name | Policy Helm Configuration |
|---|---|
| Ingress Gateway |
|
| Egress Gateway |
|
Note:
The Policy customized parameters values remains same for both site1 and site2.Table 3-72 Configuring cnDBTier Helm Parameters
| Helm Parameter | Value | cnDBTier Helm Configuration |
|---|---|---|
| binlog_cache_size | 10485760 |
|
| ConnectCheckIntervalDelay | 500 |
|
| NoOfFragmentLogFiles | 32 |
|
| NoOfFragmentLogParts | 4 |
|
| MaxNoOfExecutionThreads | 11 |
|
| FragmentLogFileSize | 128M |
|
| binlogthreadstore.capacity | 5 |
|
| ndb_allow_copying_alter_table | ON |
|
Note:
The cnDBTier customized parameters values remains same for both site1 and site2.Table 3-73 Policy Microservices Resources
| Service Name | CPU Request Per Pod | CPU Limit Per Pod | Memory Request Per Pod (Gi) | Memory Limit Per Pod (Gi) | Min Replicas | Max Replicas | Request/Limit Isito CPU | Request/Limit Isito Memory |
|---|---|---|---|---|---|---|---|---|
| Appinfo | 1 | 1 | 0.5 | 1 | 2 | 2 | 2 | 2 |
| Audit Service | 2 | 2 | 4 | 4 | 2 | 2 | 2 | 2 |
| CM Service | 2 | 4 | 0.5 | 2 | 2 | 2 | 2 | 2 |
| Config Service | 4 | 4 | 0.5 | 2 | 2 | 2 | 2 | 2 |
| Egress Gateway | 4 | 4 | 6 | 6 | 2 | 6 | 2 | 2 |
| Ingress Gateway | 5 | 5 | 6 | 6 | 2 | 27 | 2.5 | 2 |
| NRF Client Management | 1 | 1 | 1 | 1 | 2 | 2 | 2 | 2 |
| Diameter Gateway | 4 | 4 | 1 | 2 | 2 | 2 | 2 | 2 |
| Diameter Connector | 4 | 4 | 1 | 2 | 2 | 2 | 2 | 2 |
| AM Service | 8 | 8 | 1 | 4 | 0 | 0 | 2 | 2 |
| UE Service | 8 | 8 | 1 | 4 | 0 | 0 | 2 | 2 |
| NRF Client Discovery | 4 | 4 | 2 | 2 | 2 | 2 | 2 | 2 |
| Query Service | 1 | 2 | 1 | 1 | 2 | 2 | 2 | 2 |
| PCRF Core Service | 8 | 8 | 8 | 8 | 0 | 0 | 2 | 2 |
| Performance | 1 | 1 | 0.5 | 1 | 2 | 2 | 2 | 2 |
| PRE Service | 4 | 4 | 4 | 4 | 2 | 55 | 1.5 | 2 |
| SM Service | 7 | 7 | 10 | 10 | 2 | 76 | 2 | 2 |
| PDS Service | 7 | 7 | 8 | 8 | 2 | 21 | 2.5 | 4 |
| UDR Connector | 6 | 6 | 4 | 2 | 2 | 2 | 2 | 2 |
| CHF Connector | 6 | 6 | 4 | 4 | 2 | 2 | 2 | 2 |
| LDAP Gateway Service | 3 | 4 | 1 | 2 | 0 | 0 | 2 | 2 |
| Binding Service | 6 | 6 | 8 | 8 | 2 | 3 | 2.5 | 2 |
| SOAP Connector | 2 | 4 | 4 | 4 | 0 | 0 | 2 | 2 |
| Alternate Route Service | 2 | 2 | 2 | 4 | 2 | 2 | 2 | 2 |
| Bulwark Service | 8 | 8 | 6 | 6 | 2 | 19 | 2.5 | 2 |
Table 3-74 cnDBTier Microservices Resources:
| Service Name | CPU Request Per Pod | CPU Limit Per Pod | Memory Request Per Pod (Gi) | Memory Limit Per Pod (Gi) | Replicas |
|---|---|---|---|---|---|
| ndbappmysqld | 12 | 12 | 18 | 18 | 18 |
| ndbmgmd | 3 | 3 | 8 | 8 | 2 |
| ndbmtd | 10 | 10 | 132 | 132 | 10 |
| ndbmysqld | 4 | 4 | 54 | 54 | 12 |
Note:
Min Replica = Max Replica3.2.3.2 CPU Utilization
Table 3-75 Policy Microservices Resource Utilization
| Service | CPU (X/Y) - Site 1 | CPU (X/Y) - Site 2 |
|---|---|---|
| ocpcf-occnp-alternate route | 0.10%%/9.56% | 0.10%%/9.97% |
| ocpcf-appinfo | 4.40%/25.78% | 4.50%/25.34% |
| ocpcf-bulwark | 17.55%/17.13% | 0.04%/14.53% |
| ocpcf-occnp-config-server | 6.17%/42.65% | 3.70%/40.19% |
| ocpcf-occnp-egress-gateway | 19.48%/21.97% | 0.04%/20.34% |
| ocpcf-occnp-ingress-gateway | 16.50%/32.03% | 0.54%/25.63% |
| ocpcf-occnp-nrf-client-nfdiscovery | 7.94%/51.84% | 0.07%/38.38% |
| ocpcf-occnp-nrf-client-nfmanagement | 1.75%/50.29% | 0.35%/48.73% |
| ocpcf-oc-binding | 12.36%/17.44% | 0.05%/12.41% |
| ocpcf-occnp-chf-connector | 11.87%/22.10% | 0.05%/18.97% |
| ocpcf-occnp-udr-connector | 14.83%/23.34% | 0.06%/17.67% |
| ocpcf-ocpm-audit-service | 0.22%/16.35% | 0.10%/12.41% |
| ocpcf-ocpm-policyds | 21.13%/22.16% | 0.03%/18.47% |
| ocpcf-ocpm-pre | 21.64%/47.43% | 0.21%/12.82% |
| ocpcf-pcf-smservice | 22.38%/25.81% | 0.04%/18.15% |
| ocpcf-ocpm-queryservice | 0.05%/23.54% | 0.05%/24.12% |
Table 3-76 cnDBTier Services Resource Utilization
| Name | CPU (X/Y) - Site1 | CPU (X/Y) - Site2 |
|---|---|---|
| ndbappmysqld | 28.57%/41.04% | 0.31%/32.17% |
| ndbmgmd | 0.22%/25.38% | 0.22%/25.41% |
| ndbmtd | 55.88%/46.89% | 9.32%/46.90% |
3.2.4 Test Scenario: PCF SM Call Model on Two-Site GeoRedundant setup, with each site handling 30K TPS traffic and ASM Enabled
This test run benchmarks the performance and capacity of Policy SM data call model that is deployed in PCF mode on a two-site georedundant setup. The PCF application handles a total (Ingress + Egress) traffic of 60K TPS, with each site handling a traffic of 30K TPS. For this setup Aspen Service Mesh (ASM) was enabled.
In this test setup, the Georedundant (GR) mode was enabled in cnDBTier and it was configured for 3 channel replication.
3.2.4.1 Test Case and Setup Details
Table 3-78 Test Case Parmeters
| Parameters | Values |
|---|---|
| Call Rate (Ingress + Egress) | 30K TPS on Site1, 30K TPS on Site2 |
| ASM | Enable |
| Traffic Ratio |
Internet:- 1 SM Create : 74 SM Updates : 1 SM Delete IMS Rx:- 1 Create : 1 Update : 1 STR |
| Active Subscribers | 393590 (Site1) + 393589 (Site2) = 787179 |
Policy Project Details:
The Policy design editor based on the Blockly interface was used to set the Policy project for each of the Policy services. The complexity level of Policy Project configured for this run was High.
- Low– No Usage of Loops in Blockly logic, No JSON operations, No complex Java Script code in Object Expression /Statement Expression.
- Medium - Usage of Loops in Blockly logic, Policy Table Wildcard match <= 3 fields, MatchList < 3, 3 < RegEx match < 6
- High - JSON Operations – Custom, complex Java Script code in Object Expression /Statement Expression, Policy Table Wildcard match > 3 fields, MatchLists >= 3, RegEx mat >= 6
Table 3-79 Call Model
| Service Name | DNN1 SM Service (MPS) | DNN2 SM Service and Rx Interface (MPS) | Total MPS | ||||
|---|---|---|---|---|---|---|---|
| Inbound Message | Outbound Message | Inbound Message | Outbound Message | Inbound Message | Outbound Message | ||
| Ingress Gateway | 49000 | 49000 | 1520 | 1520 | 0 | 0 | 101040 |
| SM Service | 49654 | 209036 | 1526 | 10739 | 2533 | 7094 | 280590 |
| PRE Service | 49000 | 0 | 1520 | 0 | 1520 | 0 | 52040 |
| PDS Service | 58114 | 3924 | 3623 | 525 | 3040 | 0 | 69230 |
| Egress Gateway | 4578 | 4578 | 1545 | 1545 | 1520 | 1520 | 15290 |
| NRF Discovery | 654 | 654 | 6 | 6 | 0 | 0 | 1320 |
| UDR Connector | 1962 | 2616 | 513 | 519 | 0 | 0 | 5610 |
| CHF Connector | 1308 | 1308 | 6 | 6 | 0 | 0 | 2630 |
| Binding Service | 1307 | 0 | 2027 | 1014 | 0 | 0 | 4350 |
| Diameter Connector | 0 | 0 | 507 | 507 | 1520 | 2533 | 5070 |
| Diameter Gateway | 0 | 0 | 507 | 507 | 1520 | 1520 | 4060 |
| Bulwark Service | 99308 | 0 | 3052 | 0 | 1013 | 0 | 103380 |
Table 3-80 PCF Configuration
| Name | Status |
|---|---|
| Bulwark Service | Enable |
| Binding Service | Enable |
| Subscriber State Variable (SSV) | Enable |
| Validate_user | Disable |
| Alternate Route | Disable |
| Audit Service | Enable |
| Enable Custom JSON | Enable |
Table 3-81 PCF Interfaces
| Feature Name | Status |
|---|---|
| N36 UDR query (N7/N15-Nudr) | Enable |
| N36 UDR subscription (N7/N15-Nudr) | Enable |
| UDR on-demand nrf discovery | Disable |
| CHF (SM-Nchf) | Enable |
| BSF (N7-Nbsf) | Enable |
| AMF on demand nrf discovery | NA |
| LDAP (Gx-LDAP) | NA |
| Sy (PCF N7-Sy) | NA |
Table 3-82 PCRF Interfaces
| Feature Name | Status |
|---|---|
| Sy (PCRF Gx-Sy) | NA |
| Sd (Gx-Sd) | NA |
| Gx UDR query (Gx-Nudr) | NA |
| Gx UDR subscription (Gx-Nudr | NA |
| CHF enabled (AM) | NA |
| Usage Monitoring (Gx) | NA |
| Subscriber HTTP Notifier (Gx) | NA |
Table 3-83 Configuring Policy Helm Parameters
| Service Name | Policy Helm Configuration |
|---|---|
| Ingress Gateway |
|
| Egress Gateway |
|
Note:
The Policy customized parameters values remains same for both site1 and site2.Table 3-84 Configuring cnDBTier Helm Parameters
| Helm Parameter | Value | cnDBTier Helm Configuration |
|---|---|---|
| binlog_cache_size | 10485760 |
|
| ConnectCheckIntervalDelay | 500 |
|
| NoOfFragmentLogFiles | 32 |
|
| NoOfFragmentLogParts | 4 |
|
| MaxNoOfExecutionThreads | 11 |
|
| FragmentLogFileSize | 128M |
|
| binlogthreadstore.capacity | 5 |
|
| ndb_allow_copying_alter_table | ON |
|
Note:
The cnDBTier customized parameters values remains same for both site1 and site2.Table 3-85 Policy Microservices Resources
| Service Name | CPU Request Per Pod | CPU Limit Per Pod | Memory Request Per Pod (Gi) | Memory Limit Per Pod (Gi) | Min Replicas | Max Replicas | Request/Limit Isito CPU | Request/Limit Isito Memory |
|---|---|---|---|---|---|---|---|---|
| Appinfo | 1 | 1 | 0.5 | 1 | 2 | 2 | 2 | 2 |
| Audit Service | 2 | 2 | 4 | 4 | 2 | 2 | 2 | 2 |
| CM Service | 2 | 4 | 0.5 | 2 | 2 | 2 | 2 | 2 |
| Config Service | 4 | 4 | 0.5 | 2 | 2 | 2 | 2 | 2 |
| Egress Gateway | 4 | 4 | 6 | 6 | 2 | 6 | 2 | 2 |
| Ingress Gateway | 5 | 5 | 6 | 6 | 2 | 27 | 2.5 | 2 |
| NRF Client Management | 1 | 1 | 1 | 1 | 2 | 2 | 2 | 2 |
| Diameter Gateway | 4 | 4 | 1 | 2 | 2 | 2 | 2 | 2 |
| Diameter Connector | 4 | 4 | 1 | 2 | 2 | 2 | 2 | 2 |
| AM Service | 8 | 8 | 1 | 4 | 0 | 0 | 2 | 2 |
| UE Service | 8 | 8 | 1 | 4 | 0 | 0 | 2 | 2 |
| NRF Client Discovery | 4 | 4 | 2 | 2 | 2 | 2 | 2 | 2 |
| Query Service | 1 | 2 | 1 | 1 | 2 | 2 | 2 | 2 |
| PCRF Core Service | 8 | 8 | 8 | 8 | 0 | 0 | 2 | 2 |
| Performance | 1 | 1 | 0.5 | 1 | 2 | 2 | 2 | 2 |
| PRE Service | 4 | 4 | 4 | 4 | 2 | 55 | 1.5 | 2 |
| SM Service | 7 | 7 | 10 | 10 | 2 | 76 | 2.5 | 2 |
| PDS Service | 7 | 7 | 8 | 8 | 2 | 21 | 2.5 | 4 |
| UDR Connector | 6 | 6 | 4 | 2 | 2 | 2 | 2 | 2 |
| CHF Connector | 6 | 6 | 4 | 4 | 2 | 2 | 2 | 2 |
| LDAP Gateway Service | 3 | 4 | 1 | 2 | 0 | 0 | 2 | 2 |
| Binding Service | 6 | 6 | 8 | 8 | 2 | 3 | 2.5 | 2 |
| SOAP Connector | 2 | 4 | 4 | 4 | 0 | 0 | 2 | 2 |
| Alternate Route Service | 2 | 2 | 2 | 4 | 2 | 2 | 2 | 2 |
| Bulwark Service | 8 | 8 | 6 | 6 | 2 | 19 | 2.5 | 2 |
Table 3-86 cnDBTier Microservices Resources:
| Service Name | CPU Request Per Pod | CPU Limit Per Pod | Memory Request Per Pod (Gi) | Memory Limit Per Pod (Gi) | Replicas |
|---|---|---|---|---|---|
| ndbappmysqld | 12 | 12 | 18 | 18 | 18 |
| ndbmgmd | 3 | 3 | 8 | 8 | 2 |
| ndbmtd | 10 | 10 | 132 | 132 | 10 |
| ndbmysqld | 4 | 4 | 54 | 54 | 12 |
Note:
Min Replica = Max Replica3.2.4.2 CPU Utilization
Table 3-87 Policy Microservices Resource Utilization
| Service | CPU (X/Y) - Site1 | CPU (X/Y) - Site2 |
|---|---|---|
| ocpcf-alternate-route | 0%/80% | 0%/80% |
| ocpcf-appinfo | 1%/80% | 1%/80% |
| ocpcf-bulwark | 22%/60% | 23%/60% |
| ocpcf-occnp-config-server | 9%/80% | 10%/80% |
| ocpcf-oc-diam-connector | 8%/40% | 8%/40% |
| ocpcf-occnp-egress-gateway | 11%/80% | 10%/80% |
| ocpcf-occnp-ingress-gateway | 19%/80% | 24%/80% |
| ocpcf-occnp-nrf-client-nfdiscovery | 5%/80% | 5%/80% |
| ocpcf-occnp-nrf-client-nfmanagement | 0%/80% | 0%/80% |
| ocpcf-oc-binding | 17%/60% | 17%/60% |
| ocpcf-occnp-chf-connector | 7%/50% | 7%/50% |
| ocpcf-occnp-udr-connector | 15%/50% | 14%/50% |
| ocpcf-ocpm-audit-service | 0%/50% | 0%/50% |
| ocpcf-ocpm-policyds | 19%/60% | 19%/60% |
| ocpcf-ocpm-pre | 26%/80% | 27%/80% |
| ocpcf-pcf-amservice | 0%/30% | 0%/30% |
| ocpcf-pcf-ueservice | 0%/30% | 0%/30% |
| ocpcf-pcf-smservice | 25%/50% | 25%/50% |
| ocpcf-ocpm-queryservice | 0%80% | 0%80% |
Table 3-88 cnDBTier Services Resource Utilization
| Name | CPU (X/Y) - Site1 | CPU (X/Y) - Site2 |
|---|---|---|
| ndbappmysqld | 42%/80% | 37%/80% |
| ndbmgmd | 0%/80% | 0%/80% |
| ndbmtd | 32%/80% | 31%/80% |
| ndbmysqld | 4%/80% | 4%/80% |
3.2.5 Test Scenario: PCF AM/UE Call Model on Two-Site Georedundant Setup, with Each Site Handling 30K TPS Traffic and ASM Enabled
This test run benchmarks the performance and capacity of Policy AM/UE data call model that is deployed in PCF mode. The PCF application handles a total (Ingress + Egress) traffic of 60K TPS, with each site handling a traffic of 30K TPS. For this setup, Aspen Service Mesh (ASM) was enabled between Policy services and it was disabled between Policy services and cnDBTier data services. Application data compression was enabled at AM, UE, and PDS services. The Multithreaded Applier (MTA) feature that helps in peak replication throughput was enabled at cnDBTier.
3.2.5.1 Test Case and Setup Details
Testcase Parameters
The following table describes the testcase parameters and their values:
| Parameters | Values |
|---|---|
| Call Rate (Ingress + Egress) | 60K TPS (30K on site-1 and 30K on SITE-2) |
| ASM | Enable |
| Traffic Ratio | AM 1-Create 0-update 1-delete UE 1-Create 0-update 1-delete |
| Active User Count | 12000000 |
Project Details
The Policy Design editor based on the Blockly interface was used to set the Policy project for each of the Policy services. The complexity level of Policy Project configured for this run was High.
Complexity Level Definition:
- Low – No usage of loops in Blockly logic, no JSON operations, and no complex Java Script code in object expression/statement expression.
- Medium – Usage of loops in Blockly logic, Policy table wildcard match <= 3 fields, MatchList < 3, and 3 < RegEx match < 6
- High – JSON Operations – Custom, complex Java script code in object Expression/statement expression, Policy table wildcard match > 3 fields, MatchLists >= 3, and RegEx mat >= 6
Call Model Data
Table 3-90 Traffic distribution
| Ingress Gateway | Egress Gateway | Total Ingress/Egress Traffic | Ingress Gateway | Egress Gateway | Total Ingress/Egress Traffic | |
|---|---|---|---|---|---|---|
| UE service | Site 1 | Site 2 | ||||
| 3157 | 10953 | 14109 | 3036 | 10579 | 13615 | |
| AM service | 3158 | 10953 | 14111 | 3078 | 10579 | 13657 |
| Total | 28220 | 27271 | ||||
Policy Configurations
Following Policy configurations were either enabled or disabled for running this call flow:
Table 3-91 Policy microservices configuration
| Name | Status |
|---|---|
| Bulwark | Enabled |
| Binding | Disabled |
| Subscriber State Variable (SSV) | Enabled |
| Validate_user | Disabled |
| Alternate Route | Disabled |
| Audit | Enabled |
| Compression (Binding & SM Service) | Enabled |
| SYSTEM.COLLISION.DETECTION | Enabled |
Following Policy interfaces were either enabled or disabled for running this call flow:
Table 3-92 Policy interfaces
| Feature Name | Status |
|---|---|
| N36 UDR query (N7/N15-Nudr) | Enabled |
| N36 UDR subscription (N7/N15-Nudr) | Enabled |
| UDR on-demand nrf discovery | Disabled |
| CHF (Nchf) | Enabled |
| BSF (N7-Nbsf) | Enabled |
| AMF on demand nrf discovery | NA |
| LDAP (Gx-LDAP) | NA |
| Subscriber HTTP Notifier (Gx) | NA |
Table 3-93 PCRF interfaces
| Feature Name | Status |
|---|---|
| Sy (PCRF Gx-Sy) | NA |
| Sd (Gx-Sd) | NA |
| Gx UDR query (Gx-Nudr) | NA |
| Gx UDR subscription (Gx-Nudr | NA |
| CHF enabled (AM) | NA |
| Usage Monitoring (Gx) | NA |
| Subscriber HTTP Notifier (Gx) | NA |
Configuring Policy Helm Parameters
The following Policy optimization parameters were configured for this run:
Table 3-94 Optimization parameters for Policy services
| Service | Policy Helm Configurations |
|---|---|
| policyds |
|
| UE |
|
| INGRESS |
|
| EGRESS |
|
Configuring cnDbTier Helm Parameters
The following cnDBTier optimization parameters were configured for this run:
Table 3-95 Optimization paramters for CnDBTier services
| Helm Parameter | Value | CnDBTier Helm Configuration |
|---|---|---|
| ConnectCheckIntervalDelay | 500 |
|
| NoOfFragmentLogParts | 4 |
|
| MaxNoOfExecutionThreads | 11 |
|
| FragmentLogFileSize | 128M |
|
| NoOfFragmentLogFiles | 32 |
|
| binlogthreadstore.capacity | 5 |
|
| ndb_allow_copying_alter_table | ON |
|
| binlog_cache_size | 10485760 |
|
Policy Microservices Resources
Table 3-96 Policy microservices Resource allocation for Site1
| Service Name | CPU Resource per Container (Limit) | CPU Resource per Container (Request) | Memory Resource per Container (Limit) | Memory Resource per Container (Request) | Replica Count | Request/Limit Istio CPU | Request/Limit Istio Memory (Gi) |
|---|---|---|---|---|---|---|---|
| Appinfo | 1 | 1 | 1 Gi | 512Mi | 2 | 2 | 2 Gi |
| Audit Service | 2 | 2 | 4 Gi | 4 Gi | 2 | 2 | 2 Gi |
| CM Service | 4 | 4 | 2 Gi | 2 Gi | 2 | 2 | 2 Gi |
| Config Service | 4 | 2 | 2Gi | 2Gi | 2 | 2 | 2 Gi |
| Egress Gateway | 2 | 2 | 6Gi | 6Gi | 27 | 4 | 2 Gi |
| Ingress Gateway | 5 | 5 | 6Gi | 6Gi | 8 | 2500m | 2Gi |
| NRF Client NF Discovry | 6 | 6 | 10Gi | 10Gi | 9 | 2 | 2Gi |
| NRF Client Management | 1 | 1 | 1Gi | 1Gi | 1 | 2 | 2Gi |
| AM Service | 6 | 6 | 10Gi | 12 | 3 | 2Gi | |
| UE Service | 8 | 8 | 2Gi | 2Gi | 20 | 3 | 1Gi |
| Query Service | 2 | 1 | 1Gi | 1Gi | 2 | ||
| Performance | 1 | 1 | 1Gi | 512Mi | 2 | ||
| PRE | 4 | 4 | 4Gi | 4Gi | 7 | 1500m | 2Gi |
| SM Service | 1 | 1 | 1Gi | 1Gi | 1 | 3 | 2Gi |
| PDS | 7 | 7 | 8Gi | 8Gi | 24 | 3 | 4 Gi |
| UDR Connector | 4 | 4 | 4Gi | 4Gi | 20 | 2 | 2Gi |
| CHF Connector/ User Service | 6 | 6 | 4Gi | 4Gi | 8 | 2 | 2Gi |
| Alternate Route Service | 2 | 2 | 4Gi | 2Gi | 1 | 2 | 2Gi |
| Bulwark Service | 8 | 8 | 4Gi | 4Gi | 7 | 3 | 4Gi |
Table 3-97 Policy microservices Resource allocation for site2
| Service Name | CPU Resource per Container (Limit) | CPU Resource per Container (Request) | Memory Resource per Container (Limit) | Memory Resource per Container (Request) | Replica Count | Request/Limit Istio CPU | Request/Limit Istio Memory (Gi) |
|---|---|---|---|---|---|---|---|
| Appinfo | 1 | 1 | 1 Gi | 512Mi | 2 | 2 | 2 Gi |
| Audit Service | 2 | 2 | 4 Gi | 4 Gi | 2 | 2 | 2 Gi |
| CM Service | 4 | 4 | 2 Gi | 2 Gi | 2 | 2 | 2 Gi |
| Config Service | 4 | 2 | 2Gi | 500m | 2 | 2 | 2 Gi |
| Egress Gateway | 4 | 4 | 6Gi | 6Gi | 20 | 2 | 2 Gi |
| Ingress Gateway | 5 | 5 | 6Gi | 6Gi | 8 | 2.5 | 2Gi |
| NRF Client NF Discovery | 6 | 6 | 10Gi | 10Gi | 9 | 2 | 2Gi |
| NRF Client Management | 1 | 1 | 1Gi | 1Gi | 1 | 2 | 2Gi |
| AM Service | 6 | 6 | 10Gi | 10Gi | 9 | 3 | 2Gi |
| UE Service | 8 | 8 | 4Gi | 4Gi | 18 | 2 | 2Gi |
| Query Service | 2 | 1 | 1Gi | 1Gi | 2 | ||
| Performance | 1 | 1 | 1Gi | 512Mi | 2 | ||
| PRE | 4 | 4 | 4Gi | 4Gi | 7 | 1.5 | 2Gi |
| SM Service | 1 | 1 | 1Gi | 1Gi | 1 | 0.5 | 2Gi |
| PDS | 7 | 7 | 8Gi | 8Gi | 22 | 2.5 | 4Gi |
| UDR Connector | 4 | 4 | 4Gi | 4Gi | 20 | 2 | 2Gi |
| CHF Connector/ User Service | 6 | 6 | 4Gi | 4Gi | 3 | 2 | 2Gi |
| Alternate Route Service | 0.5 | 0.5 | 4Gi | 2Gi | 1 | 0.5 | 2Gi |
| Bulwark Service | 8 | 8 | 4Gi | 4Gi | 5 | 2 | 4Gi |
Table 3-98 CnDBTier Resource allocation for site1
| Service Name | CPU Resource per Container (Limit) | CPU Resource per Container (Request) | Memory Resource per Container (Limit) | Memory Resource per Container (Request) | Replica Count | Request/Limit Istio CPU | Request/Limit Istio Memory (Gi) |
|---|---|---|---|---|---|---|---|
| ndbappmysqld | 12 | 12 | 20Gi | 20Gi | 12 | 5 | 5Gi |
| ndbmgmd | 3 | 3 | 8Gi | 8Gi | 2 | 3 | 1Gi |
| ndbmtd | 12 | 12 | 129Gi | 129Gi | 10 | 6 | 6Gi |
| ndbmysqld | 4 | 4 | 16Gi | 16Gi | 6 | 5 | 5Gi |
Table 3-99 CnDBTier resource allocation for site2
| Service Name | CPU Resource per Container (Limit) | CPU Resource per Container (Request) | Memory Resource per Container (Limit) | Memory Resource per Container (Request) | Replica Count | Request/Limit Istio CPU | Request/Limit Istio Memory (Gi) |
|---|---|---|---|---|---|---|---|
| ndbappmysqld | 12 | 12 | 20Gi | 20Gi | 12 | 5 | 5Gi |
| ndbmgmd | 3 | 3 | 8Gi | 8Gi | 2 | 3 | 1Gi |
| ndbmtd | 12 | 12 | 129Gi | 129Gi | 10 | 6 | 6Gi |
| ndbmysqld | 4 | 4 | 16Gi | 16Gi | 6 | 5 | 5Gi |
3.2.5.2 CPU Utilization
This section lists the CPU utilization for Policy and cnDBTier microservices. The CPU utilization is the ratio between the (total CPU utilization against total CPU request (X)) versus (target CPU Utilization (Y) configured for the pod).
Policy Microservices Resource Utilization
The following table describes the bench mark number as per the system maximum capacity utilization for Policy microservices.
The average CPU utilization is the ratio between the current usage of resource to the requested resources of the pod i.e., total sum of CPU utilized for service pods / total CPU requested for service pods.
Table 3-100 CPU/Memory Utilization by Policy Microservices
| Service | CPU (Site 1) | Memory (Site 1) | CPU (Site 2) | Memory (Site 2) |
|---|---|---|---|---|
| ocpcf-occnp-alternate route/istio | 0.10% | 4.88% | 0.60% | 4.44% |
| ocpcf-occnp-alternate route | 0.15% | 9.38% | 0.60% | 6.76% |
| ocpcf-appinfo/istio | '0.18% | 5.35% | 0.20% | 5.18% |
| ocpcf-appinfo | 2.65% | 23.78% | '4.40% | 23.58% |
| ocpcf-bulwark/istio | 25.27% | 2.30% | 59.09% | 2.88% |
| ocpcf-bulwark | 17.78%' | 17.36% | 29.15% | 20.51% |
| ocpcf-occnp-config-server/istio | 11.30% | 5.42%' | 14.03% | 6.42% |
| ocpcf-occnp-config-server | 7.51% | 29.98% | 9.46% | 30.44% |
| ocpcf-occnp-egress-gateway/istio | 5.90% | 5.18% | 13.11% | 5.89% |
| ocpcf-occnp-egress-gateway | 23.25% | 19.32% | 38.80% | 20.48% |
| ocpcf-occnp-ingress-gateway/istio | 21.98% | 6.99% | 18.80% | 7.64% |
| ocpcf-occnp-ingress-gateway | 19.87% | 24.11% | 23.62% | 23.45% |
| ocpcf-occnp-nrf-client-nfdiscovery/istio | 17.95% | 5.21% | 27.92% | 5.83% |
| ocpcf-occnp-nrf-client-nfdiscovery | 9.81% | 9.91% | 13.84% | 9.48% |
| ocpcf-occnp-nrf-client-nfmanagement/istio | 0.15% | 4.79% | 0.20% | 5.22% |
| ocpcf-occnp-nrf-client-nfmanagement | 0.40% | 44.92% | 0.40% | 47.17% |
| ocpcf-performance/perf-info | 1.90% | 11.82% | 1.00% | 12.40% |
| ocpcf-occnp-chf-connector/istio | 14.88% | 5.22% | 47.70% | 6.23% |
| ocpcf-occnp-chf-connector | 7.78% | 14.96% | 24.25% | 14.87% |
| ocpcf-occnp-udr-connector/istio | 20.30% | 5.52% | 29.43% | 6.24% |
| ocpcf-occnp-udr-connector | 18.32% | 15.26% | 23.51% | 15.08% |
| ocpcf-ocpm-audit-service/istio | 0.18% | 4.61% | 0.25% | 5.10% |
| ocpcf-ocpm-audit-service | 0.22% | 13.00% | 0.83% | 12.59% |
| ocpcf-ocpm-cm-service/istio | 0.80% | 4.96% | 0.92% | 5.20% |
| ocpcf-ocpm-cm-service/cm-service | 0.76% | 28.34% | 0.83% | 30.76% |
| ocpcf-ocpm-policyds/istio | 21.30% | 2.84% | 35.80% | 3.03% |
| ocpcf-ocpm-policyds | 24.84% | 30.74% | 33.41% | 31.08% |
| ocpcf-occnp-amservice/istio | 24.62% | 5.72% | 43.19% | 6.43% |
| ocpcf-occnp-amservice | 26.90% | 9.40% | 44.37% | 10.71% |
| ocpcf-ocpm-pre/istio | 24.99% | 5.81% | 45.51% | 5.82% |
| ocpcf-ocpm-pre | '18.59% | 32.53% | 30.70% | 30.35% |
| ocpcf-pcf-smservice/istio | 0.17% | 4.83% | .60% | 6.01% |
| ocpcf-pcf-smservice | 0.40% | 37.11% | 0.40% | 37.40% |
| ocpcf-pcf-ueservice/istio | 15.49% | 5.64% | 35.09% | 6.01% |
| ocpcf-pcf-ueservice | 22.16% | 34.16% | 29.61% | 38.23% |
| ocpcf-ocpm-queryservice | 0.05% | 23.39% | 0.50% | 23.68% |
Observed CPU utilization Values of cnDBTier Services
The following table provides information about observed values of cnDBTier services.
Table 3-101 CPU/Memory Utilization by CnDBTier services
| Service | CPU (Site 1) | Memory CPU (Site 1) | CPU (Site 2) | Memory (Site 2) |
|---|---|---|---|---|
| ndbappmysqld/istio | 23.14% | 2.48% | 22.78% | 2.50% |
| ndbappmysqld/mysqlndbcluster | 21.31% | 50.17% | 26.48% | 35.47% |
| ndbappmysqld/init-sidecar | 2.25% | 0.39% | 3.00% | 0.39% |
| ndbmgmd/istio-proxy | 0.33% | 10.74% | 0.43% | 11.38% |
| ndbmgmd/mysqlndbcluster | 0.25% | 25.21% | 0.35% | 25.16% |
| ndbmtd/istio-proxy | 47.02% | 2.06% | 31.61% | 1.96% |
| ndbmtd/mysqlndbcluster | 44.95% | 81.17% | 42.45% | 79.71% |
| ndbmysqld/istio-proxy | 0.00% | 0.00% | 0.00% | 0.00% |
| ndbmysqld/mysqlndbcluster | 4.23% | 30.30% | 7.72% | 28.85% |
| ndbmysqld/init-sidecar | 2.00% | 0.39% | 2.83% | 0.59% |
3.2.6 Test Scenario: PCF AM/UE Call Model on Two-Site Georedundant Setup, with Single-Site Handling 60K TPS Traffic and ASM Enabled
This test run benchmarks the performance and capacity of Policy AM/UE data call model that is deployed in PCF mode.. The PCF application handles a total traffic (Ingress + Egress) of 60K TPS on one site and there is no traffic on the other site. APP Compression was enabled. The test was run for 1.0 hour duration. For this setup, Aspen Service Mesh (ASM) was enabled between Policy services and it was disabled between Policy service pods and DB data pods.
In this test setup, the Georedundant (GR) mode was enabled in cnDBTier. It was configured for 2 channel replication and the Application Data compression was enabled at AM, UE, and PDS services on Site 2.
3.2.6.1 Test Case and Setup Details
Testcase Parameters
The following table describes the testcase parameters and their values:
| Parameters | Values |
|---|---|
| Call Rate (Ingress + Egress) | 60k on site-1 and no traffic on site-2 |
| ASM | Enable |
| Traffic Ratio |
AM 1-Create 0-update 1-delete UE 1-Create 0-update 1-delete |
| Active User Count | 12000000 |
Project Details
The Policy Design editor based on the Blockly interface was used to set the Policy project for each of the Policy services. The complexity level of Policy Project configured for this run was High.
Complexity Level Definition:
- Low – No usage of loops in Blockly logic, no JSON operations, and no complex Java Script code in object expression/statement expression.
- Medium – Usage of loops in Blockly logic, Policy table wildcard match <= 3 fields, MatchList < 3, and 3 < RegEx match < 6
- High – JSON Operations – Custom, complex Java script code in object Expression/statement expression, Policy table wildcard match > 3 fields, MatchLists >= 3, and RegEx mat >= 6
Call Model Data
Table 3-102 Traffic distribution
| Ingress Gateway | Egress Gateway | Total Ingress/Egress Traffic | Ingress Gateway | Egress Gateway | Total Ingress/Egress Traffic | |
|---|---|---|---|---|---|---|
| UE service | Site 1 | Site 2 | ||||
| 6672 | 30024 | 36696 | - | - | - | |
| AM service | 6672 | 16680 | 23352 | - | - | - |
| Total | 60048 | - | - | - | ||
Policy Configurations
Following Policy microservices were either enabled or disabled for running this call flow:
Table 3-103 Policy microservices configuration
| Name | Status |
|---|---|
| Bulwark | Enabled |
| Binding | Disabled |
| Subscriber State Variable (SSV) | Dnabled |
| Validate_user | Disabled |
| Alternate Route | Disabled |
| Audit | Enabled |
| Compression (Binding & SM Service) | Enabled |
| SYSTEM.COLLISION.DETECTION | Enabled |
Following Policy interfaces were either enabled or disabled for running this call flow:
Table 3-104 Policy interfaces
| Feature Name | Status |
|---|---|
| N36 UDR query (N7/N15-Nudr) | Enable |
| N36 UDR subscription (N7/N15-Nudr) | Enable |
| UDR on-demand nrf discovery | Disable |
| CHF (SM-Nchf) | Enable |
| BSF (N7-Nbsf) | Enable |
| AMF on demand nrf discovery | NA |
| LDAP (Gx-LDAP) | NA |
| Subscriber HTTP Notifier (Gx) | NA |
The following PCRF interfaces that were either enabled or disabled to run this call flow:
Table 3-105 PCRF interfaces
| Feature Name | Status |
|---|---|
| Sy (PCRF Gx-Sy) | NA |
| Sd (Gx-Sd) | NA |
| Gx UDR query (Gx-Nudr) | NA |
| Gx UDR subscription (Gx-Nudr | NA |
| CHF enabled (AM) | NA |
| Usage Monitoring (Gx) | NA |
| Subscriber HTTP Notifier (Gx) | NA |
Configuring Policy Helm Parameters
The following Policy optimization parameters were configured for this run:
Table 3-106 Optimization parameters for Policy services
| Service | Policy Helm Configurations |
|---|---|
| policyds |
|
| UE |
|
| INGRESS |
|
| EGRESS |
|
Configuring cnDbTier Helm Parameters
The following cnDBTier optimization parameters were configured for this run:
Table 3-107 Optimization paramters for CnDBTier services
| Helm Parameter | Value | CnDBTier Helm Configuration |
|---|---|---|
| ConnectCheckIntervalDelay | 500 |
|
| NoOfFragmentLogParts | 4 |
|
| MaxNoOfExecutionThreads | 11 |
|
| FragmentLogFileSize | 128M |
|
| NoOfFragmentLogFiles | 32 |
|
| binlogthreadstore.capacity | 5 |
|
| ndb_allow_copying_alter_table | ON |
|
| binlog_cache_size | 10485760 |
|
Policy Microservices Resources
Table 3-108 Policy microservices resource allocation for site1
| Service Name | CPU Resource per Container (Limit) | CPU Resource per Container (Request) | Memory Resource per Container (Limit) | Memory Resource per Container (Request) | Replica Count | Request/Limit Istio CPU | Request/Limit Istio Memory (Gi) |
|---|---|---|---|---|---|---|---|
| Appinfo | 1 | 1 | 1 Gi | 512Mi | 2 | 2 | 2 Gi |
| Audit Service | 2 | 2 | 4 Gi | 4 Gi | 2 | 2 | 2 Gi |
| CM Service | 4 | 4 | 2 Gi | 2 Gi | 2 | 2 | 2 Gi |
| Config Service | 4 | 2 | 2Gi | 2Gi | 2 | 2 | 2 Gi |
| Egress Gateway | 2 | 2 | 6Gi | 6Gi | 27 | 4 | 2 Gi |
| Ingress Gateway | 5 | 5 | 6Gi | 6Gi | 8 | 2.5 | 2 Gi |
| NRF Client NF Discovry | 6 | 6 | 10Gi | 10Gi | 9 | 2 | 2 Gi |
| NRF Client Management | 1 | 1 | 1Gi | 1Gi | 1 | 2 | 2 Gi |
| AM Service | 6 | 6 | 10Gi | 10Gi | 12 | 3 | 2 Gi |
| UE Service | 8 | 8 | 2Gi | 2Gi | 20 | 2 | 1 Gi |
| Query Service | 2 | 1 | 1Gi | 1Gi | 2 | ||
| Performance | 1 | 1 | 1Gi | 512Mi | 2 | 2 | 1 Gi |
| PRE | 4 | 4 | 4Gi | 4Gi | 7 | 1.5 | 2 Gi |
| SM Service | 1 | 1 | 1Gi | 1Gi | 1 | 3 | 2 Gi |
| PDS | 7 | 7 | 8Gi | 8Gi | 24 | 3 | 4 Gi |
| UDR Connector | 4 | 4 | 4Gi | 4Gi | 20 | 2 | 2 Gi |
| CHF Connector/ User Service | 6 | 6 | 4Gi | 4Gi | 8 | 2 | 2 Gi |
| Alternate Route Service | 2 | 2 | 4Gi | 2Gi | 1 | 2 | 2 Gi |
| Bulwark Service | 8 | 8 | 4Gi | 4Gi | 7 | 3 | 4 Gi |
Table 3-109 Policy microservices resource allocation for site2
| Service Name | CPU Resource per Container (Limit) | CPU Resource per Container (Request) | Memory Resource per Container (Limit) | Memory Resource per Container (Request) | Replica Count | Request/Limit Istio CPU | Request/Limit Istio Memory |
|---|---|---|---|---|---|---|---|
| Appinfo | 1 | 1 | 1 Gi | 512Mi | 2 | 2 | 2 Gi |
| Audit Service | 2 | 2 | 4 Gi | 4 Gi | 2 | 2 | 2 Gi |
| CM Service | 4 | 4 | 2 Gi | 2 Gi | 2 | 2 | 2 Gi |
| Config Service | 4 | 2 | 2Gi | 500m | 2 | 2 | 2 Gi |
| Egress Gateway | 4 | 4 | 6Gi | 6Gi | 20 | 2 | 2 Gi |
| Ingress Gateway | 5 | 5 | 6Gi | 6Gi | 8 | 2.5 | 2Gi |
| NRF Client NF Discovery | 6 | 6 | 10Gi | 10Gi | 9 | 2 | 2 Gi |
| NRF Client Management | 1 | 1 | 1Gi | 1Gi | 1 | 2 | 2 Gi |
| AM Service | 6 | 6 | 10Gi | 10Gi | 9 | 3 | 2 Gi |
| UE Service | 8 | 8 | 4Gi | 4Gi | 18 | 2 | 2 Gi |
| Query Service | 2 | 1 | 1Gi | 1Gi | 2 | ||
| Performance | 1 | 1 | 1Gi | 512Mi | 2 | ||
| PRE | 4 | 4 | 4Gi | 4Gi | 7 | 1.5 | 2 Gi |
| SM Service | 1 | 1 | 1Gi | 1Gi | 1 | 0.5 | 2 Gi |
| PDS | 7 | 7 | 8Gi | 8Gi | 22 | 2.5 | 4 Gi |
| UDR Connector | 4 | 4 | 4Gi | 4Gi | 20 | 2 | 2 Gi |
| CHF Connector/ User Service | 6 | 6 | 4Gi | 4Gi | 3 | 2 | 2 Gi |
| Alternate Route Service | 0.5 | 0.5 | 4Gi | 2Gi | 1 | 0.5 | 2 Gi |
| Bulwark Service | 8 | 8 | 4Gi | 4Gi | 5 | 2 | 4 Gi |
Table 3-110 CnDBTier resource allocation for site1
| Service Name | CPU Resource per Container (Limit) | CPU Resource per Container (Request) | Memory Resource per Container (Limit) | Memory Resource per Container (Request) | Replica Count | Request/Limit Istio CPU | Request/Limit Istio Memory |
|---|---|---|---|---|---|---|---|
| ndbappmysqld/mysqlndbcluster | 12 | 12 | 20Gi | 20Gi | 12 | 5 | 5Gi |
| ndbappmysqld/init-sidecar | 0.1 | 0.1 | 256Mi | 256Mi | 12 | ||
| ndbmgmd/mysqlndbcluster | 3 | 3 | 8Gi | 8Gi | 2 | 3 | 1Gi |
| ndbmtd/mysqlndbcluster | 12 | 12 | 129Gi | 129Gi | 10 | 6 | 6Gi |
| ndbmysqld/mysqlndbcluster | 4 | 4 | 16Gi | 16Gi | 6 | 5 | 5Gi |
| ndbmysqld/init-sidecar | 0.1 | 0.1 | 256Mi | 256Mi | 6 |
Table 3-111 CnDBTier resource allocation for site2
| Service Name | CPU Resource per Container (Limit) | CPU Resource per Container (Request) | Memory Resource per Container (Limit) | Memory Resource per Container (Request) | Replica Count | Request/Limit Istio CPU | Request/Limit Istio Memory |
|---|---|---|---|---|---|---|---|
| ndbappmysqld/mysqlndbcluster | 12 | 12 | 20Gi | 20Gi | 12 | 5 | 5Gi |
| ndbappmysqld/init-sidecar | 0.1 | 0.1 | 256Mi | 256Mi | 12 | ||
| ndbmgmd/mysqlndbcluster | 3 | 3 | 8Gi | 8Gi | 2 | 3 | 1Gi |
| ndbmtd/mysqlndbcluster | 12 | 12 | 129Gi | 129Gi | 10 | 6 | 6Gi |
| ndbmysqld/mysqlndbcluster | 4 | 4 | 16Gi | 16Gi | 6 | 5 | 5Gi |
| ndbmysqld/init-sidecar | 0.1 | 0.1 | 256Mi | 256Mi | 6 |
3.2.6.2 CPU Utilization
This section lists the CPU utilization for Policy and cnDBTier microservices. The CPU utilization is the ratio between the (total CPU utilization against total CPU request (X)) versus (target CPU Utilization (Y) configured for the pod).
Policy Microservices Resource Utilization
The following table describes the bench mark number as per the system maximum capacity utilization for Policy microservices.
The average CPU utilization is the ratio between the current usage of resource to the requested resources of the pod i.e., total sum of CPU utilized for service pods / total CPU requested for service pods.
Table 3-112 CPU/Memory Utilization by Policy Microservices
| Service | CPU (Site 1) | Memory (Site 1) | CPU (Site 2) | Memory (Site 2) |
|---|---|---|---|---|
| ocpcf-appinfo/istio | 0.25% | 7.18% | 0.22% | 5.59% |
| ocpcf-appinfo | 4.20 | 32.97% | 2.50% | 23.24% |
| ocpcf-bulwark/istio | 0.10% | 2.91% | 0.15% | 2.78% |
| ocpcf-bulwark | 0.04% | 37.21% | 0.05% | 12.23% |
| ocpcf-oc-binding/istio | 0.20% | 5.57% | 0.30% | 6.01% |
| ocpcf-oc-binding/binding | 0.03% | 7.73% | 0.03% | 7.46% |
| ocpcf-occnp-alternate route/istio | 0.15% | 5.27% | 0.25% | 5.42% |
| ocpcf-occnp-alternate route/istio | 0.10% | 9.59% | 0.10% | 9.35% |
| ocpcf-occnp-chf-connector/istio | 11.60% | 5.03% | 0.50% | 5.76% |
| ocpcf-occnp-chf-connector | 12.10% | 10.72% | 0.08% | 10.94% |
| ocpcf-occnp-config-server/istio | 13.85% | 6.13% | 5.80% | 6.23% |
| ocpcf-occnp-config-server | 9.50% | 43.14% | 3.50% | 36.67% |
| ocpcf-occnp-egress-gateway/istio | 10.13% | 5.40% | 0.19% | 5.92% |
| ocpcf-occnp-egress-gateway | 49.76% | 19.64% | 0.07% | 9.69% |
| ocpcf-occnp-ingress-gateway/istio | 36.23% | 10.00% | 0.20% | 5.85% |
| ocpcf-occnp-ingress-gateway | 45.73% | 32.97% | 0.24% | 19.07% |
| ocpcf-occnp-nrf-client-nfdiscovery/istio | 59.12% | 8.17% | 0.26% | 5.82% |
| ocpcf-occnp-nrf-client-nfdiscovery | 51.44% | 59.33% | 0.08% | 33.86% |
| ocpcf-occnp-nrf-client-nfmanagement/istio | 0.70% | 5.42% | 0.20% | 5.57% |
| ocpcf-occnp-nrf-client-nfmanagement | 0.40% | 44.82% | 0.40% | 46.39% |
| ocpcf-occnp-udr-connector/istio | 69.88% | 8.00% | 0.47% | 5.69% |
| ocpcf-occnp-udr-connector | 35.60% | 32.06% | 0.08% | 11.15% |
| ocpcf-ocpm-audit-service/istio | 0.25% | 5.59% | 0.25% | 5.47% |
| ocpcf-ocpm-audit-service | 0.57% | 23.69% | 0.38% | 13.01% |
| ocpcf-ocpm-cm-service/istio | 0.85% | 5.27% | 0.55% | 6.05% |
| ocpcf-ocpm-cm-service/cm-service | 0.71% | 37.21% | 0.33% | 33.81% |
| ocpcf-ocpm-policyds/istio | 49.69% | 3.91% | 0.17% | 2.86% |
| ocpcf-ocpm-policyds | 40.46% | 32.78% | 0.03% | 14.43% |
| ocpcf-ocpm-pre/istio | 33.67% | 7.14% | 0.35% | 6.24% |
| ocpcf-ocpm-pre | 37.21% | 49.02% | 0.31% | 8.65% |
| ocpcf-ocpm-queryservice | 0.05% | 28.22% | 0.08% | 24.41% |
| ocpcf-occnp-amservice/istio | 32.87% | 8.59% | 0.39% | 5.86% |
| ocpcf-occnp-amservice | 29.83% | 23.16% | 0.04% | 12.90% |
| ocpcf-pcf-ueservice/istio | 56.27% | 9.83% | 0.35% | 5.65% |
| ocpcf-pcf-ueservice | 44.94% | 45.22% | 0.05% | 14.07% |
| ocpcf-performance/perf-info | 3.10% | 10.84% | 1.40% | 11.04% |
Observed CPU utilization Values of cnDBTier Services
The following table provides information about observed values of cnDBTier services.
Table 3-113 CPU/Memory Utilization by CnDBTier services
| App/Container | CPU (Site1) | Memory (Site1) | CPU (Site2) | Memory (Site2) |
|---|---|---|---|---|
| ndbappmysqld/istio-proxy | 0.40% | 2.00% | 0.33% | 2.22% |
| ndbappmysqld/mysqlndbcluster | 0.19% | 20.91% | 0.20% | 20.88% |
| ndbappmysqld/init-sidecar | 2.08% | 0.39% | 2.17% | 0.39% |
| ndbmgmd/istio-proxy | 0.55% | 9.96% | 0.68% | 10.79% |
| ndbmgmd/mysqlndbcluster | 0.37% | 25.12% | 0.40% | 25.12% |
| ndbmtd/istio-proxy | 0.66% | 1.75% | 0.53% | 1.39% |
| ndbmtd/mysqlndbcluster | 0.69% | 81.13% | 5110.41% | 71.33% |
| ndbmysqld/istio-proxy | 0.00% | 0.00% | 0.00% | 0.00% |
| ndbmysqld/mysqlndbcluster | 0.52% | 26.07% | 0.57% | 26.07% |
| ndbmysqld/init-sidecar | 2.33% | 0.39% | 2.17% | 0.39% |
3.2.7 Test Scenario: PCF AM/UE Call Model on Two-Site Georedundant Setup, with Single-Site Handling 75K TPS Traffic and ASM Enabled
This test run benchmarks the performance and capacity of Policy AM/UE data call model that is deployed in PCF mode. The PCF application handles a total traffic (Ingress + Egress) of 75K TPS on one site and there is no traffic on the other site. Application compression was enabled. For this setup, Aspen Service Mesh (ASM) was enabled between Policy services and it was disabled between Policy service pods and Database data pods.
In this test setup, the Georedundant (GR) mode was enabled in cnDBTier. It was configured for 3 channel replication and the Application Data compression was enabled at AM, UE, and PDS services on Site 2.
3.2.7.1 Test Case and Setup Details
Table 3-114 Testcase Parameters
| Parameters | Values |
|---|---|
| Call Rate (Ingress + Egress) | 75k on site-1 and no traffic on site-2 |
| ASM | Enable |
| Traffic Ratio |
AM 1-Create 0-update 1-delete UE 1-Create 0-update 1-delete |
| Active User Count | 12000000 |
Project Details
The Policy Design editor based on the Blockly interface was used to set the Policy project for each of the Policy services. The complexity level of Policy Project configured for this run was High.
Complexity Level Definition:
- Low – No usage of loops in Blockly logic, no JSON operations, and no complex Java Script code in object expression/statement expression.
- Medium – Usage of loops in Blockly logic, Policy table wildcard match <= 3 fields, MatchList < 3, and 3 < RegEx match < 6
- High – JSON Operations – Custom, complex Java script code in object Expression/statement expression, Policy table wildcard match > 3 fields, MatchLists >= 3, and RegEx mat >= 6
Call Model Data
Table 3-115 Traffic distribution on Site1
| Services | Ingress Gateway | Egress Gateway | Total Ingress/Egress Traffic |
|---|---|---|---|
| UE service | 8340 | 37530 | 45870 |
| AM service | 8340 | 20850 | 29190 |
| Total | 75060 |
Policy Configurations
Following Policy microservices or features were either enabled or disabled for running this call flow:
Table 3-116 Policy microservices or features configuration
| Name | Status |
|---|---|
| Bulwark | Enabled |
| Binding | Disabled |
| Local Subscriber State Variable (SSV) | Enabled |
| Validate_user | Disabled |
| Alternate Route | Disabled |
| Audit | Enabled |
| Compression (AM, SM, and PDS Service) | Enabled |
| SYSTEM.COLLISION.DETECTION | Enabled |
| CHF Async | Enabled |
| Session Limiting | Enabled |
| Collision Detection | Enabled |
| Pending Transaction for Bulwark | Enabled |
| Preferntial Search | SUPI |
Following Policy interfaces were either enabled or disabled for running this call flow:
Table 3-117 Policy interfaces
| Feature Name | Status |
|---|---|
| N36 UDR query (N7/N15-Nudr) | Enabled |
| N36 UDR subscription (N7/N15-Nudr) | Enabled |
| UDR on-demand nrf discovery | Enabled |
| CHF (SM-Nchf) | Enabled |
| BSF (N7-Nbsf) | Disabled |
| AMF on demand nrf discovery | NA |
| LDAP (Gx-LDAP) | NA |
| Subscriber HTTP Notifier (Gx) | NA |
The following PCRF interfaces that were either enabled or disabled to run this call flow:
Table 3-118 PCRF interfaces
| Feature Name | Status |
|---|---|
| Sy (PCRF Gx-Sy) | NA |
| Sd (Gx-Sd) | NA |
| Gx UDR query (Gx-Nudr) | NA |
| Gx UDR subscription (Gx-Nudr | NA |
| CHF enabled (AM) | NA |
| Usage Monitoring (Gx) | NA |
| Subscriber HTTP Notifier (Gx) | NA |
Configuring Policy Helm Parameters
The following Policy optimization parameters were configured for this run:
Table 3-119 Optimization parameters for Policy services
| Service | Policy Helm Configurations |
|---|---|
| policyds |
|
| UE |
|
| INGRESS |
|
| EGRESS |
|
Configuring cnDbTier Helm Parameters
The following cnDBTier optimization parameters were configured for this run:
Table 3-120 Optimization paramters for CnDBTier services
| Helm Parameter | Value | CnDBTier Helm Configuration |
|---|---|---|
| ConnectCheckIntervalDelay | 0 |
|
| NoOfFragmentLogParts | 6 |
|
| MaxNoOfExecutionThreads | 14 |
|
| FragmentLogFileSize | 128M |
|
| NoOfFragmentLogFiles | 96 |
|
| binlogthreadstore.capacity | 5 |
|
| ndb_allow_copying_alter_table | 1 |
|
| binlog_cache_size | 10485760 |
|
| maxnumberofconcurrentscans | 495 |
|
| db_eventbuffer_max_alloc | 12G |
|
| HeartbeatIntervalDbDb | 1250 |
|
Policy Microservices Resources
Note:
Changes in the resource requirements are highlighted in bold.Table 3-121 Policy microservices resource allocation for site1
| Service Name | CPU Resource per Container (Limit) | CPU Resource per Container (Request) | Memory Resource per Container (Limit) | Memory Resource per Container (Request) | Replica Count | Request/Limit Istio CPU | Request/Limit Istio Memory (Gi) |
|---|---|---|---|---|---|---|---|
| Appinfo | 1 | 1 | 1 Gi | 512Mi | 2 | 2 | 2 Gi |
| Audit Service | 2 | 2 | 4 Gi | 4 Gi | 2 | 2 | 2 Gi |
| CM Service | 4 | 4 | 2 Gi | 2 Gi | 2 | 2 | 2 Gi |
| Config Service | 2 | 2 | 2Gi | 2Gi | 2 | 2 | 2 Gi |
| Egress Gateway | 27 | 27 | 6Gi | 6Gi | 27 | 4 | 2 Gi |
| Ingress Gateway | 8 | 8 | 6Gi | 6Gi | 8 | 2.5 | 2 Gi |
| NRF Client NF Discovry | 9 | 9 | 10Gi | 10Gi | 9 | 2 | 2 Gi |
| NRF Client Management | 2 | 2 | 1Gi | 1Gi | 2 | 2 | 2 Gi |
| AM Service | 12 | 12 | 8Gi | 8Gi | 12 | 3 | 2 Gi |
| UE Service | 20 | 20 | 6Gi | 6Gi | 20 | 2 | 1 Gi |
| Query Service | 2 | 2 | 1Gi | 1Gi | 2 | ||
| Performance | 1 | 1 | 1Gi | 512Mi | 2 | 2 | 1 Gi |
| PRE | 7 | 7 | 4Gi | 4Gi | 7 | 1.5 | 2 Gi |
| SM Service | 1 | 1 | 1Gi | 1Gi | 1 | 3 | 2 Gi |
| PDS | 24 | 24 | 8Gi | 8Gi | 24 | 3 | 4 Gi |
| UDR Connector | 20 | 20 | 4Gi | 4Gi | 20 | 2 | 2 Gi |
| CHF Connector/ User Service | 8 | 8 | 4Gi | 4Gi | 8 | 2 | 2 Gi |
| Alternate Route Service | 1 | 1 | 4Gi | 2Gi | 1 | 2 | 2 Gi |
| Bulwark Service | 8 | 8 | 4Gi | 4Gi | 7 | 3 | 4 Gi |
Table 3-122 CnDBTier resource allocation on Site-2
| Service Name | CPU Resource per Container (Limit) | CPU Resource per Container (Request) | Memory Resource per Container (Limit) | Memory Resource per Container (Request) | Replica Count | Request/Limit Istio CPU | Request/Limit Istio Memory |
|---|---|---|---|---|---|---|---|
| ndbappmysqld | 12 | 12 | 20Gi | 20Gi | 12 | 5 | 5Gi |
| ndbmgmd | 2 | 2 | 8Gi | 8Gi | 2 | 3 | 1Gi |
| ndbmtd | 10 | 10 | 129Gi | 129Gi | 10 | 6 | 6Gi |
| ndbmysqld | 6 | 6 | 16Gi | 16Gi | 6 | 5 | 5Gi |
3.2.7.2 CPU Utilization
This section lists the CPU utilization for Policy and cnDBTier microservices. The CPU utilization is the ratio between the (total CPU utilization against total CPU request (X)) versus (target CPU Utilization (Y) configured for the pod).
Policy Microservices Resource Utilization
The following table describes the bench mark number as per the system maximum capacity utilization for Policy microservices.
The average CPU utilization is the ratio between the current usage of resource to the requested resources of the pod i.e., total sum of CPU utilized for service pods / total CPU requested for service pods.
Table 3-123 Utilization by Policy Microservices
| Service | CPU (X/Y) - Site1 |
|---|---|
| ocpcf-occnp-alternate route | 0%/80% |
| ocpcf-appinfo | 1%/80% |
| ocpcf-bulwark | 46%/60% |
| ocpcf-config-server | 12%/80% |
| ocpcf-ingress-gateway | 48%/80% |
| ocpcf-egress-gateway | 45%/80% |
| ocpcf-nrf-client-nfdiscovery | 31%/80% |
| ocpcf-nrf-client-nfmanagament | 0%/80% |
| ocpcf-occnp-chf-connector | 17%/50% |
| ocpcf-occnp-udr-connector | 35%/50% |
| ocpcf-occpm-audit-service | 0%/60% |
| ocpcf-occpm-policyds | 43%/60% |
| ocpcf-amservice | 26%/30% |
| ocpcf-pcf-pre | 26%/80% |
| ocpcf-pcf-smservice | 0%/50% |
| ocpcf-pcf-ueservice | 58%/30% |
| ocpcf-ocpm-queryservice | 0%/80% |
Observed CPU utilization Values of cnDBTier Services
The following table provides information about observed values of cnDBTier services.
Table 3-124 Utilization by CnDBTier services
| App/Container | CPU (X/Y) - Site2 |
|---|---|
| ndbappmysqld | 31%/80% |
| ndbmgmd | 0%/80% |
| ndbmtd | 58%/80% |
| mdbmysqld | 5%/80% |
3.2.8 Test Scenario: PCF SM Call Model on Two-Site GeoRedundant setup, with Single-Site Handling 43K TPS traffic and ASM Enabled
This test run benchmarks the performance and capacity of Policy PCF SM call model that is deployed in PCF mode on a two-site georedundant setup. The PCF application handles a total traffic (Ingress + Egress) of 43K TPS on one site and there is no traffic on the other site
In this test setup, the Georedundant (GR) mode was enabled in cnDBTier. It was configured for multi channel replication.
3.2.8.1 Test Case and Setup Details
Table 3-126 Testcase Parameters
| Parameters | Values |
|---|---|
| Call Rate (Ingress + Egress) | 43k on site-1 and no traffic on site-2 |
| ASM | Enable |
| Traffic Ratio |
Internet : SM 1-Create 15-update 1-delete IMS: SM 1-Create 8-update 1-delete Application: SM 1-Create 0-update 1-delete Administrator: SM 1-Create 0-update 1-delete |
| Active User Count | 10000000 |
Project Details
The Policy Design editor based on the Blockly interface was used to set the Policy project for each of the Policy services. The complexity level of Policy Project configured for this run was High.
Complexity Level Definition:
- Low – No usage of loops in Blockly logic, no JSON operations, and no complex Java Script code in object expression/statement expression.
- Medium – Usage of loops in Blockly logic, Policy table wildcard match <= 3 fields, MatchList < 3, and 3 < RegEx match < 6
- High – JSON Operations – Custom, complex Java script code in object Expression/statement expression, Policy table wildcard match > 3 fields, MatchLists >= 3, and RegEx mat >= 6
Table 3-127 Call Model
| TPS | Site 1 | Site2 |
|---|---|---|
| SM-IGW | 20722.23 | 0 |
| SM-EGW | 16676.15 | 0 |
| SM-DIAM-IGW | 3315.61 | 0 |
| SM-DIAM-EGW | 2492.63 | 0 |
| Total SM | 43206 | 0 |
Table 3-128 Policy microservices configuration
| Name | Status |
|---|---|
| Bulwark | Enabled |
| Binding | Disabled |
| Subscriber State Variable (SSV) | Dnabled |
| Validate_user | Disabled |
| Alternate Route | Disabled |
| Audit | Enabled |
| Compression (Binding & SM Service) | Enabled |
| SYSTEM.COLLISION.DETECTION | Enabled |
Table 3-129 Policy interfaces
| Feature Name | Status |
|---|---|
| N36 UDR query (N7/N15-Nudr) | Enable |
| N36 UDR subscription (N7/N15-Nudr) | Enable |
| UDR on-demand nrf discovery | Disable |
| CHF (SM-Nchf) | Enable |
| BSF (N7-Nbsf) | Enable |
| AMF on demand nrf discovery | NA |
| LDAP (Gx-LDAP) | NA |
| Subscriber HTTP Notifier (Gx) | NA |
Table 3-130 PCRF interfaces
| Feature Name | Status |
|---|---|
| Sy (PCRF Gx-Sy) | NA |
| Sd (Gx-Sd) | NA |
| Gx UDR query (Gx-Nudr) | NA |
| Gx UDR subscription (Gx-Nudr | NA |
| CHF enabled (AM) | NA |
| Usage Monitoring (Gx) | NA |
| Subscriber HTTP Notifier (Gx) | NA |
Policy Microservices Resources
Table 3-131 Policy microservices resource allocation for site1
| Service Name | CPU Resource per Container (Limit) | CPU Resource per Container (Request) | Memory Resource per Container (Limit) | Memory Resource per Container (Request) | Replica Count | Request/Limit Istio CPU | Request/Limit Istio Memory (Gi) |
|---|---|---|---|---|---|---|---|
| Appinfo | 2 | 2 | 1 Gi | 512Mi | 2 | 2 | 2Gi |
| Bulwark | 8 | 8 | 6Gi | 2Gi | 15 | 2500m | 2500m |
| Binding | 6 | 6 | 8Gi | 8Gi | 11 | 2500m | 2500m |
| Diameter Connector | 4 | 4 | 2Gi | 1Gi | 6 | 2 | 2Gi |
| Alternate Route | 2 | 2 | 4Gi | 2Gi | 2 | 2 | 2Gi |
| CHF Connector | 6 | 6 | 4Gi | 4Gi | 4 | 2 | 2Gi |
| Config Server | 4 | 4 | 2Gi | 512Mi | 2 | 2 | 2Gi |
| Egress Gateway | 8 | 8 | 6Gi | 6Gi | 9 | 4 | 2Gi |
| Ingress Gateway | 5 | 5 | 6Gi | 6Gi | 29 | 2500m | 2Gi |
| Diameter Gateway | 4 | 4 | 2Gi | 1Gi | 4 | 2 | 2Gi |
| NRF Client NF Discovery | 4 | 4 | 2Gi | 2Gi | 4 | 2 | 2Gi |
| NRF Client Management | 1 | 1 | 1Gi | 1Gi | 2 | 2 | 2Gi |
| UDR Connector | 6 | 6 | 4Gi | 4Gi | 8 | 2 | 2Gi |
| Audit | 2 | 2 | 4Gi | 4Gi | 2 | 2 | 2Gi |
| CM Service | 4 | 2 | 2Gi | 512Mi | 2 | 2 | 2Gi |
| PolicyDS | 7 | 7 | 8Gi | 8Gi | 30 | 2500m | 4Gi |
| PRE Service | 4 | 4 | 4Gi | 4Gi | 39 | 1500m | 2Gi |
| Query Service | 2 | 1 | 1Gi | 1Gi | 2 | 2 | 2Gi |
| SM Service | 7 | 7 | 10Gi | 10Gi | 64 | 2500m | 2Gi |
| Performance | 2 | 1 | 1Gi | 512Mi | NA | NA | NA |
Table 3-132 CnDBTier resource allocation for site2
| Service Name | CPU Resource per Container (Limit) | CPU Resource per Container (Request) | Memory Resource per Container (Limit) | Memory Resource per Container (Request) | Replica Count | Request/Limit Istio CPU | Request/Limit Istio Memory |
|---|---|---|---|---|---|---|---|
| ndbappmysqld | 12 | 12 | 18Gi | 18Gi | 18 | 5000m | 4Gi |
| ndbmgmd | 3 | 3 | 8Gi | 8Gi | 2 | 3000m | 1Gi |
| ndbmtd | 10 | 10 | 132Gi | 132Gi | 10 | 5000m | 4Gi |
| ndbmysqld | 4 | 4 | 154Gi | 12 | 5000m | 4Gi |
3.2.8.2 CPU and Memory Utilization
Table 3-133 Policy Microservices Resource Utilization
| Services | CPU - Site1 | Memory - Site1 |
|---|---|---|
| appinfo | ['0.100 (2.50%)'] | ['0.520 (25.98%)'] |
| bulwark | ['20.899 (17.42%)'] | ['19.323 (21.47%)'] |
| binding | ['7.875 (11.93%)'] | ['34.009 (38.65%)'] |
| diam-connector | ['3.362 (14.01%)'] | ['4.147 (34.56%)'] |
| occnp-alternate-route | ['0.004 (0.10%)'] | ['0.719 (8.98%)'] |
| user-service | ['2.902 (12.09%)'] | ['3.445 (21.53%)'] |
| config-server | ['0.582 (7.27%)'] | ['1.800 (45.00%)'] |
| occnp-egress-gateway | ['13.399 (18.61%)'] | ['12.664 (23.45%)'] |
| occnp-ingress-gateway | ['23.737 (16.37%)'] | ['60.212 (34.60%)'] |
| nrf-client-nfdiscovery | ['1.493 (9.33%)'] | ['5.118 (63.98%)'] |
| nrf-client-nfmanagement | ['0.008 (0.40%)'] | ['0.994 (49.71%)'] |
| user-service | ['6.971 (14.52%)'] | ['9.528 (29.78%)'] |
| audit-service | ['0.010 (0.25%)'] | ['0.996 (12.45%)'] |
| cm-service | ['0.061 (0.76%)'] | ['1.662 (41.55%)'] |
| policyds | ['44.964 (21.41%)'] | ['100.335 (41.81%)'] |
| pre-service | ['34.096 (21.86%)'] | ['75.009 (48.08%)'] |
| queryservice | ['0.002 (0.05%)'] | ['0.486 (24.32%)'] |
| sm-service | ['96.699 (21.58%)'] | ['309.705 (48.39%)'] |
| perf-info | ['0.481 (24.05%)'] | ['0.279 (13.96%)'] |
| diam-gateway | ['1.579 (9.87%)'] | ['3.539 (44.24%)'] |
Table 3-134 cnDBTier Services Resource Utilization
| Services | CPU - Site1 | Memory - Site1 |
|---|---|---|
| ndbappmysqld | ['52.806 (24.45%)'] | ['154.933 (47.82%)'] |
| ndbmgmd | ['0.013 (0.22%)'] | ['4.058 (25.36%)'] |
| ndbmtd | ['53.643 (53.64%)'] | ['767.512 (58.14%)'] |
| ndbmysqld | ['2.729 (5.69%)'] | ['101.743 (5.51%)'] |
3.3 Policy Call Model 3
3.3.1 Test Scenario: Policy Voice Call Model on Four-Site Georedundant Setup, with 7.5K TPS Traffic on Each Site and ASM Disabled
This test run benchmarks the performance and capacity of Policy voice call model that is deployed in converged mode on a four-site georedundant setup. Each of the sites handles a traffic of 7.5K TPS at Diameter Gateway. For this setup, Policy Event Record (PER) and Binding feature were enabled and Aspen Service Mesh (ASM) was disabled. This setup has single-channel replication.
3.3.1.1 Test Case and Setup Details
Test Case Parmeters
The following table describes the testcase parameters and their values:
| Parameters | Values |
|---|---|
| Call Rate (Diameter Gateway) | 30K TPS (7.5KTPS on four site) |
| ASM | Disable |
| Traffic Ratio | CCRI-I, AARI –1, CCRU-2, AARU - 1, RAR-Gx-1, RAR-Rx-1, STR –1, CCRT-1. |
| Active Subscribers | 10000000 |
Project Details
The Policy Design editor based on the Blockly interface was used to set the Policy project for each of the Policy services. The complexity level of Policy Project configured for this run was High.
Complexity Level Definition:
- Low – No usage of loops in Blockly logic, no JSON operations, and no complex Java Script code in object expression/statement expression.
- Medium – Usage of loops in Blockly logic, Policy table wildcard match <= 3 fields, MatchList < 3, and 3 < RegEx match < 6
- High – JSON Operations – Custom, complex Java script code in object Expression/statement expression, Policy table wildcard match > 3 fields, MatchLists >= 3, and RegEx mat >= 6
Call Model Data
| Service Name | TPS |
|---|---|
| Ingress Service | NA |
| Egress Service | NA |
| Diameter Gateway | 7.5K TPS |
| Diameter Connector | NA |
| SM service | NA |
| PDS Service | NA |
| PRE Service | NA |
| NRF Discovery | NA |
| UDR Connector | NA |
| CHF Connector | NA |
| Binding Service | NA |
| Bulwark Service | NA |
Policy Configurations
Following PCF configurations were either enabled or disabled for running this call flow:
Table 3-136 Policy Configurations
| Service Name | Status |
|---|---|
| Binding | Enabled |
| PRE | Enabled |
| SAL | Enabled |
| LDAP | Disabled |
| OCS | Disabled |
| Audit | Enabled |
| Replication | Enabled |
| Bulwark | Disabled |
| Alternate routing | Disabled |
Following Policy Interfaces were either enabled or disabled for running this call flow:
Table 3-137 Policy Interfaces
| Feature Name | Status |
|---|---|
| AMF on demand nrf discovery | NA |
| BSF (N7-Nbsf) | NA |
| CHF (SM-Nchf) | NA |
| LDAP (Gx-LDAP) | NA |
| N36 UDR query (N7/N15-Nudr) | NA |
| N36 UDR subscription (N7/N15-Nudr) | NA |
| Sy (PCF N7-Sy) | NA |
| UDR on-demand nrf discovery | NA |
Following PCRF interfaces were either enabled or disabled for running this call flow:
Table 3-138 PCRF Interfaces
| Feature Name | Status |
|---|---|
| Sy (PCRF Gx-Sy) | NA |
| Sd (Gx-Sd) | NA |
| Gx UDR query (Gx-Nudr) | NA |
| Gx UDR subscription (Gx-Nudr) | NA |
| CHF enabled (AM) | NA |
| Usage Monitoring (Gx) | NA |
| Subscriber HTTP Notifier (Gx) | NA |
Configuring Policy Helm Parameters
There are no optimization parameters configured for this run.
Configuring cnDbTier Helm Parameters
There are no optimization parameters configured for this run.
Policy Microservices Resources
Table 3-139 Policy microservices Resource allocation
| Service Name | CPU Request Per Pod | CPU Limit Per Pod | Memory Request Per Pod (Gi) | Memory Limit Per Pod (Gi) | Replicas |
|---|---|---|---|---|---|
| Appinfo | 1 | 2 | 1 | 2 | 1 |
| Audit Service | 1 | 2 | 1 | 1 | 1 |
| CM Service | 2 | 4 | 0.5 | 2 | 1 |
| Config Service | 2 | 4 | 0.5 | 2 | 1 |
| Egress Gateway | 5 | 5 | 6 | 6 | 2 |
| Ingress Gateway | 3 | 4 | 4 | 6 | 2 |
| Nrf Client Management | 1 | 1 | 1 | 1 | 2 |
| Diameter Gateway | 3 | 4 | 1 | 2 | 9 |
| Diameter Connector | 3 | 4 | 1 | 2 | 5 |
| Nrf Client Discovery | 3 | 4 | 0.5 | 2 | 2 |
| Query Service | 1 | 2 | 1 | 1 | 1 |
| PCRF Core Service | 7 | 8 | 8 | 8 | 24 |
| Performance | 1 | 1 | 0.5 | 1 | 2 |
| PRE Service | 4 | 4 | 0.5 | 4 | 15 |
| SM Service | 7 | 7 | 10 | 10 | 2 |
| PDS | 7 | 7 | 8 | 8 | 5 |
| Binding Service | 5 | 6 | 1 | 8 | 18 |
Table 3-140 cnDBTier services resource allocation
| Service Name | CPU Request Per Pod | CPU Limit Per Pod | Memory Request Per Pod (Gi) | Memory Limit Per Pod (Gi) | Replicas | Storage |
|---|---|---|---|---|---|---|
| ndbappmysqld | 8 | 8 | 19 | 20 | 5 | 32Gi |
| ndbmgmd | 2 | 2 | 9 | 11 | 2 | 16Gi |
| ndbmtd | 8 | 8 | 73 | 83 | 8 | 76Gi |
| ndbmysqld | 4 | 4 | 25 | 25 | 6 | 131Gi |
Note: Min Replica = Max Replica
3.3.1.2 CPU Utilization
This section lists the CPU utilization for Policy and cnDBTier microservices. The CPU utilization is the ratio between the (total CPU utilization against total CPU request (X)) versus (target CPU Utilization (Y) configured for the pod).
Policy Microservices Resource Utilization
The following table describes the bench mark number as per the system maximum capacity utilization for Policy microservices.
The average CPU utilization is the ratio between the current usage of resource to the requested resources of the pod i.e., total sum of CPU utilized for service pods / total CPU requested for service pods.
Table 3-141 CPU/Memory Utilization by Policy Microservices
| Service Name | Site 1 CPU (X/Y) | Site 2 CPU (X/Y) | Site 3 CPU (X/Y) | Site 4 CPU (X/Y) |
|---|---|---|---|---|
| ocpcf-appinfo-hpa-v2 | 3%/80% | 3%/80% | 3%/80% | 3%/80% |
| ocpcf-config-server-hpa-v2 | 8%/80% | 9%/80% | 7%/80% | 7%/80% |
| ocpcf-diam-connector-hpa | 0%/40% | 0%/40% | 0%/40% | 0%/40% |
| ocpcf-egress-gateway-v2 | 0%/80% | 0%/80% | 0%/80% | 0%/80% |
| ocpcf-ingress-gateway-v2 | 0%/80% | 0%/80% | 0%/80% | 0%/80% |
| ocpcf-nrf-client-nfdiscovery-v2 | 0%/80% | 0%/80% | 0%/80% | 0%/80% |
| ocpcf-nrf-client-nfmanagement-v2 | 0%/80% | 0%/80% | 0%/80% | 0%/80% |
| ocpcf-oc-binding-hpa | 6%/60% | 6%/60% | 6%/60% | 6%/60% |
| ocpcf-ocpm-audit-service-hpa-v2 | 4%/60% | 1%/60% | 1%/60% | 1%/60% |
| ocpcf-ocpm-policyds-hpa | 0%/60% | 0%/60% | 0%/60% | 0%/60% |
| ocpcf-pcf-pre-hpa | 17%/80% | 18%/80% | 17%/80% | 17%/80% |
| ocpcf-pcrf-core-hpa | 12%/40% | 12%/40% | 12%/40% | 12%/40% |
| ocpcf-query-service-hpa | 0%/80% | 0%/80% | 0%/80% | 0%/80% |
Observed CPU utilization Values of cnDBTier Services
The following table provides information about observed values of cnDBTier services.
Table 3-142 CPU/Memory Utilization by CnDBTier services
| Service Name | Site1 - CPU (X/Y) | Site2 - CPU (X/Y) | Site3 - CPU (X/Y) | Site4 - CPU (X/Y) |
|---|---|---|---|---|
| ndbappmysqld | 88%/80% | 87%/80% | 89%/80% | 88%/80% |
| ndbmgmd | 0%/80% | 0%/80% | 0%/80% | 0%/80% |
| ndbmtd | 16%/80% | 17%/80% | 17%/80% | 18%/80% |
| ndbmysqld | 8%/80% | 9%/80% | 10%/80% | 8%/80% |
3.3.2 Test Scenario: Policy Voice Call Model on Four-Site Georedundant Setup, with 15K TPS Traffic on Two Sites and No Traffic on Other Two Sites
This test run benchmarks the performance and capacity of Policy voice call model that is deployed in converged mode on a four-site georedundant setup. Two of the sites (site1 and site3) handle a traffic of 15K TPS at Diameter Gateway and there is no traffic on the other two sites (site2 and site4). For this setup, Binding and Policy Event Record (PER) features were enabled and Aspen Service Mesh (ASM) was disabled. This setup has single-channel replication.
3.3.2.1 Test Case and Setup Details
Testcase Parameters
The following table describes the testcase parameters and their values:
| Parameters | Values |
|---|---|
| Call Rate (Diameter Gateway) | 30KTPS (15KTPS on two sites) |
| ASM | Disable |
| Traffic Ratio | CCRI-I, AARI –1, CCRU-2, AARU - 1, RAR-Gx-1, RAR-Rx-1, STR –1, CCRT-1. |
| Active Subscribers | 10000000 |
Project Details
The Policy Design editor based on the Blockly interface was used to set the Policy project for each of the Policy services. The complexity level of Policy Project configured for this run was High.
Complexity Level Definition:
- Low – No usage of loops in Blockly logic, no JSON operations, and no complex Java Script code in object expression/statement expression.
- Medium – Usage of loops in Blockly logic, Policy table wildcard match <= 3 fields, MatchList < 3, and 3 < RegEx match < 6
- High – JSON Operations – Custom, complex Java script code in object Expression/statement expression, Policy table wildcard match > 3 fields, MatchLists >= 3, and RegEx mat >= 6
Call Model Data
| Services | TPS |
|---|---|
| Ingress Service | NA |
| Egress Service | NA |
| Diameter Gateway | 15K TPS |
| Diameter Connector | NA |
| SM service | NA |
| PDS Service | NA |
| PRE Service | NA |
| NRF Discovery | NA |
| UDR Connector | NA |
| CHF Connector | NA |
| Binding Service | NA |
| Bulwark Service | NA |
Policy Configurations
Following Policy configurations were either enabled or disabled for running this call flow:
Table 3-144 Policy Microservices Configuration
| Service Name | Status |
|---|---|
| Binding | Enabled |
| PER | Enabled |
| SAL | Enabled |
| LDAP | Disabled |
| OCS | Disabled |
| Audit | Enabled |
| Replication | Enabled |
| Bulkwark | Disabled |
| Alternate routing | Disabled |
Following Policy interfaces were either enabled or disabled for running this call flow:
Table 3-145 Policy Interfaces
| Feature Name | Status |
|---|---|
| N36 UDR query (N7/N15-Nudr) | NA |
| N36 UDR subscription (N7/N15-Nudr) | NA |
| UDR on-demand nrf discovery | NA |
| CHF (SM-Nchf) | NA |
| BSF (N7-Nbsf) | NA |
| AMF on demand nrf discovery | NA |
| LDAP (Gx-LDAP) | NA |
| Sy (PCF N7-Sy) | NA |
Following PCRF interfaces were either enabled or disabled for running this call flow:
Table 3-146 PCRF Interfaces
| Feature Name | Status |
|---|---|
| Sy (PCRF Gx-Sy) | NA |
| Sd (Gx-Sd) | NA |
| Gx UDR query (Gx-Nudr) | NA |
| Gx UDR subscription (Gx-Nudr) | NA |
| CHF enabled (AM) | NA |
| Usage Monitoring (Gx) | NA |
| Subscriber HTTP Notifier (Gx) | NA |
Configuring Policy Helm Parameters
There were no optimized parameters configured for this run.
Configuring cnDbTier Helm Parameters
There were no optimized parameters configured for this run.
Policy Microservices Resources
Table 3-147 Policy microservices resource allocation
| Service Name | CPU Request Per Pod | CPU Limit Per Pod | Memory Request Per Pod (Gi) | Memory Limit Per Pod (Gi) | Replicas |
|---|---|---|---|---|---|
| Appinfo | 1 | 1 | 0.5 | 1 | 1 |
| Audit Service | 1 | 2 | 1 | 1 | 1 |
| CM Service | 2 | 4 | 0.5 | 2 | 1 |
| Config Service | 2 | 4 | 0.5 | 2 | 1 |
| Egress Gateway | 3 | 4 | 4 | 6 | 2 |
| Ingress Gateway | 3 | 4 | 4 | 6 | 2 |
| Nrf Client Management | 1 | 1 | 1 | 1 | 2 |
| Diameter Gateway | 3 | 4 | 1 | 2 | 9 |
| Diameter Connector | 3 | 4 | 1 | 2 | 5 |
| Nrf Client Discovery | 3 | 4 | 0.5 | 2 | 2 |
| Query Service | 1 | 2 | 1 | 1 | 1 |
| PCRF Core Service | 7 | 8 | 8 | 8 | 24 |
| Performance | 1 | 1 | 0.5 | 1 | 2 |
| PRE Service | 5 | 5 | 0.5 | 4 | 15 |
| SM Service | 7 | 8 | 1 | 4 | 2 |
| PDS | 5 | 6 | 1 | 4 | 5 |
| Binding Service | 5 | 6 | 1 | 8 | 18 |
Table 3-148 cnDBTier services resource allocation
| Service Name | CPU Request Per Pod | CPU Limit Per Pod | Memory Request Per Pod (Gi) | Memory Limit Per Pod (Gi) | Replicas | Storage |
|---|---|---|---|---|---|---|
| ndbappmysqld | 8 | 8 | 19 | 20 | 5 | 32Gi |
| ndbmgmd | 2 | 2 | 9 | 11 | 2 | 16Gi |
| ndbmtd | 8 | 8 | 73 | 83 | 8 | 76Gi |
| ndbmysqld | 4 | 4 | 25 | 25 | 6 | 131Gi |
Min Replica = Max Replica
3.3.2.2 CPU Utilization
This section lists the CPU utilization for Policy and cnDBTier microservices. The CPU utilization is the ratio between the (total CPU utilization against total CPU request (X)) versus (target CPU Utilization (Y) configured for the pod).
Policy Microservices Resource Utilization
The following table describes the bench mark number as per the system maximum capacity utilization for Policy microservices.
The average CPU utilization is the ratio between the current usage of resource to the requested resources of the pod i.e., total sum of CPU utilized for service pods / total CPU requested for service pods.
Table 3-149 CPU/Memory Utilization by Policy Microservices
| Service Name | Site1 - CPU (X/Y) | Site2 - CPU (X/Y) | Site3 - CPU (X/Y) | Site4 - CPU (X/Y) |
|---|---|---|---|---|
| ocpcf-appinfo-hpa-v2beta1 | 2%/80% | 2%/80% | 3%/80% | 2%/80% |
| ocpcf-config-server-hpa-v2beta1 | 7%/80% | 9%/80% | 9%/80% | 8%/80% |
| ocpcf-diam-connector-hpa-v2beta1 | 0%/40% | 0%/40% | 0%/40% | 0%/40% |
| ocpcf-egress-gateway-v2beta1 | 0%/80% | 0%/80% | 0%/80% | 0%/80% |
| ocpcf-ingress-gateway-v2beta1 | 1%/80% | 0%/80% | 1%/80% | 0%/80% |
| ocpcf-nrf-client-nfdiscovery-v2 | 0%/80% | 0%/80% | 0%/80% | 0%/80% |
| ocpcf-nrf-client-nfmanagement-v2 | 0%/80% | 0%/80% | 0%/80% | 0%/80% |
| ocpcf-oc-binding-hpa | 11%/60% | 0%/60% | 11%/60% | 0%/60% |
| ocpcf-ocpm-audit-service-hpa-v2beta1 | 0%/60% | 0%/60% | 0%/60% | 0%/60% |
| ocpcf-ocpm-policyds-hpa | 0%/60% | 0%/60% | 0%/60% | 0%/60% |
| ocpcf-pcf-pre-hpa | 10%/80% | 0%/80% | 10%/80% | 0%/80% |
| ocpcf-pcf-smservice-hpa | 0%/50% | 0%/50% | 0%/50% | 0%/50% |
| ocpcf-pcrf-core-hpa | 25%/40% | 0%/80% | 24%/40% | 0%/40% |
| ocpcf-query-service-hpa | 0%/80% | 0%/40% | 0%/80% | 0%/80% |
Observed CPU utilization Values of cnDBTier Services
The following table provides information about observed values of cnDBTier services.
Table 3-150 CPU/Memory Utilization by CnDBTier services
| Service Name | Site1 - CPU (X/Y) | Site2 - CPU (X/Y) | Site3 - CPU (X/Y) | Site4 - CPU (X/Y) |
|---|---|---|---|---|
| ndbappmysqld | 73%/80% | 23%/80% | 89%/80% | 23%/80% |
| ndbmgmd | 0%/80% | 0%/80% | 0%/80% | 0%/80% |
| ndbmtd | 22530%/80% | 7280%/80% | 16%/80% | 7%/80% |
| ndbmysqld | 8%/80% | 4%/80% | 8%/80% | 4%/80% |
3.4 Policy Call Model 4
3.4.1 Test Scenario: Policy Call Model on Four-Site Georedundant Setup, with 7.5K TPS Traffic on Each Site and ASM Disabled
This test run benchmarks the performance and capacity of Policy data call model that is deployed in converged mode on a four-site georedundant setup. Each of the sites handles a traffic of 7.5K TPS at Diameter Gateway. For this setup, Binding feature was enabled and Aspen Service Mesh (ASM) was disabled. This setup has single-channel replication.
3.4.1.1 Test Case and Setup Details
Testcase Parameters
The following table describes the testcase parameters and their values:
| Parameters | Values |
| Call Rate (Diameter Gateway) | 30KTPS (7.5KTPS on each site) |
| ASM | Disable |
| Traffic Ratio | CCRI (Single APN), CCRU (Single APN), CCRT (Single APN), AARU, RAR -rx, RAR-gx, STR. |
| Active Subscribers | 10000000 |
Project Details
The Policy Design editor based on the Blockly interface was used to set the Policy project for each of the Policy services. The complexity level of Policy Project configured for this run was High.
Complexity Level Definition:
- Low – No usage of loops in Blockly logic, no JSON operations, and no complex Java Script code in object expression/statement expression.
- Medium – Usage of loops in Blockly logic, Policy table wildcard match <= 3 fields, MatchList < 3, and 3 < RegEx match < 6
- High – JSON Operations – Custom, complex Java script code in object Expression/statement expression, Policy table wildcard match > 3 fields, MatchLists >= 3, and RegEx mat >= 6
Call Model Data
Table 3-152 Traffic distribution
| Service Name | TPS |
|---|---|
| Ingress Service | NA |
| Egress Service | NA |
| Diameter Gateway | 7.5K TPS |
| Diameter Connector | NA |
| SM service | NA |
| PDS Service | NA |
| PRE Service | NA |
| NRF Discovery | NA |
| UDR Connector | NA |
| CHF Connector | NA |
| Binding Service | NA |
| Bulwark Service | NA |
Policy Configurations
Following Policy services were either enabled or disabled for running this call flow:
Table 3-153 Policy services configuration
| Service Name | Status |
|---|---|
| Binding | Enabled |
| PER | Disabled |
| SAL | Enabled |
| LDAP | Disabled |
| OCS | Disabled |
| Audit | Enabled |
| Replication | Enabled |
| Bulkwark | Disabled |
| Alternate routing | Disabled |
Following Policy interfaces were either enabled or disabled for running this call flow:
Table 3-154 Policy interfaces
| Feature Name | Status |
|---|---|
| N36 UDR query (N7/N15-Nudr) | NA |
| N36 UDR subscription (N7/N15-Nudr) | NA |
| UDR on-demand nrf discovery | NA |
| CHF (SM-Nchf) | NA |
| BSF (N7-Nbsf) | NA |
| AMF on demand nrf discovery | NA |
| LDAP (Gx-LDAP) | NA |
| Sy (PCF N7-Sy) | NA |
| Diameter GW (PGW to PCRF) | Active |
Following PCRF interfaces were either enabled or disabled for running this call flow:
Table 3-155 PCRF intefaces
| Feature Name | Status |
|---|---|
| Sy (PCRF Gx-Sy) | NA |
| Sd (Gx-Sd) | NA |
| Gx UDR query (Gx-Nudr) | NA |
| Gx UDR subscription (Gx-Nudr) | NA |
| CHF enabled (AM) | NA |
| Usage Monitoring (Gx) | NA |
| Subscriber HTTP Notifier (Gx) | NA |
Configuring PCF Helm Parameters
There were no optimization parameters configured for this run.
Configuring cnDbTier Helm Parameters
There were no optimization parameters configured for this run.
Policy Microservices Resources
Table 3-156 Policy microservices resource allocation
| Service Name | CPU Request Per Pod | CPU Limit Per Pod | Memory Request Per Pod (Gi) | Memory Limit Per Pod (Gi) | Replicas |
|---|---|---|---|---|---|
| Appinfo | 1 | 1 | 0.5 | 1 | 1 |
| Audit Service | 1 | 2 | 1 | 1 | 1 |
| CM Service | 2 | 4 | 0.5 | 2 | 1 |
| Config Service | 2 | 4 | 0.5 | 2 | 1 |
| Egress Gateway | 3 | 4 | 4 | 6 | 2 |
| Ingress Gateway | 3 | 4 | 4 | 6 | 2 |
| Nrf Client Management | 1 | 1 | 1 | 1 | 2 |
| Diameter Gateway | 3 | 4 | 1 | 2 | 9 |
| Diameter Connector | 3 | 4 | 1 | 2 | 5 |
| Nrf Client Discovery | 3 | 4 | 0.5 | 2 | 2 |
| Query Service | 1 | 2 | 1 | 1 | 1 |
| PCRF Core Service | 7 | 8 | 8 | 8 | 24 |
| Performance | 1 | 1 | 0.5 | 1 | 2 |
| PRE Service | 5 | 5 | 0.5 | 4 | 15 |
| SM Service | 7 | 8 | 1 | 4 | 2 |
| PDS | 5 | 6 | 1 | 4 | 5 |
| Binding Service | 5 | 6 | 1 | 8 | 18 |
Table 3-157 cnDBTier services resource allocation
| Service Name | CPU Request Per Pod | CPU Limit Per Pod | Memory Request Per Pod (Gi) | Memory Limit Per Pod (Gi) | Replicas | Storage |
|---|---|---|---|---|---|---|
| ndbappmysqld | 8 | 8 | 19 | 20 | 5 | 32Gi |
| ndbmgmd | 2 | 2 | 9 | 11 | 2 | 16Gi |
| ndbmtd | 8 | 8 | 73 | 83 | 8 | 76Gi |
| ndbmysqld | 4 | 4 | 25 | 25 | 6 | 131Gi |
Min Replica = Max Replica
3.4.1.2 CPU Utilization
This section lists the CPU utilization for Policy and cnDBTier microservices. The CPU utilization is the ratio between the (total CPU utilization against total CPU request (X)) versus (target CPU Utilization (Y) configured for the pod).
Policy Microservices Resource Utilization
The following table describes the bench mark number as per the system maximum capacity utilization for Policy microservices.
The average CPU utilization is the ratio between the current usage of resource to the requested resources of the pod i.e., total sum of CPU utilized for service pods / total CPU requested for service pods.
Table 3-158 CPU/Memory Utilization by Policy Microservices
| Service Name | Site1 - CPU (X/Y) | Site2 - CPU (X/Y) | Site3 - CPU (X/Y) | Site4 - CPU (X/Y) |
|---|---|---|---|---|
| ocpcf-appinfo-hpa-v2beta1 | 1%/80% | 2%/80% | 2%/80% | 1%/80% |
| ocpcf-config-server-hpa-v2beta1 | 8%/80% | 9%/80% | 8%/80% | 7%/80% |
| ocpcf-diam-connector-hpa-v2beta1 | 0%/40% | 0%/40% | 0%/40% | 0%/40% |
| ocpcf-egress-gateway-v2beta1 | 0%/80% | 0%/80% | 0%/80% | 0%/80% |
| ocpcf-ingress-gateway-v2beta1 | 1%/80% | 1%/80% | 1%/80% | 1%/80% |
| ocpcf-nrf-client-nfdiscovery-v2 | 0%/80% | 0%/80% | 0%/80% | 0%/80% |
| ocpcf-nrf-client-nfmanagement-v2 | 0%/80% | 0%/80% | 0%/80% | 0%/80% |
| ocpcf-oc-binding-hpa | 6%/60% | 6%/60% | 6%/60% | 6%/60% |
| ocpcf-ocpm-audit-service-hpa-v2beta1 | 0%/60% | 0%/60% | 0%/60% | 0%/60% |
| ocpcf-ocpm-policyds-hpa | 0%/60% | 0%/60% | 0%/60% | 0%/60% |
| ocpcf-pcf-pre-hpa | 6%/80% | 6%/80% | 6%/80% | 6%/80% |
| ocpcf-pcf-smservice-hpa | 0%/50% | 0%/50% | 0%/50% | 0%/50% |
| ocpcf-pcrf-core-hpa | 13%/40% | 0%/80% | 14%/40% | 14%/40% |
| ocpcf-query-service-hpa | 0%/80% | 13%/40% | 0%/80% | 0%/80% |
Observed CPU utilization Values of cnDBTier Services
The following table provides information about observed values of cnDBTier services.
Table 3-159 CPU/Memory Utilization by CnDBTier services
| Service Name | Site1 - CPU (X/Y) | Site2 - CPU (X/Y) | Site3 - CPU (X/Y) | Site4 - CPU (X/Y) |
|---|---|---|---|---|
| ndbappmysqld | 71%/80% | 84%/80% | 84%/80% | 85%/80% |
| ndbmgmd | 0%/80% | 0%/80% | 0%/80% | 1%/80% |
| ndbmtd | 14%/80% | 11%/80% | 16%/80% | 15%/80% |
| ndbmysqld | 12%/80% | 12%/80% | 13%/80% | 12%/80% |
3.4.2 Test Scenario: Policy Call Model on Four-Site Georedundant Setup, with 15K TPS Traffic on Two Sites and No Traffic on Other Two Sites
This test run benchmarks the performance and capacity of Policy data call model that is deployed in converged mode on a four-site georedundant setup. Two of the sites (site1 and site3) handle a traffic of 15K TPS at Diameter Gateway and there is no traffic on the other two sites (site2 and site4). For this setup, Binding feature was enabled and Aspen Service Mesh (ASM) was disabled. This setup has single-channel replication.
3.4.2.1 Test Case and Setup Details
Testcase Parameters
The following table describes the testcase parameters and their values:
| Parameters | Values |
|---|---|
| Call Rate (Diameter Gateway) | 30KTPS (15 KTPS on two site) |
| ASM | Disable |
| Traffic Ratio | CCRI (Single APN), CCRU (Single APN), CCRT (Single APN), AARU, RAR -rx, RAR-gx, STR. |
| Active Subscribers | 10000000 |
Project Details
The Policy Design editor based on the Blockly interface was used to set the Policy project for each of the Policy services. The complexity level of Policy Project configured for this run was High.
Complexity Level Definition:
- Low – No usage of loops in Blockly logic, no JSON operations, and no complex Java Script code in object expression/statement expression.
- Medium – Usage of loops in Blockly logic, Policy table wildcard match <= 3 fields, MatchList < 3, and 3 < RegEx match < 6
- High – JSON Operations – Custom, complex Java script code in object Expression/statement expression, Policy table wildcard match > 3 fields, MatchLists >= 3, and RegEx mat >= 6
Call Model Data
Table 3-161 Traffic distribution
| Service Name | TPS |
|---|---|
| Ingress Service | NA |
| Egress Service | NA |
| Diameter Gateway | 15K TPS |
| Diameter Connector | NA |
| SM service | NA |
| PDS Service | NA |
| PRE Service | NA |
| NRF Discovery | NA |
| UDR Connector | NA |
| CHF Connector | NA |
| Binding Service | NA |
| Bulwark Service | NA |
Policy Configurations
Following Policy services were either enabled or disabled for running this call flow:
Table 3-162 Policy microservices configuration
| Service Name | Status |
|---|---|
| Binding | Enabled |
| PER | Disabled |
| SAL | Enabled |
| LDAP | Disabled |
| OCS | Disabled |
| Audit | Enabled |
| Replication | Enabled |
| Bulkwark | Disabled |
| Alternate routing | Disabled |
Following Policy interfaces were either enabled or disabled for running this call flow:
Table 3-163 Policy interfaces
| Feature Name | Status |
|---|---|
| N36 UDR query (N7/N15-Nudr) | NA |
| N36 UDR subscription (N7/N15-Nudr) | NA |
| UDR on-demand nrf discovery | NA |
| CHF (SM-Nchf) | NA |
| BSF (N7-Nbsf) | NA |
| AMF on demand nrf discovery | NA |
| LDAP (Gx-LDAP) | NA |
| Sy (PCF N7-Sy) | NA |
| Diameter (PGW to PCRF) | Active |
Following PCRF interfaces were either enabled or disabled for running this call flow:
Table 3-164 PCRF interfaces
| Feature Name | Status |
|---|---|
| Sy (PCRF Gx-Sy) | NA |
| Sd (Gx-Sd) | NA |
| Gx UDR query (Gx-Nudr) | NA |
| Gx UDR subscription (Gx-Nudr) | NA |
| CHF enabled (AM) | NA |
| Usage Monitoring (Gx) | NA |
| Subscriber HTTP Notifier (Gx) | NA |
| Diameter (PGW to PCRF) | Active |
Configuring cnDbTier Helm Parameters
There were no optimization parameters configured for this run.
Configuring cnDbTier Helm Parameters
There were no optimization parameters configured for this run.
Policy Microservices Resources
Table 3-165 Policy microservices resource allocation
| Service Name | CPU Request Per Pod | CPU Limit Per Pod | Memory Request Per Pod (Gi) | Memory Limit Per Pod (Gi) | Replicas |
|---|---|---|---|---|---|
| Appinfo | 1 | 1 | 0.5 | 1 | 1 |
| Audit Service | 1 | 2 | 1 | 1 | 1 |
| CM Service | 2 | 4 | 0.5 | 2 | 1 |
| Config Service | 2 | 4 | 0.5 | 2 | 1 |
| Egress Gateway | 3 | 4 | 4 | 6 | 2 |
| Ingress Gateway | 3 | 4 | 4 | 6 | 2 |
| Nrf Client Management | 1 | 1 | 1 | 1 | 2 |
| Diameter Gateway | 3 | 4 | 1 | 2 | 9 |
| Diameter Connector | 3 | 4 | 1 | 2 | 5 |
| Nrf Client Discovery | 3 | 4 | 0.5 | 2 | 2 |
| Query Service | 1 | 2 | 1 | 1 | 1 |
| PCRF Core Service | 7 | 8 | 8 | 8 | 24 |
| Performance | 1 | 1 | 0.5 | 1 | 2 |
| PRE Service | 5 | 5 | 0.5 | 4 | 15 |
| SM Service | 7 | 8 | 1 | 4 | 2 |
| PDS | 5 | 6 | 1 | 4 | 5 |
| Binding Service | 5 | 6 | 1 | 8 | 18 |
Table 3-166 cnDBTier services resource allocation
| Service Name | CPU Request Per Pod | CPU Limit Per Pod | Memory Request Per Pod (Gi) | Memory Limit Per Pod (Gi) | Replicas | Storage |
|---|---|---|---|---|---|---|
| ndbappmysqld | 8 | 8 | 19 | 20 | 5 | 32Gi |
| ndbmgmd | 2 | 2 | 9 | 11 | 2 | 16Gi |
| ndbmtd | 8 | 8 | 73 | 83 | 8 | 76Gi |
| ndbmysqld | 4 | 4 | 25 | 25 | 6 | 131Gi |
Min Replica = Max Replica
3.4.2.2 CPU Utilization
This section lists the CPU utilization for Policy and cnDBTier microservices. The CPU utilization is the ratio between the (total CPU utilization against total CPU request (X)) versus (target CPU Utilization (Y) configured for the pod).
Policy Microservices Resource Utilization
The following table describes the bench mark number as per the system maximum capacity utilization for Policy microservices.
The average CPU utilization is the ratio between the current usage of resource to the requested resources of the pod i.e., total sum of CPU utilized for service pods / total CPU requested for service pods.
Table 3-167 CPU/Memory Utilization by Policy Microservices
| Service Name | Site1 - CPU (X/Y) | Site2 - CPU (X/Y) | Site3 - CPU (X/Y) | Site4 - CPU (X/Y) |
|---|---|---|---|---|
| ocpcf-appinfo-hpa-v2 | 3%/80% | 3%/80% | 4%/80% | 3%/80% |
| ocpcf-config-server-hpa-v2 | 8%/80% | 8%/80% | 7%/80% | 7%/80% |
| ocpcf-diam-connector-hpa | 0%/40% | 0%/40% | 0%/40% | 0%/40% |
| ocpcf-egress-gateway-v2 | 0%/80% | 0%/80% | 0%/80% | 0%/80% |
| ocpcf-ingress-gateway-v2 | 0%/80% | 0%/80% | 0%/80% | 0%/80% |
| ocpcf-nrf-client-nfdiscovery-v2 | 0%/80% | 0%/80% | 0%/80% | 0%/80% |
| ocpcf-nrf-client-nfmanagement-v2 | 0%/80% | 0%/80% | 0%/80% | 0%/80% |
| ocpcf-oc-binding-hpa | 11%/60% | 0%/60% | 12%/60% | 0%/60% |
| ocpcf-ocpm-audit-service-hpa-v2 | 4%/60% | 4%/60% | 3%/60% | 4%/60% |
| ocpcf-ocpm-policyds-hpa | 0%/60% | 0%/60% | 0%/60% | 0%/60% |
| ocpcf-pcf-pre-hpa | 37%/80% | 0%/80% | 37%/80% | 0%/80% |
| ocpcf-pcrf-core-hpa | 24%/40% | 0%/40% | 24%/40% | 0%/40% |
| ocpcf-query-service-hpa | 0%/80% | 0%/80% | 0%/80% | 0%/80% |
Observed CPU utilization Values of cnDBTier Services
The following table provides information about observed values of cnDBTier services.
Table 3-168 CPU/Memory Utilization by CnDBTier services
| Service Name | Site1 - CPU (X/Y) | Site2 - CPU (X/Y) | Site3 - CPU (X/Y) | Site4 - CPU (X/Y) |
|---|---|---|---|---|
| ndbappmysqld | 91%/80% | 87%/80% | 92%/80% | 88%/80% |
| ndbmgmd | 0%/80% | 0%/80% | 0%/80% | 0%/80% |
| ndbmtd | 23%/80% | 8%/80% | 20%/80% | 11%/80% |
| ndbmysqld | 12%/80% | 6%/80% | 12%/80% | 6%/80% |
3.4.3 Test Scenario: Policy Call Model on Two-Site Georedundant Setup, with 15K TPS Traffic on Two Sites
This test run benchmarks the performance and capacity of Policy data call model that is deployed in PCF mode on a two-site of a two-site non-ASM GR Setup. Replication is on single-channel and Binding and PRE Enabled. The Policy application handles a total Ingress and Egress traffic of 15K TPS on two sites.
3.4.3.1 Test Case and Setup Details
Testcase Parameters
The following table describes the testcase parameters and their values:
| Parameters | Values |
|---|---|
| Call Rate (Diameter Gateway) | 30KTPS (15K TPS on two site) |
| ASM | Disable |
| Traffic Ratio | CCRI-I, AARI –1, CCRU-2, AARU - 1, RAR-Gx-1, RAR-Rx-1, STR –1, CCRT-1 |
| Active Subscribers | 10000000 |
Project Details
The Policy Design editor based on the Blockly interface was used to set the Policy project for each of the Policy services. The complexity level of Policy Project configured for this run was High.
Complexity Level Definition:
- Low – No usage of loops in Blockly logic, no JSON operations, and no complex Java Script code in object expression/statement expression.
- Medium – Usage of loops in Blockly logic, Policy table wildcard match <= 3 fields, MatchList < 3, and 3 < RegEx match < 6
- High – JSON Operations – Custom, complex Java script code in object Expression/statement expression, Policy table wildcard match > 3 fields, MatchLists >= 3, and RegEx mat >= 6
Call Model Data
Table 3-170 Traffic distribution
| Service Name | TPS |
|---|---|
| Ingress Service | NA |
| Egress Service | NA |
| Diameter Gateway Ingress | 8.33K TPS |
| Diameter Gateway Egress | 6.31K TPS |
| Diameter Connector | NA |
| SM service | NA |
| PDS Service | NA |
| PRE Service | NA |
| NRF Discovery | NA |
| UDR Connector | NA |
| CHF Connector | NA |
| Binding Service | NA |
| Bulwark Service | NA |
Policy Configurations
Following Policy services were either enabled or disabled for running this call flow:
Table 3-171 Policy microservices configuration
| Service Name | Status |
|---|---|
| Binding | Enabled |
| PER | Enabled |
| SAL | Enabled |
| LDAP | Disabled |
| OCS | Disabled |
| Audit | Enabled |
| Replication | Enabled |
| Bulwark | Disabled |
| Alternate routing | Disabled |
Following Policy interfaces were either enabled or disabled for running this call flow:
Table 3-172 Policy interfaces
| Feature Name | Status |
|---|---|
| N36 UDR query (N7/N15-Nudr) | NA |
| N36 UDR subscription (N7/N15-Nudr) | NA |
| UDR on-demand nrf discovery | NA |
| CHF (SM-Nchf) | NA |
| BSF (N7-Nbsf) | NA |
| AMF on demand nrf discovery | NA |
| LDAP (Gx-LDAP) | NA |
| Sy (PCF N7-Sy) | NA |
Following PCRF interfaces were either enabled or disabled for running this call flow:
Table 3-173 PCRF interfaces
| Feature Name | Status |
|---|---|
| Sy (PCRF Gx-Sy) | NA |
| Sd (Gx-Sd) | NA |
| Gx UDR query (Gx-Nudr) | NA |
| Gx UDR subscription (Gx-Nudr) | NA |
| CHF enabled (AM) | NA |
| Usage Monitoring (Gx) | NA |
| Subscriber HTTP Notifier (Gx) | NA |
Configuring cnDbTier Helm Parameters
There were no optimization parameters configured for this run.
Configuring cnDbTier Helm Parameters
There were no optimization parameters configured for this run.
Policy Microservices Resources
Table 3-174 Policy microservices resource allocation
| Service Name | CPU Request Per Pod | CPU Limit Per Pod | Memory Request Per Pod (Gi) | Memory Limit Per Pod (Gi) | Replicas |
|---|---|---|---|---|---|
| Appinfo | 1 | 1 | 0.5 | 1 | 1 |
| Audit Service | 1 | 2 | 1 | 1 | 1 |
| CM Service | 2 | 4 | 0.5 | 2 | 1 |
| Config Service | 2 | 4 | 0.5 | 2 | 1 |
| Egress Gateway | 3 | 4 | 4 | 6 | 2 |
| Ingress Gateway | 3 | 4 | 4 | 6 | 2 |
| Nrf Client Management | 1 | 1 | 1 | 1 | 2 |
| Diameter Gateway | 3 | 4 | 1 | 2 | 9 |
| Diameter Connector | 3 | 4 | 1 | 2 | 5 |
| Nrf Client Discovery | 3 | 4 | 0.5 | 2 | 2 |
| Query Service | 1 | 2 | 1 | 1 | 1 |
| PCRF Core Service | 7 | 8 | 8 | 8 | 24 |
| Performance | 1 | 1 | 0.5 | 1 | 2 |
| PRE Service | 5 | 5 | 0.5 | 4 | 15 |
| SM Service | 7 | 8 | 1 | 4 | 2 |
| PDS | 5 | 6 | 1 | 4 | 5 |
| Binding Service | 5 | 6 | 1 | 8 | 18 |
Table 3-175 cnDBTier services resource allocation
| Service Name | CPU Request Per Pod | CPU Limit Per Pod | Memory Request Per Pod (Gi) | Memory Limit Per Pod (Gi) | Replicas | Storage |
|---|---|---|---|---|---|---|
| ndbappmysqld | 8 | 8 | 19 | 20 | 5 | 32Gi |
| ndbmgmd | 2 | 2 | 9 | 11 | 2 | 16Gi |
| ndbmtd | 8 | 8 | 73 | 83 | 8 | 76Gi |
| ndbmysqld | 4 | 4 | 25 | 25 | 6 | 131Gi |
Min Replica = Max Replica
3.4.3.2 CPU Utilization
This section lists the CPU utilization for Policy and cnDBTier microservices. The CPU utilization is the ratio between the (total CPU utilization against total CPU request (X)) versus (target CPU Utilization (Y) configured for the pod).
Policy Microservices Resource Utilization
The following table describes the bench mark number as per the system maximum capacity utilization for Policy microservices.
The average CPU utilization is the ratio between the current usage of resource to the requested resources of the pod i.e., total sum of CPU utilized for service pods / total CPU requested for service pods.
Table 3-176 CPU/Memory Utilization by Policy Microservices
| Service Name | Site1 - CPU (X/Y) | Site2 - CPU (X/Y) |
|---|---|---|
| ocpcf-appinfo-hpa-v2 | 4%/80% | 5%/80% |
| ocpcf-config-server-hpa-v2 | 8%/80% | 8%/80% |
| ocpcf-diam-connector-hpa | 0%/40% | 0%/40% |
| ocpcf-egress-gateway-v2 | 0%/80% | 0%/80% |
| ocpcf-ingress-gateway-v2 | 0%/80% | 0%/80% |
| ocpcf-nrf-client-nfdiscovery-v2 | 0%/80% | 0%/80% |
| ocpcf-nrf-client-nfmanagement-v2 | 0%/80% | 0%/80% |
| ocpcf-oc-binding-hpa | 8%/60% | 8%/60% |
| Diam-Gw (from dashboard) | 2.5%/80% | 2.5%/80% |
| ocpcf-ocpm-audit-service-hpa-v2 | 4%/60% | 4%/60% |
| ocpcf-ocpm-policyds-hpa | 0%/60% | 0%/60% |
| ocpcf-pcf-pre-hpa | 40%/80% | 42%/80% |
| ocpcf-pcrf-core-hpa | 25%/40% | 24%/40% |
| ocpcf-query-service-hpa | 0%/80% | 0%/40% |
Observed CPU utilization Values of cnDBTier Services
The following table provides information about observed values of cnDBTier services.
Table 3-177 CPU/Memory Utilization by CnDBTier services
| Service Name | Site1 - CPU (X/Y) | Site2 - CPU (X/Y) |
|---|---|---|
| ndbappmysqld | 85%/80% | 92%/80% |
| ndbmgmd | 0%/80% | 0%/80% |
| ndbmtd | 15%/80% | 15%/80% |
| ndbmysqld | 6%/80% | 6%/80% |
3.5 PCF Call Model 5
3.5.1 Test Scenario: PCF Call Model on Single-Site Setup, Handling 30K TPS Traffic with Binding Feature Enabled
This test was run to benchmark the performance and capacity of PCF call model with 30K traffic on a single site. For this setup, Aspen Service Mesh (ASM) was disabled, Binding feature was enabled. User Connecttor microservice restart with a duration of 4.0 hours.
3.5.1.1 Test Case and Setup Details
Testcase Parameters
The following table describes the testcase parameters and their values:
| Parameters | Values |
|---|---|
| Call Rate (Ingress + Egress) | 30K TPS on a single site Non ASM PCF Setup |
| ASM | Disable |
| Traffic Ratio | IGW-11,EGW-26,Diam-in 9,Diam-Out 3IGW-11 ,EGW-26,Diam-in=9,Diam-out - 3 |
| Deployment Model | PCF 1 at Site1 |
Project Details
The Policy Design editor based on the Blockly interface was used to set the Policy project for each of the Policy services. The complexity level of Policy Project configured for this run was High.
Complexity Level Definition:
- Low – No usage of loops in Blockly logic, no JSON operations, and no complex Java Script code in object expression/statement expression.
- Medium – Usage of loops in Blockly logic, Policy table wildcard match <= 3 fields, MatchList < 3, and 3 < RegEx match < 6
- High – JSON Operations – Custom, complex Java script code in object Expression/statement expression, Policy table wildcard match > 3 fields, MatchLists >= 3, and RegEx mat >= 6
Call Model
Table 3-179 Traffic distribution
| Traffic | TPS |
|---|---|
| Ingress Gateway | 6637 |
| Egress Gateway | 15988 |
| Diam In | 5279 |
| Diam out | 1844 |
| Total | 29747 |
Table 3-180 Traffic distribution to Policy databases
| Number of Entries | TPS |
|---|---|
| occnp_pcf_sm.AppSession | 132704 |
| occnp_pcf_sm.SmPolicyAssociation | 434302 |
| occnp_pcf_sm.SmPolicyAssociation$EX | 0 |
| occnp_policyds.pdssubscriber | 434475 |
| occnp_policyds.pdssubscriber$EX | 0 |
| occnp_policyds.pdsprofile | 324110 |
| occnp_policyds.pdsprofile$EX | 0 |
| occnp_binding.contextbinding | 434668 |
| ooccnp_binding.contextbinding$EX | 0 |
| occnp_binding.dependentcontextbinding | 77294 |
| occnp_binding.dependentcontextbinding$EX | 0 |
Table 3-181 Traffic distribution at Policy services
| Policy Service | Avg TPS/MPS |
|---|---|
| Ingress Gateway(MPS) | 12075.40103 |
| Egress Gateway(MPS) | 28537.36981 |
| SM Service(MPS) | 44669.88753 |
| AM Service(MPS) | 0.00000 |
| UE Service(MPS) | 0.00000 |
| PDS(MPS) | 12643.96131 |
| Pre Service(MPS) | 0.00000 |
| Nrf Discovery(MPS) | 0.00000 |
| CHF Connector(MPS) | 6591.08083 |
| UDR Connector(MPS) | 0.00000 |
| Binding(MPS) | 12064.61603 |
Policy Configurations
Following PCF configurations were either enabled or disabled for running this call flow:
Table 3-182 Policy configurations
| Name | Status |
|---|---|
| Bulwark | Disabled |
| Binding | Enabled |
| Subscriber State Variable (SSV) | Disabled |
| Validate_user | Enabled |
| Alternate Route | Enabled |
| Audit | Enabled |
| Compression (Binding & SM Service) | Disabled |
| SYSTEM.COLLISION.DETECTION | Disabled |
Policy Interfaces
Following Policy interfaces were either enabled or disabled for running this call flow:
Table 3-183 Policy interfaces
| Feature Name | Status |
|---|---|
| Subscriber Tracing[For 100 subscriber] | Enabled |
| N36 UDR subscription (N7/N15-Nudr) | Enabled |
| UDR on-demand nrf discovery | NA |
| CHF (SM-Nchf) | Enabled |
| BSF (N7-Nbsf) | NA |
| AMF on demand nrf discovery | NA |
| LDAP (Gx-LDAP) | NA |
| Binding Feature | Enabled |
Policy Microservices Resources
Table 3-184 Policy microservices Resource allocation
| Service Name | Replicas | CPU Request per Pod (#) | CPU Limit per Pod (#) | Memory Request per Pod (Gi) | Memory Limit per Pod (Gi) |
|---|---|---|---|---|---|
| Appinfo | 2 | 1 | 1 | 0.5 | 1 |
| Binding Service | 2 | 6 | 6 | 1 | 8 |
| Diameter Connector | 4 | 4 | 4 | 1 | 2 |
| Diameter Gateway | 2 | 4 | 4 | 1 | 2 |
| Audit Service | 1 | 1 | 2 | 1 | 1 |
| CM Service | 1 | 4 | 4 | 0.5 | 2 |
| Config Service | 1 | 4 | 4 | 0.5 | 2 |
| Egress Gateway | 8 | 4 | 4 | 4 | 6 |
| Ingress Gateway | 8 | 4 | 4 | 4 | 6 |
| NRF Client NF Discovery | 1 | 4 | 4 | 0.5 | 2 |
| NRF Client Management | 1 | 1 | 1 | 1 | 1 |
| Query Service | 1 | 1 | 2 | 1 | 1 |
| PRE | 13 | 4 | 4 | 0.5 | 2 |
| SM Service | 9 | 8 | 8 | 1 | 4 |
| PDS | 8 | 6 | 6 | 1 | 4 |
| UDR Connector | 2 | 6 | 6 | 1 | 4 |
| CHF Connector/ User Service | 2 | 1 | 4 | 6 | 6 |
cnDBTier Microservices Resources
Table 3-185 CnDBTier Resource allocation
| Service Name | Replicas | CPU Request per Pod (#) | CPU Limit per Pod (#) | Memory Request per Pod (Gi) | Memory Limit per Pod (Gi) |
|---|---|---|---|---|---|
| ndbappmysqld | 4 | 12 | 12 | 24 | 24 |
| ndbmgmd | 2 | 4 | 4 | 10 | 10 |
| ndbmtd | 8 | 8 | 8 | 42 | 42 |
| db-infra-monitor-svc | 1 | 200 | 200 | 500 | 500 |
| db-backup-manager-svc | 1 | 100 | 100 | 128 | 128 |
3.5.1.2 CPU Utilization
This section lists the CPU utilization for Policy and cnDBTier microservices. The CPU utilization is the ratio between the (total CPU utilization against total CPU request (X)) versus (target CPU Utilization (Y) configured for the pod).
Policy Microservices Resource Utilization
The following table describes the bench mark number as per the system maximum capacity utilization for Policy microservices.
The average CPU utilization is the ratio between the current usage of resource to the requested resources of the pod i.e., total sum of CPU utilized for service pods / total CPU requested for service pods.
Table 3-186 CPU/Memory Utilization by Policy Microservices
| App/ Container | CPU | Memory |
|---|---|---|
| AppInfo | 3.80% | 24.71% |
| Binding Service | 24.36% | 23.96% |
| Diameter Connector | 29.76% | 49.39% |
| CHF Connector | 33.37% | 39.40% |
| Config Service | 3.14% | 42.07% |
| Egress Gateway | 46.77% | 28.76% |
| Ingress Gateway | 53.61% | 55.54% |
| NRF Client NF Discovery | 0.07% | 31.45% |
| NRF Client NF Management | 0.30% | 46.00% |
| UDR Connector | 19.05% | 22.53% |
| Audit Service | 0.15% | 46.29% |
| CM Service | 0.47% | 34.08% |
| PDS | 39.39% | 45.96% |
| PRE Service | 19.81% | 85.36% |
| Query Service | 0.05% | 25.83% |
| AM Service | 0.05% | 13.18% |
| SM Service | 57.00% | 89.29% |
| UE Service | 0.40% | 34.96% |
| Performance | 1.00% | 13.18% |
Observed CPU utilization Values of cnDBTier Services
The following table provides information about observed values of cnDBTier services.
Table 3-187 CPU/Memory Utilization by CnDBTier services
| Service | CPU | Memory |
|---|---|---|
| ndbappmysqld/mysqlndbcluster | 60.41% | 38.09% |
| ndbappmysqld/init-sidecar | 2.00% | 0.39% |
| ndbmgmd/mysqlndbcluster | 0.18% | 20.12% |
| ndbmgmd/db-infra-monitor-svc | 2.00% | 9.38% |
| ndbmtd/mysqlndbcluster | 36.65% | 82.12% |
| ndbmtd/db-backup-executor-svc | 0.10% | 2.31% |
| ndbmtd/db-infra-monitor-svc | 2.37% | 9.08% |
| ocpcf-oc-diam-gateway/diam-gateway | 18.56% | 35.06% |
3.5.1.3 Results
Table 3-188 Average latency observations
| Scenario | Average Latency (ms) | Peak Latency (ms) |
|---|---|---|
| create-dnn_ims | 28.631 | 28.733 |
| N7-dnn_internet_1st | 1527.421 | 2239.414 |
| N7-dnn_internet_2nd | 1518.459 | 1990.823 |
| N7-dnn_internet_3rd | 1567.876 | 1967.632 |
| delete-dnn_ims | 14.595 | 14.666 |
| Overall | 931.397 | 2239.414 |
Table 3-189 Average NF service latency
| NF Service Latency ( In Seconds) | Avg |
|---|---|
| PCF_IGW_Latency | 0.01588 |
| PCF_POLICYPDS_Latency | 0.01112 |
| PCF_UDRCONNECTOR_Latency | 0.00237 |
| PCF_NRFCLIENT_Latency | 0.00000 |
| PCF_EGRESS_Latency | 0.00060 |
3.5.2 Test Scenario: PCF Call Model on Single-Site Setup, Handling 30K TPS Traffic with Binding Feature Disabled
This test was run to benchmark the performance and capacity of PCF call model with 30K traffic on a single site. For this setup, Aspen Service Mesh (ASM) was disabled, Binding feature was disabled.
3.5.2.1 Test Case and Setup Details
Testcase Parameters
The following table describes the testcase parameters and their values:
| Parameters | Values |
|---|---|
| Call Rate (Ingress + Egress) | 30K TPS on a single site Non ASM PCF Setup |
| ASM | Disable |
| Traffic Ratio | IGW-11,EGW-26,Diam-in 9,Diam-Out 3IGW-11 ,EGW-26,Diam-in=9,Diam-out - 3 |
| Deployment Model | PCF 1 at Site1 |
Project Details
The Policy Design editor based on the Blockly interface was used to set the Policy project for each of the Policy services. The complexity level of Policy Project configured for this run was High.
Complexity Level Definition:
- Low – No usage of loops in Blockly logic, no JSON operations, and no complex Java Script code in object expression/statement expression.
- Medium – Usage of loops in Blockly logic, Policy table wildcard match <= 3 fields, MatchList < 3, and 3 < RegEx match < 6
- High – JSON Operations – Custom, complex Java script code in object Expression/statement expression, Policy table wildcard match > 3 fields, MatchLists >= 3, and RegEx mat >= 6
Call Model
Table 3-190 Traffic distribution
| Traffic | TPS |
|---|---|
| Ingress Gateway | 6637 |
| Egress Gateway | 15988 |
| Diam In | 5279 |
| Diam out | 1844 |
| Total | 29747 |
Table 3-191 Traffic distribution to Policy databases
| Number of Entries | TPS |
|---|---|
| occnp_pcf_sm.AppSession | 132704 |
| occnp_pcf_sm.SmPolicyAssociation | 434302 |
| occnp_pcf_sm.SmPolicyAssociation$EX | 0 |
| occnp_policyds.pdssubscriber | 434475 |
| occnp_policyds.pdssubscriber$EX | 0 |
| occnp_policyds.pdsprofile | 324110 |
| occnp_policyds.pdsprofile$EX | 0 |
| occnp_binding.contextbinding | 434668 |
| ooccnp_binding.contextbinding$EX | 0 |
| occnp_binding.dependentcontextbinding | 77294 |
| occnp_binding.dependentcontextbinding$EX | 0 |
Table 3-192 Traffic distribution at Policy services
| Policy Service | Avg TPS/MPS |
|---|---|
| Ingress Gateway(MPS) | 13294.09 |
| Egress Gateway(MPS) | 30644.41 |
| SM Service(MPS) | 46777.97 |
| AM Service(MPS) | 0.00 |
| UE Service(MPS) | 0.00 |
| PDS(MPS) | 13115.32 |
| CHF Connector(MPS) | 6452.53 |
| UDR Connector(MPS) | 3638.04 |
| Binding(MPS) | 0.00 |
Policy Configurations
Following PCF configurations were either enabled or disabled for running this call flow:
Table 3-193 Policy configurations
| Name | Status |
|---|---|
| Bulwark | Disabled |
| Binding | Disabled |
| Subscriber State Variable (SSV) | Enabled |
| Validate_user | Enabled |
| Alternate Route | Enabled |
| Audit | Enabled |
| Compression (Binding & SM Service) | Disabled |
| SYSTEM.COLLISION.DETECTION | Disabled |
Policy Interfaces
Following Policy interfaces were either enabled or disabled for running this call flow:
Table 3-194 Policy interfaces
| Feature Name | Status |
|---|---|
| Subscriber Tracing[For 100 subscriber] | Enabled |
| N36 UDR subscription (N7/N15-Nudr) | Enabled |
| UDR on-demand nrf discovery | NA |
| CHF (SM-Nchf) | Enabled |
| BSF (N7-Nbsf) | NA |
| AMF on demand nrf discovery | NA |
| LDAP (Gx-LDAP) | NA |
| Binding Feature | Disabled |
Policy Microservices Resources
Table 3-195 Policy microservices Resource allocation
| Service Name | Replicas | CPU Request per Pod (#) | CPU Limit per Pod (#) | Memory Request per Pod (Gi) | Memory Limit per Pod (Gi) |
|---|---|---|---|---|---|
| Appinfo | 2 | 1 | 1 | 0.5 | 1 |
| Binding Service | 2 | 6 | 6 | 8 | 8 |
| Diameter Connector | 4 | 4 | 4 | 1 | 2 |
| Diameter Gateway | 4 | 4 | 4 | 1 | 2 |
| Audit Service | 1 | 2 | 2 | 4 | 4 |
| CM Service | 1 | 4 | 4 | 0.5 | 2 |
| Config Service | 1 | 4 | 4 | 0.5 | 2 |
| Egress Gateway | 8 | 4 | 4 | 6 | 6 |
| Ingress Gateway | 8 | 4 | 4 | 6 | 6 |
| NRF Client NF Discovery | 1 | 4 | 4 | 0.5 | 2 |
| NRF Client Management | 1 | 1 | 1 | 1 | 1 |
| Query Service | 1 | 2 | 2 | 1 | 1 |
| PRE | 13 | 4 | 4 | 4 | 4 |
| SM Service | 9 | 8 | 8 | 6 | 6 |
| PDS | 8 | 6 | 6 | 6 | 6 |
| UDR Connector | 2 | 6 | 6 | 4 | 4 |
| CHF Connector/ User Service | 2 | 6 | 6 | 4 | 4 |
cnDBTier Microservices Resources
Table 3-196 CnDBTier Resource allocation
| Service Name | Replicas | CPU Request per Pod (#) | CPU Limit per Pod (#) | Memory Request per Pod (Gi) | Memory Limit per Pod (Gi) |
|---|---|---|---|---|---|
| ndbappmysqld | 4 | 12 | 12 | 28 | 28 |
| ndbmgmd | 2 | 4 | 4 | 9 | 12 |
| ndbmtd | 8 | 8 | 8 | 42 | 42 |
| db-infra-monitor-svc | 1 | 200 | 200 | 500 | 500 |
| db-backup-manager-svc | 1 | 100 | 100 | 128 | 128 |
3.5.2.2 CPU Utilization
This section lists the CPU utilization for Policy and cnDBTier microservices. The CPU utilization is the ratio between the (total CPU utilization against total CPU request (X)) versus (target CPU Utilization (Y) configured for the pod).
Policy Microservices Resource Utilization
The following table describes the bench mark number as per the system maximum capacity utilization for Policy microservices.
The average CPU utilization is the ratio between the current usage of resource to the requested resources of the pod i.e., total sum of CPU utilized for service pods / total CPU requested for service pods.
Table 3-197 CPU/Memory Utilization by Policy Microservices
| App/ Container | CPU | Memory |
|---|---|---|
| AppInfo | 4.00% | 25.40% |
| Diameter Connector | 39.80% | 75.70% |
| CHF Connector | 57.30% | 58.90% |
| Config Service | 2.78% | 3.60% |
| Egress Gateway | 47.50% | 26.90% |
| Ingress Gateway | 53.60% | 42.42% |
| NRF Client NF Discovery | 0.102% | 33.59% |
| NRF Client NF Management | 0.214% | 41.6% |
| UDR Connector | 25.50% | 71.90% |
| Audit Service | 0.669% | 46.3% |
| CM Service | 0.38% | 34.16% |
| PDS | 48.67% | 64.20% |
| PRE Service | 15.9% | 49.6% |
| Query Service | 0.0357% | 25.12% |
| AM Service | 0.02% | 14.96% |
| SM Service | 64.60% | 76.23% |
| UE Service | 0.387% | 34.57% |
Observed CPU utilization Values of cnDBTier Services
The following table provides information about observed values of cnDBTier services.
Table 3-198 CPU/Memory Utilization by CnDBTier services
| Service | CPU | Memory |
|---|---|---|
| ndbappmysqld/mysqlndbcluster | 51.50% | 44.70% |
| ndbmgmd/db-infra-monitor-svc | 10.30% | 16.90% |
| ndbmtd/mysqlndbcluster | 35.1% | 72.60% |
| ndbmtd/db-backup-executor-svc | 35.1% | 2.32% |
| ndbmtd/db-infra-monitor-svc | 35.1% | 13.60% |
3.5.2.3 Results
Table 3-199 Average latency observations
| Scenario | Average Latency (ms) | Peak Latency (ms) |
|---|---|---|
| create-dnn_ims | 54.142 | 66.775 |
| N7-dnn_internet_1st | 20.316 | 22.226 |
| N7-dnn_internet_2nd | 23.517 | 26.133 |
| N7-dnn_internet_3rd | 20.071 | 21.323 |
| delete-dnn_ims | 29.722 | 47.689 |
| Overall | 29.554 | 66.775 |
Table 3-200 Average NF service latency
| NF Service Latency ( In Seconds) | Avg |
|---|---|
| PCF_IGW_Latency | 17.45 |
| PCF_POLICYPDS_Latency | 16.85 |
| PCF_UDRCONNECTOR_Latency | 2.19 |
| PCF_NRFCLIENT_Latency | 0.00 |
| PCF_EGRESS_Latency | 0.51 |
3.6 PCF Call Model 6
3.6.1 Test Scenario: 10K TPS Diameter Ingress Gateway and 17K TPS Egress Gateway TPS Traffic with Usage Monitoring Enabled
Figure 3-2 Policy Deployment in a single site Setup:
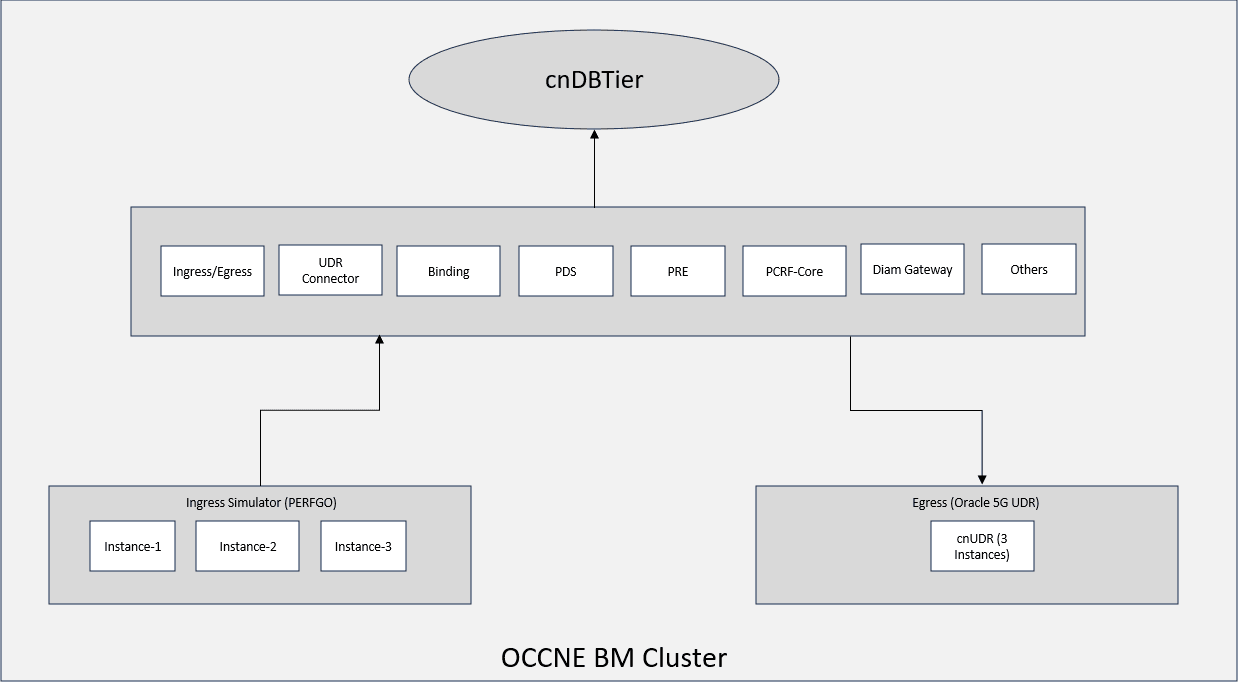
3.6.1.1 Test Case and Setup Details
Testcase Parameters
The following table describes the testcase parameters and their values:
| Parameters | Values |
|---|---|
| Call Rate (Ingress + Egress) | 27K TPS on a single site Non ASM PCF Setup |
| ASM | Disable |
| Traffic Ratio | PCF 10K Diameter Ingress Gateway TPS and 17K Egress Gateway TPS |
| Deployment Model | PCF as a standalone |
Project Details
The Policy Design editor based on the Blockly interface was used to set the Policy project for each of the Policy services. The complexity level of Policy Project configured for this run was High.
Complexity Level Definition:
- Low – No usage of loops in Blockly logic, no JSON operations, and no complex Java Script code in object expression/statement expression.
- Medium – Usage of loops in Blockly logic, Policy table wildcard match <= 3 fields, MatchList < 3, and 3 < RegEx match < 6
- High – JSON Operations – Custom, complex Java script code in object Expression/statement expression, Policy table wildcard match > 3 fields, MatchLists >= 3, and RegEx mat >= 6
Call Model
Table 3-201 Traffic distribution
| Traffic | TPS |
|---|---|
| Ingress Gateway | 1000 |
| Egress Gateway | 17000 |
| Diam In | 10000 |
| Diam out | 0 |
| Total | 29747 |
Table 3-202 Traffic distribution to Policy databases
| Number of Entries | TPS |
|---|---|
| occnp_policyds.pdssubscriber | 3084338 |
| occnp_policyds.pdssubscriber$EX | 0 |
| occnp_policyds.pdsprofile | 2278801 |
| occnp_policyds.pdsprofile$EX | 0 |
| occnp_binding.contextbinding | 82382 |
| ooccnp_binding.contextbinding$EX | 0 |
| occnp_binding.dependentcontextbinding | 0 |
| occnp_binding.dependentcontextbinding$EX | 0 |
| occnp_pcrf_core.gxsession | 82351 |
| occnp_pcrf_core.gxsession$EX | 0 |
| occnp_usagemon.UmContext | 737281 |
| occnp_usagemon.UmContext$EX | 0 |
Policy Configurations
Following PCF configurations were either enabled or disabled for running this call flow:
Table 3-203 Policy configurations
| Name | Status |
|---|---|
| Binding | Disabled |
| Validate_user | Enabled |
| Usage Monitoring | Enabled |
| PRE | Enabled |
Policy Interfaces
Following Policy interfaces were either enabled or disabled for running this call flow:
Table 3-204 Policy interfaces
| Feature Name | Status |
|---|---|
| N36 UDR subscription (N7/N15-Nudr) | Enabled |
| UDR on-demand nrf discovery | Disabled |
| LDAP (Gx-LDAP) | NA |
| Binding Feature | Disabled |
Policy Microservices Resources
Table 3-205 Policy microservices Resource allocation
| Service Name | Replicas | CPU Request per Pod (#) | CPU Limit per Pod (#) | Memory Request per Pod (Gi) | Memory Limit per Pod (Gi) |
|---|---|---|---|---|---|
| Appinfo | 2 | 1 | 1 | 1 | 1 |
| Binding Service | 10 | 1 | 1 | 1 | 1 |
| Diameter Connector | 4 | 4 | 4 | 2 | 2 |
| Diameter Gateway | 2 | 4 | 4 | 2 | 2 |
| Config Service | 1 | 4 | 4 | 2 | 2 |
| Egress Gateway | 8 | 4 | 4 | 6 | 6 |
| LDAP Gateway | 0 | 3 | 4 | 1 | 2 |
| Ingress Gateway | 8 | 1 | 1 | 1 | 1 |
| NRF Client NF Discovery | 1 | 1 | 1 | 1 | 1 |
| NRF Client Management | 1 | 1 | 1 | 1 | 1 |
| Audit Service | 1 | 2 | 2 | 4 | 4 |
| CM Service | 1 | 4 | 4 | 0.5 | 2 |
| PDS | 8 | 6 | 6 | 6 | 6 |
| PRE | 13 | 4 | 4 | 4 | 4 |
| Query Service | 1 | 2 | 2 | 1 | 1 |
| SM Service | 9 | 8 | 8 | 6 | 6 |
| PCRF-Core | 10 | 8 | 8 | 8 | 8 |
| Usage Monitoring | 16 | 8 | 8 | 4 | 4 |
| Performance | 2 | 1 | 1 | 0.5 | 1 |
| UDR Connector | 10 | 6 | 6 | 4 | 4 |
cnDBTier Microservices Resources
Table 3-206 CnDBTier Resource allocation
| Service Name | Replicas | CPU Request per Pod (#) | CPU Limit per Pod (#) | Memory Request per Pod (Gi) | Memory Limit per Pod (Gi) |
|---|---|---|---|---|---|
| ndbappmysqld | 6 | 12 | 12 | 20 | 20 |
| ndbmgmd | 2 | 4 | 4 | 8 | 10 |
| ndbmtd | 6 | 12 | 12 | 75 | 75 |
| ndbmysqld | 2 | 4 | 4 | 16 | 16 |
| db-infra-monitor-svc | 1 | 4 | 4 | 4 | 4 |
| db-backup-manager-svc | 1 | 0.1 | 0.1 | 0.128 | 0.128 |
3.6.1.2 CPU Utilization
This section lists the CPU utilization for Policy and cnDBTier microservices. The CPU utilization is the ratio between the (total CPU utilization against total CPU request (X)) versus (target CPU Utilization (Y) configured for the pod).
Policy Microservices Resource Utilization
The following table describes the bench mark number as per the system maximum capacity utilization for Policy microservices.
The average CPU utilization is the ratio between the current usage of resource to the requested resources of the pod i.e., total sum of CPU utilized for service pods / total CPU requested for service pods.
Table 3-207 CPU/Memory Utilization by Policy Microservices
| App/ Container | CPU | Memory |
|---|---|---|
| AppInfo | 3.00% | 25.00% |
| Diameter Connector | 1.00% | 12.00% |
| Diameter Gateway | 18.60% | 18.00% |
| Config Service | 5.00% | 19.00% |
| Egress Gateway | 7.00% | 18.00% |
| Ingress Gateway | 0.00% | 10.00% |
| NRF Client NF Discovery | 0.00% | 33.59% |
| NRF Client NF Management | 0.00% | 45.00% |
| UDR Connector | 5.00% | 24.00% |
| Audit Service | 0.00% | 28.70% |
| CM Service | 3.50% | 38.00% |
| PDS | 6.00% | 28.00% |
| PRE Service | 8.00% | 48.00% |
| Query Service | 0.00% | 23.00% |
| SM Service | 0.00% | 14.00% |
| Usage Monitoring | 5.00% | 67.00% |
Observed CPU utilization Values of cnDBTier Services
The following table provides information about observed values of cnDBTier services.
Table 3-208 CPU/Memory Utilization by CnDBTier services
| Service | CPU | Memory |
|---|---|---|
| ndbappmysqld/mysqlndbcluster | 51.50% | 44.70% |
| ndbmgmd/db-infra-monitor-svc | 10.30% | 16.90% |
| ndbmtd/mysqlndbcluster | 35.1% | 72.60% |
| ndbmtd/db-backup-executor-svc | 35.1% | 2.32% |
| ndbmtd/db-infra-monitor-svc | 35.1% | 13.60% |
3.6.1.3 Results
Table 3-209 Average latency observations
| Scenario | Average Latency (ms) | Peak Latency (ms) |
|---|---|---|
| Gx-init | 130 | 260 |
| Gx-Update_1st | 103 | 207 |
| Gx-Update_2nd | 104 | 209 |
| Gx-Update_3rd | 104 | 208 |
| Gx-Terminate | 86 | 172 |
| Overall | 105 | 211 |
Table 3-210 Average NF service latency
| NF Service Latency( In Seconds) | Avg (ms) |
|---|---|
| Ingress Gateway | 31.8 |
| PDS | 83.8 |
| UDR | 22.4 |
| Binding | 51.8 |
| Egress Gateway | 20.4 |
| Usage-Mon | 94.4 |
| PCRF-Core | 3.84 |
| Diameter Gateway | 124 |
| PRE | 123 |