4.4 Service Related Issues
This section describes the most common service related issues and their resolution steps.
4.4.1 Resolving Microservices related Issues through Metrics and ConfigDB
This section describes how to troubleshoot issues related to UDR microservices using metrics.
nudr-drservice
If requests for nudr-drservice fail, then try to find the root cause from metrics using following guidelines:
- If the count of measurement “udr_schema_operations_failure_total” is increasing, check the content of the incoming request and make sure that the incoming json data blob is proper and as per the specification.
- If “udr_db_operations_failure_total” measurements are increasing,
- Make sure that connectivity is proper between microservices and MySQL DB nodes.
- Make sure that you are not trying to insert duplicate keys.
- Make sure that DB nodes have enough resources available.
nudr-dr-provservice
If requests for nudr-dr-provservice fails, then try to find the root cause from metrics using following guidelines:
- If the count “udr_schema_operations_failure_total” measurement is increasing, check the content of incoming request and ensure the incoming JSON data blob is proper and as per the specification.
- If “udr_db_operations_failure_total” measurements are increasing,
then ensure:
- there is connectivity between microservices and MySQL DB nodes.
- you are not trying to insert duplicate keys.
- database nodes have enough resources available.
nudr-nrf-nfmanagement
If requests for nudr-nrf-nfmanagement fail, then try to find the root cause from metrics using following guidelines:
- Check for current health status of NRF using the nrfclient_nrf_operative_status metric. If it is 0, it is UNHEALTHY or UNAVAILABLE.
- Check for current NF status using the nrfclient_nrf_operative_status metric, and NF status with NRF with nrfclient_nf_status_with_nrf metric.
- If NF status is 0, then check the appinfo_service_running metric for various services configured in the app-info section depending on the UDR mode.
nudr-nrf-client-service
- Check the current health status of NRF using "nrfclient_nrf_operative_status" metric. If it is 0, then it is UNHEALTHY or UNAVAILABLE.
- Check the current network function status using "nrfclient_nrf_operative_status" metric and network function status with NRF using "nrfclient_nf_status_with_nrf" metric.
- If network function status is 0, check "appinfo_service_running" metric for various services configured in the app info section depending on UDR mode.
ocudr-nudr-notify-service
If requests for ocudr-nudr-notify-service fail, then try to find the root cause from metrics using following guidelines:
- Measurements like “nudr_notif_notifications_ack_2xx_total”, “nudr_notif_notifications_ack_4xx_total”, “nudr_notif_notifications_ack_5xx_total” gives information about the response code returned in the notification response.
- If count of “nudr_notif_notifications_send_fail_total” measurement is increasing, make sure that notification server mentioned in NOTIFICATION_URI during subscription request, which is expected to receive the notifications, is up and running.
- The default retry count for failed notifications is two and this is
configurable from the
retrycountparameter in the custom values yaml file. Perform the following steps if alerts is raised for exceeding notifications table limit threshold:- Log in to mysql database terminal to check the number of records on the NOTIFICATIONS table under UDR subscriber database (select count(*) from NOTIFICATIONS).
- Perform the following steps if the notification records
count is consistently above 50k:
- Check if there are more failures on the notification
sent from notify service using
nudr_notif_notifications_ack_4xx_totalandnudr_notif_notifications_ack_5xx_totalmetrics. - Check the reason for the failure and resolve the failure.
- If the failure is temporary and cannot be avoided
then use the notifications configuration REST API or CNC Console
to reduce the
retrycountto 0 or 1. This will make sure that the table size does not increase faster.
- Check if there are more failures on the notification
sent from notify service using
ocudr-nudr-config
If requests for ocudr-nudr-config fail, try to find the root cause from metrics using following guidelines:
- Measurements like “nudr_config_total_requests_total{Method='GET'}”, “nudr_config_total_requests_total{Method='POST'}”, “nudr_config_total_requests_total{Method='PUT'}” gives information about the total request pegged for the method GET, POST, and PUT respectively.
- If count of measurement “nudr_config_total_responses_total{Method='GET/POST/PUT',StatusCode="400/404/405/500"}” is increasing, it means the requests are not being processed and results in failures.
If requests for ocudr-nudr-config fail, try to find the root cause from configdb using following guidelines:
- If you get a BAD REQUEST for GET API, then make sure all the tables shown
below is present in configdb table.
Figure 4-37 Configdb Table
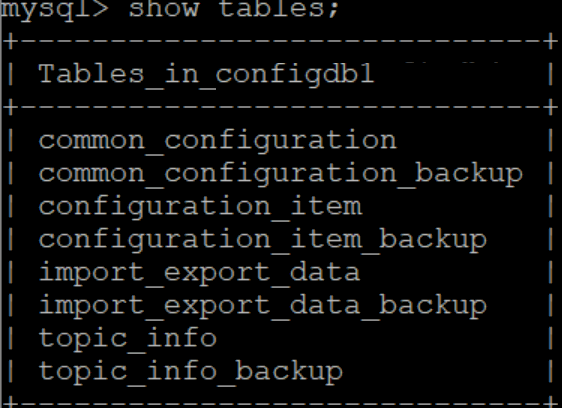
- If all the table are present and you are getting a BAD REQUEST for GET
API, then you must verify the configuration item table shown below.
Figure 4-38 Configuration Item Table

- If you get a BAD REQUEST and NOT FOUND for Import and Export API,
then you must verify the import and export data table shown below.
Figure 4-39 Import and Export Data

ocudr-nudr-bulk-import
- If the bulk-import logs show "dr-service is down. Job cannot be executed", then check whether dr-service and Ingress Gateway are in the running state.
- If the count of nudr_bulk_import_csvfile_records_read_total(Method="DELETE/PUT/POST", Status="Failure") metric is increasing, then it means the CSV file records are not valid. This can be resolved by providing correct keyType, KeyValue, operationType, nfType, and jsonPayload.
- If the count of nudr_bulk_import_records_processed_total(Method = "POST/PUT/DELETE", StatusCode="201/204", Status="Success") is increasing, then it means the records are being processed by UDR correctly.
- To find the number of request processed successfully for PCF, measure the count of Nudr_bulk_import_PCF_total{StatusCode="204/201", Status="Success"} metric.
For information about bulk import metrics, see Oracle Communications Cloud Native Core, Unified Data Repository Users Guide.
ocudr-nudr-xmltocsv
After copying the ixml file using kubectl cp command, log into xmltocsv container and run the following command to check whether the file is copied or not:
> kubectl exec -it <pod name> -c nudr-xmltocsv -n
                    <namespace> bash > cd /home/udruser/xml
If the count of measurement of the nudr_xmltocsv_xmlfile_records_read_total(Status="Failure") metric is increasing, then it shows the records in the ixml file are not valid. You need to ensure that correct ixml file is provided.
If the measurement count of the nudr_xmltocsv_records_processed_total{Method = "POST/PUT/DELETE/PATCH", Status="Success"} metric is increasing, then it denotes that the records are processed successfully.
For information about xmltocsv metrics, see Oracle Communications Cloud Native Core, Unified Data Repository Users Guide.
ocudr-nudr-diameterproxy
If diameterproxy restarts, then make sure the database configurations are correct. For information about ocudr-nudr-diameterproxy metrics, see Oracle Communications Cloud Native Core, Unified Data Repository Users Guide.
diam-gateway
If the Diameter Gateway sends a CEA message with DIAMETER_UNKNOWN_PEER metric, then it means the client peer configuration is not done correctly. Configure the allowedClientNodes section of Diameter Gateway service using REST API.
If the Diameter Gateway sends a CEA message success and other SH message response with DIAMETER_UNABLE_TO_COMPLY/DIAMETER_MISSING_AVP metric, then the problem may lie in the requested Sh message.
If the Diameter Gateway error logs show errors like connection refused with some IP and port, then it means a specified peer node configured is not able to accept the CER request from the Diameter Gateway and Diameter Gateway retries to connect with that peer.
If you are getting DIAMETER_UNABLE_TO_DELIVERY error message, then it means diameterproxy is turned off or not running. If the Diameter Gateway goes to crashloop back off state, then it means that incorrect peer node is configured.
Use metric ocudr_diam_conn_network to verify the active connection in the peer nodes.
For information about diam-gateway metrics, see Oracle Communications Cloud Native Core, Unified Data Repository Users Guide.
nudr-migration
If a pod is in the pending state, it means resources are not present in the CNE and if a pod is in the ImagePullBackoff state, it means the image is not able to fetch from repository. Run the following command to check details:
kubectl describe pod <pod-name> -n
                    <namespace>
- check the logs and search for ERROR in logs
- Either the source UDR or target UDR is down. Verify logs.
- Check logs for DIAMETER_UNABLE_TO_COMPLY in CER/CEA messages.
- Check whether UDR/UDA messages are received from 4G UDR.
- Check whether K8S_HOST_IP port is same as an external IP address of Kubernetes node that you gave in affinity. If they are different, then you get DIAMETER_UNABLE_TO_COMPLY in CEA response.
For information about nudr-migration metrics, see Oracle Communications Cloud Native Core, Unified Data Repository Users Guide.
overload-manager
To troubleshoot errors related to overload-manager, consider the following points:
- In the global section, if the overloadmanager flag is disabled, then the overload manager REST APIs of Ingress Gateway and perf-info microservice do not load.
- If the overload manager data is not present in the common_configuration table, then ensure the overloadmanger flag is enabled at the global level.
- svcName configured at ocpolicymapping API should be taken from routesConfig section. If the svcName configured in policymapping is different from svcName configured in routesConfig, then overload manager does not trigger.
- To check specific load level of metric, check the perf-info logs. The perf-info logs contain load level of each metric.
- If the alerts are not raised for overload manager, then ensure the alerts are properly loaded and are not loaded from Prometheus.
On-demand migration Range Support
- By default, on-demand migration works for all key type and key values, if there is no change in the configurations. Check the REST configuration of global section for key type and key range.
- If on-demand migration does not trigger after key type and key range is set
through global configuration API, perform the following step:
- Check if the valid key type and key range that is mentioned in the configuration API contains the same key type and key range that is used for the test. Valid keys are Mobile Station Integrated Services Digital Network (MSISDN) or International Mobile Subscriber Identity (IMSI).
- If the on-demand migration range support feature is not used, you can set
the default key type and key range from the global configuration API as
below:
"keyType": "msisdn",
"keyRange": "000000-000000"
For information about on-demand migration metrics, see Oracle Communications Cloud Native Core, Unified Data Repository Users Guide.
4.4.2 Debugging Errors from Egress Gateway
- Check whether
global.egressis enabled. - Check whether Egress pod is running from kubectl. To check, run the
following command:
kubectl get pods -n <Release.name> - To enable the outgoing traffic using HTTPS, set the enableOutgoingHttps parameter as 'true'.
- Create unique certificates and keys for all Egress and respective Ingress NF's. It is the same as Ingress debugging.
Debugging Errors When SCP Integration is Enabled
UDR Egress Gateway route configurations are performed to route all the notifications through SCP, and the NRF traffic is sent directly to the NRF host. If the routing does not work, then configure the routes as follows:
Figure 4-40 Routes Config
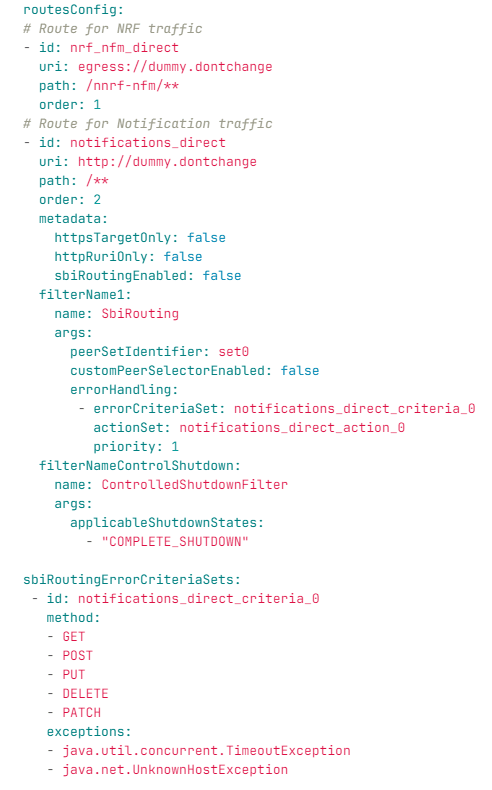
Note:
The above configuration is present as part of default values.If you want to send notifications through SCP, configure Egress Gateway as shown in the following image. If setId 0 is used, configure both httpConfigs and httpsConfigs as shown in the image. For setId having static host configuration for httpsConfigs (even if its not used), it is mandatory to configure this parameter using dummy values as shown in the image. If it is not configured, then the Egress Gateway log shows NullPointerException.
Figure 4-41 Sending Notification Through SCP
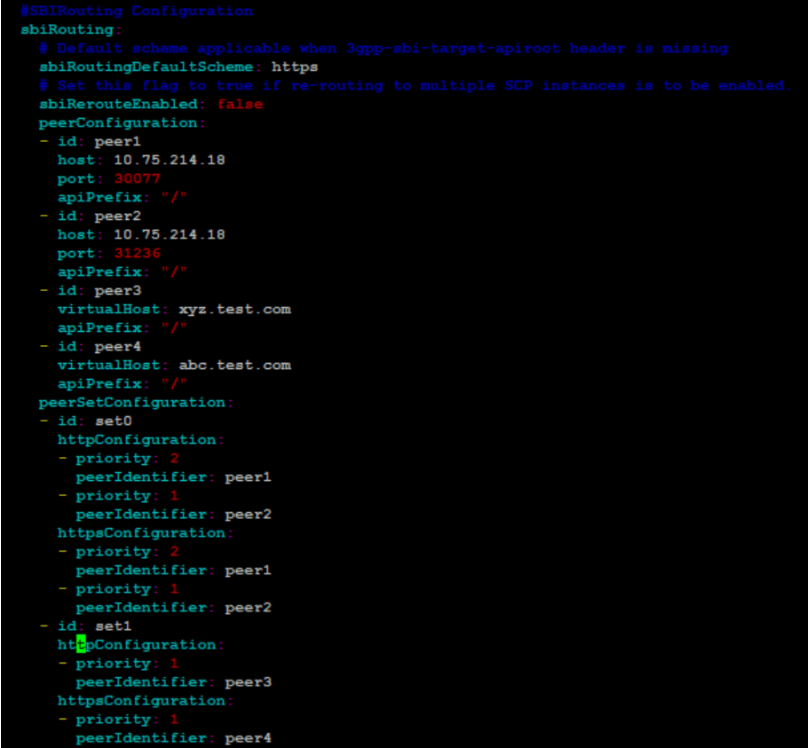
If it uses setId 1 or 2, enable Alternate Route service and configure proper host details for Egress Gateway to communicate with alternate route service. If configurations are not done as expected, then it gives 425 error, which is the default error configured for virtual FQDN lookup failure. If you see 503 or other 4xx errors, then it is because the actual endpoint or SCP is not reachable.
Figure 4-42 Using setId 1 or 2
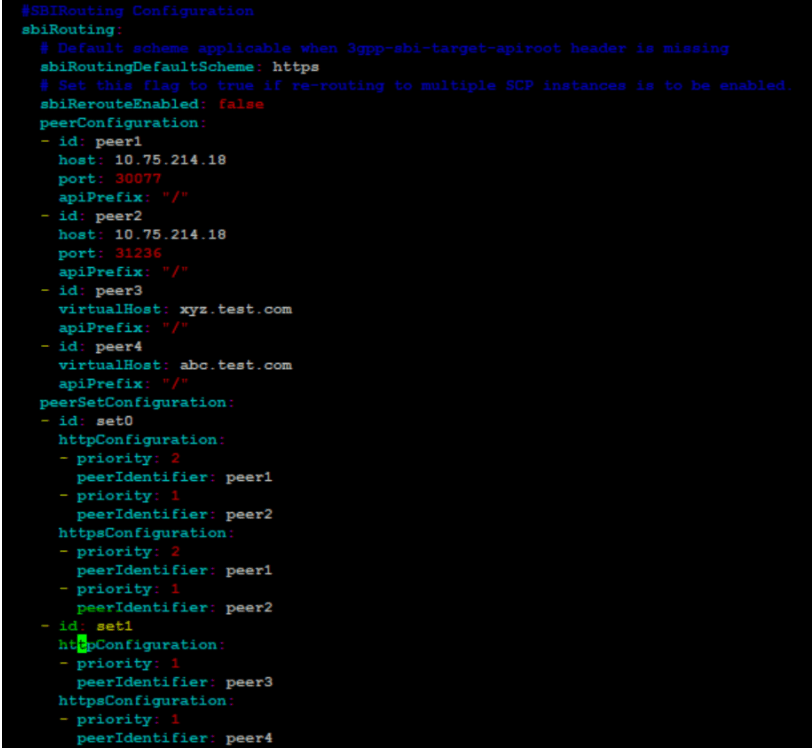
Figure 4-43 Using setId

Figure 4-44 Using setId 1 or 2 (cont..)
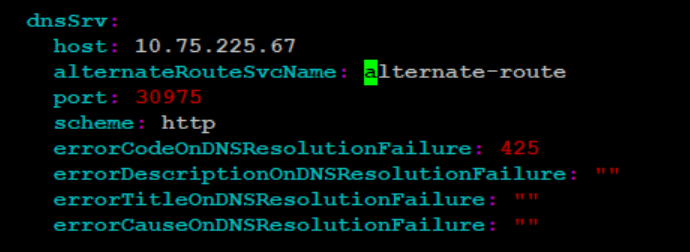
Figure 4-45 Using setId 1 or 2 (cont..)

Figure 4-46 SCP Retry

Also, ensure that scpRerouteEnabled is set to true.
Figure 4-47 scpRerouteEnabled set to true

Figure 4-48 DNS Srv Configuration

4.4.3 Debugging Errors from Ingress Gateway
- Check for 404 Error: If the request fails with 404 status
code with the following ProblemDetails, then there may be issues with the
routeConfig on the ingressgateway custom values
file.
{"title":"404 NOT_FOUND","status":404,"detail":"udr001.oracle.com: ingressgateway: NOT_FOUND: OUDR-IGWSIG-E183"}You must check the custom values.yaml file for the essential route configurations. If the essential route configurations are not present you must add the route configurations.
- Check for 503 Error: If the request fails with 503 status
code with "SERVICE_UNAVAILABLE" in Problem Details, then it means that the
nudr-drservice pod is not reachable due to some
reason.
You can confirm the same in the errors/exception logs of the ocudr-ingressgateway pod. Check for ocudr-nudr-drservice pod status and fix the issue.{"title":"Service Unavailable","status":503,"detail":"udr001.oracle.com: ingressgateway: Service Unavailable: OUDR-IGWSIG-E003","cause":"Encountered unknown host exception at IGW"}
4.4.4 Debugging Errors from nudr-config
- Check for 400 Error: If the following request fails with 400
status code with "404 Not Found", it indicates that the logging level
information is not present in the database or the microservice is not
enabled.
Figure 4-49 Checking for 400 Error
 If common_config_hook is unable to create configuration item for the common services like ingress-gateway, egress-gateway, or alternate-route, then the GET request for the logging gives the following response:
Figure 4-50 Response of Get Request for Logging
