3 Logging and Visualization Feature Configuration

This chapter describes the procedures for configuring the Logging and Visualization feature in the EAGLE.

3.1 Introduction

This chapter identifies the prerequisites and the procedures for configuring the EAGLE Logging and Visualization feature.

3.1.1 Front Panel LED Operation

On the SLIC card, the Ethernet Interface 3 (mapped to port C) is used for visualization connectivity.

The following table captures the LED operations required for the Ethernet interfaces:

Table 3-1 Front Panel LED Operation

IP Interface Status Signaling Link/connections Status on IP Port 3 (C) Signaling connection
PORT LED LINK LED
IP Port Not configured

N/A

Off

Off

Card Inhibited
Cable removed and/or not synced N/A Red Red
Sync Not configured Green Red
Sync and/or act-ip-lnk Configured but Visualization TCP connection CLOSED (open=no) or disconnected. Green Red
Visualization TCP Connection is ACTIVE (open=yes) and connected. Green Green
dact-ip-lnk N/A Green Red

3.1.2 Logging and Visualization Feature Prerequisites

Before accessing and configuring the dashboard for Logging and Visualization, the user needs to install and configure the following modules on the Visualization server:

  • Elasticsearch
  • Filebeat
  • Kibana

Note:

Time or clock must be sychronized with all Visualization servers.
3.1.2.1 Installation

This chapter describes the installation of Elasticsearch, Filebeat, and Kibana.

Note:

Before installing modules, the user must have permissions to install the software on the Visualization server.
3.1.2.1.1 Elasticsearch Installation
Perform the following steps to install Elasticsearch on the Visualization server:
  1. Create a directory to keep all visualization-related RPM(s) using the following command:
    mkdir visualization
  2. Enter the newly created directory in step 1 using the following command:
    cd visualization
  3. Download elasticsearch-7.6.2-x86_64.rpm using the following command:
    wget https://artifacts.elastic.co/downloads/elasticsearch/elasticsearch-7.6.2-x86_64.rpm

    Note:

    If the “wget” module is not installed in the system, install it using the “yum install wget” command.
  4. Download the published checksum of elasticsearch-7.6.2-x86_64.rpm using the following command:
    wget https://artifacts.elastic.co/downloads/elasticsearch/elasticsearch-7.6.2-x86_64.rpm.sha512
  5. Compare the SHA of the downloaded RPM and the published checksum using the following command:
    shasum -a 512 -c elasticsearch-7.6.2-x86_64.rpm.sha512

    Note:

    The output must be elasticsearch-{version}-x86_64.rpm: OK. Otherwise, there is an issue with RPM. It is recommended to install fresh RPM.
  6. Install RPM using the following command:
    sudo rpm --install elasticsearch-7.6.2-x86_64.rpm
  7. Verify whether or not the Elasticsearch RPM is successfully installed using the following command:
    rpm –qa | grep elasticsearch
3.1.2.1.2 Filebeat Installation
Perform the following steps to install Filebeat on the Visualization server:
  1. Download filebeat-7.6.2-x86_64.rpm using the following command:
    wget https://artifacts.elastic.co/downloads/elasticsearch/filebeat-7.6.2-x86_64.rpm

    Note:

    If the wget module is not installed in the system, install it using the yum install wget command.
  2. Download the published checksum of filebeat-7.6.2-x86_64.rpm using the following command:
    wget https://artifacts.elastic.co/downloads/elasticsearch/filebeat-7.6.2-x86_64.rpm.sha512
  3. Compares the SHA of the downloaded RPM and the published checksum using the following command:
    shasum -a 512 -c filebeat-7.6.2-x86_64.rpm.sha512

    Note:

    The output must be filebeat-{version}-x86_64.rpm: OK. Otherwise, there is an issue with RPM. It is recommended to install fresh RPM.
  4. Install RPM using the following command:
    sudo rpm --install filebeat-7.6.2-x86_64.rpm
  5. Verify whether or not the Filebeat RPM is successfully installed using the following command:
    rpm –qa | grep filebeat
3.1.2.1.3 Kibana Installation

Perform the following steps to install Kibana on the Visualization server:

  1. Create a directory to keep all the visualization related RPM(s) using the following command:
    mkdir visualization
  2. Enter the newly created directory in step 1 using the following command:
    cd visualization
  3. Download kibana-7.6.2-x86_64.rpm using the following command:
    wget https://artifacts.elastic.co/downloads/elasticsearch/kibana-7.6.2-x86_64.rpm

    Note:

    If the wget module is not installed in the system, install it using the yum install wget command.
  4. Download the published checksum of kibana-7.6.2-x86_64.rpm using the following command:
    wget https://artifacts.elastic.co/downloads/elasticsearch/kibana-7.6.2-x86_64.rpm.sha512
  5. Compare the SHA of the downloaded RPM and the published checksum using the following command:
    shasum -a 512 -c kibana-7.6.2-x86_64.rpm.sha512

    Note:

    The output must be kibana-{version}-x86_64.rpm: OK. Otherwise, there is an issue with RPM. It is recommended to install fresh RPM.
  6. Install RPM using the following command:
    sudo rpm --install kibana-7.6.2-x86_64.rpm
  7. Verify whether or not the Filebeat RPM is successfully installed using the following command:
    rpm –qa | grep kibana
3.1.2.2 Configuration

This chapter describes the configuration of Elasticsearch, Filebeat, and Kibana.

3.1.2.2.1 Elasticsearch Configuration
Perform the following steps to configure Elasticsearch after it is installed:
  1. Open the elasticsearch configuration file using the following command:
    vim /etc/elasticsearch/elasticsearch.yml
  2. Update the following fields in elasticsearch.yml:
    1. [Optional] cluster.name can be given any name to the cluster. By default my-application is the name of the cluster.
    2. [Optional] node.name can be given any name for elasticsearch node. By default node-x is the name of node, where x is 1,2,3..N.s.
    3. [Mandatory] network.host is the IP address of the given node.
    4. [Optional] http.port is the port on which elasticsearch would listen. By default Port 9200 is assigned to elasticsearch.
    5. [Mandatory] cluster.initial_master_nodes is the most important setting while starting the cluster first time. It is the IP address of the node which is selected as Master node first time.
    6. [Mandatory] discovery.zen.ping.unicast.hosts is the list of IP address of nodes in elasticsearch.
    7. Update the following parameters of the nodes:
      1. For Master node, set node.master to true (default).
      2. For Data node, set node.data to true.
      3. For Coordinating node, set node.master, node.data and node.ingest to false.

        The following example shows the sample configuration:
        cluster.name: my-application
        node.name: node-1
        path.data: /var/lib/elasticsearch
        path.logs: /var/log/elasticsearch
        network.host: 10.75.219.178
        http.port: 9200
        cluster.initial_master_nodes: ["10.75.219.178"]
        discovery.zen.ping.unicast.hosts:
        ["10.75.219.178","10.75.219.5","10.75.219.33","10.75.219.242","10.75.219.169"]

        Note:

        • For 8 node cluster, it is recommended that 3 must be Master node, 4 must be Data node, and 1 must be Coordinating node.
        • If no node parameter is given, it means that it is the master node (default).
  3. Restart elasticsearch using the following command:
    Systemctl restart elasticsearch.service
  4. Verify that cluster Id must be assigned after restarting the cluster.
    1. Open https:/IP_ADDRESS_OF_NODE/9200 in the browser.
    2. Verify that cluster_uuid must be assigned to the cluster.
      The following example shows the sample verification:
      {  
          "name" : "node-1",  
          "cluster_name" : "my-application",  
          "cluster_uuid" : "q3P_AzG1SBmL8xjIau_RSg",  
          "version" : {    
              "number" : "7.6.2",    
              "build_flavor" : "default",    
              "build_type" : "rpm",    
              "build_hash" : "ef48eb35cf30adf4db14086e8aabd07ef6fb113f",    
              "build_date" : "2020-03-26T06:34:37.794943Z",    
              "build_snapshot" : false,    
              "lucene_version" : "8.4.0",   
              "minimum_wire_compatibility_version" : "6.8.0",   
              "minimum_index_compatibility_version" : "6.0.0-beta1"  
      },  
      "tagline" : "You Know, for Search"
      }
3.1.2.2.2 Filebeat Configuration
Perform the following steps to configure Filebeat after it is installed:
  1. Open the Filebeat configuration file using the following command:.
    vim /etc/filebeat/filebeat.yml
  2. Update the following fields in elasticsearch.yml:
    1. [Mandatory] Update the output.elasticsearch parameter for the filebeat output pipeline.
      1. hosts is the the IP address of elasticsearch server.
      2. Index is to create the index with custom name on elasticsearch server.
      3. worker is the number of worker thread which push data into elasticsearch server.
      4. bulk_max_size is used for batch processing of the document.
        output.elasticsearch:  
            hosts: ["http://10.75.219.63:9200"]  
            index: "eagledata-%{+yyyy.MM.dd}"  
            worker: 12 
            bulk_max_size: 200
    2. [Mandatory] Update the filebeat.input parameter for creating the Filebeat TCP server.
      1. host is the IP address of filebeat server.
      2. timeout is the time interval to refresh the TCP connection in case TCP connection is idle.
        filebeat.inputs:
        - type: tcp  
          host: "10.75.219.63:9000"  
          timeout: 86400s   
        
          # Change to true to enable this input configuration.  
          enabled: true  
          json.keys_under_root: true      
          json.add_error_key: true
    3. [Mandatory] Add decode_json_fileds and drop_filed configuration in processors section to decode the message as JSON and drop the extra fields from the JSON.
      processors:  
          - add_host_metadata: ~  
          - add_cloud_metadata: ~  
          - decode_json_fields:      
              fields: ["message"]      
              process_array: false      
              max_depth: 1      
              target: ""      
              overwrite_keys: true      
              add_error_key: true  
          - drop_fields:      
              fields: ["message","ecs","log","input","host","os","agent"]
    4. [Mandatory] Set setup.ilm.enabled: false to enable the setting to create index pattern with custom name like eagledata.
  3. Restart the filebeat service using the following command:
    Systemctl restart filebeat.service
  4. Verify that filebeat service must be active using the following command:
    Systemctl status filebeat.service.
3.1.2.2.3 Kibana Configuration
Perform the following steps to configure Kibana after it is installed:
  1. Open the kibana configuration file using the following command:
    vim /etc/kibana/kibana.yml
  2. Update the following fields in kibana.yml:
    1. [Mandatory] server.host is the IP address of the host.
    2. [Mandatory] elasticsearch.hosts is the IP address of the host in which elasticsearch module is running. In our architecture, Elasticsearch, kibana and filebeat will be running on the same instance/VM.
    3. [Mandatory] logging.dest: is used to redirect the log of kibana. stdout is the default option.
      The following example shows the sample configuration:
      server.host: "10.75.219.178" 
      elasticsearch.hosts: ["http://10.75.219.178:9200"]
      logging.dest: /var/log/kibana/kibana.log

      Note:

      Before redirecting the log, verify that the /var/log/kibana directory exists. Otherwise, kibana cannot restart.
  3. Restart kibana using the following command:

    Systemctl restart kibana.service

  4. Verify that kibana is successfully started using the following command:
    Systemctl status kibana.service

3.2 Dashboard

The chapter describes the procedures to access the default dashboard, create index patterns, create a new visualization, and create a new dashboard.

3.2.1 Accessing Default Dashboard

Perform the following step to access the default dashboard:
  • Access the default dashboard from the browser using the following URL:
    http://IP:PORT where IP is the coordinating node IP in which kibana is installed and Port is 5601 (default).

    Example: http://10.75.214.146:5601/

    The following figure shows the Home page of the dashboard:

    Figure 3-1 Dashboard Home Page


    Dashboard Home Page

3.2.2 Creating Index Patterns

Refer to the standard Kibana product documentation for information on how to create index patterns.

3.2.3 Creating a Visualization

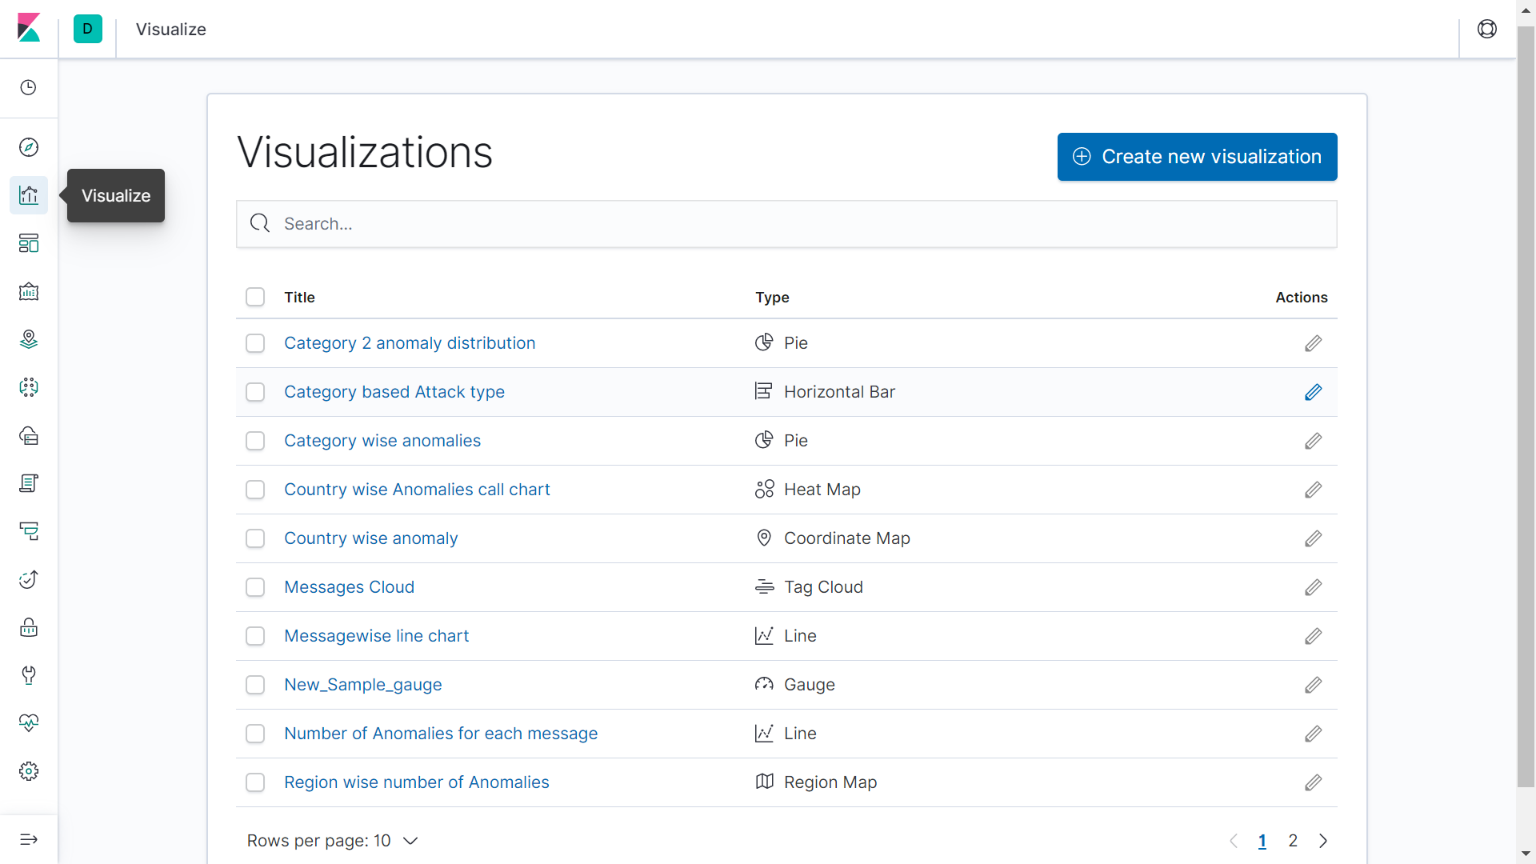
Perform the following steps to create a new visualization for the dashboard after an index pattern is created:
  1. Click the Visualize button on the left panel, and then click the Create new visualization button, as shown in the following figure:

    Figure 3-2 Visualize Page


    Visualize Page
  2. Select the desired type of visualization that you would like to create, as shown in the following figure:

    Figure 3-3 New Visualization


    New Visualization
  3. Save the visualization once it is created.

3.2.4 Creating a Dashboard

Perform the following steps to create a dashboard:
  1. Click the Dashboard button on the left panel, and then click the Create new dashboard button, as shown in the following figure:

    Figure 3-4 Create New Dashboard


    Create New Dashboard
  2. Click the Add button to add a visualization that is already created in the dashboard, as shown in the following figure:

    Figure 3-5 Editing New Dashboard


    Editing New Dashboard
  3. Save the dashboard after adding the required visualizations.
    Once the dashboard is created, you can view different visualizations that you have added in the dashboard, as shown below:

    Region wise Anomalies - This visualization depicts the total number of anomalies suspected based on a region.

    Figure 3-6 Region Wise Anomalies Sample Dashboard


    Region Wise Anomalies Sample Dashboard
    Category wise anomalies - This visualization depicts the total number of anomalies suspected based on the opcode category wise.

    Figure 3-7 Category Wise Anomaly Sample Dashboard


    Category Wise Anomaly Sample Dashboard

    Other Sample Dashboards are shown in the following figure:

    Figure 3-8 Other Sample Dashboards


    Other Sample Dashboards

3.2.5 Importing a Dashboard

Perform the following steps to import a dashboard:
  1. Open kibana using the following URL:
    https:/IP_ADDRESS_CORDINATING_NODE:5601
  2. Go to the Management page, as shown in the following figure:

    Figure 3-9 Management Page


    Management Page
  3. Click Saved Objects under kibana, as shown in the following figure:

    Figure 3-10 Saved Objects Under Kibana


    Saved Objects Under Kibana
  4. Click the Import button, as shown in the following figure:

    Figure 3-11 Import Dashboard


    Import Dashboard
  5. Select the default dashboard file.

    After the dashboard file is successfully updated, the default dashboard is ready to use.