Dual SIM Charts
When a Cloud Connector starts up with both SIMs inserted in the system and the active (in-use) SIM changes, the Network tab's graphs display these changeover events for clear tracking.
Cellular Bandwidth Usage
Figure 7-1 SIM Change in the Cellular Bandwidth Usage chart
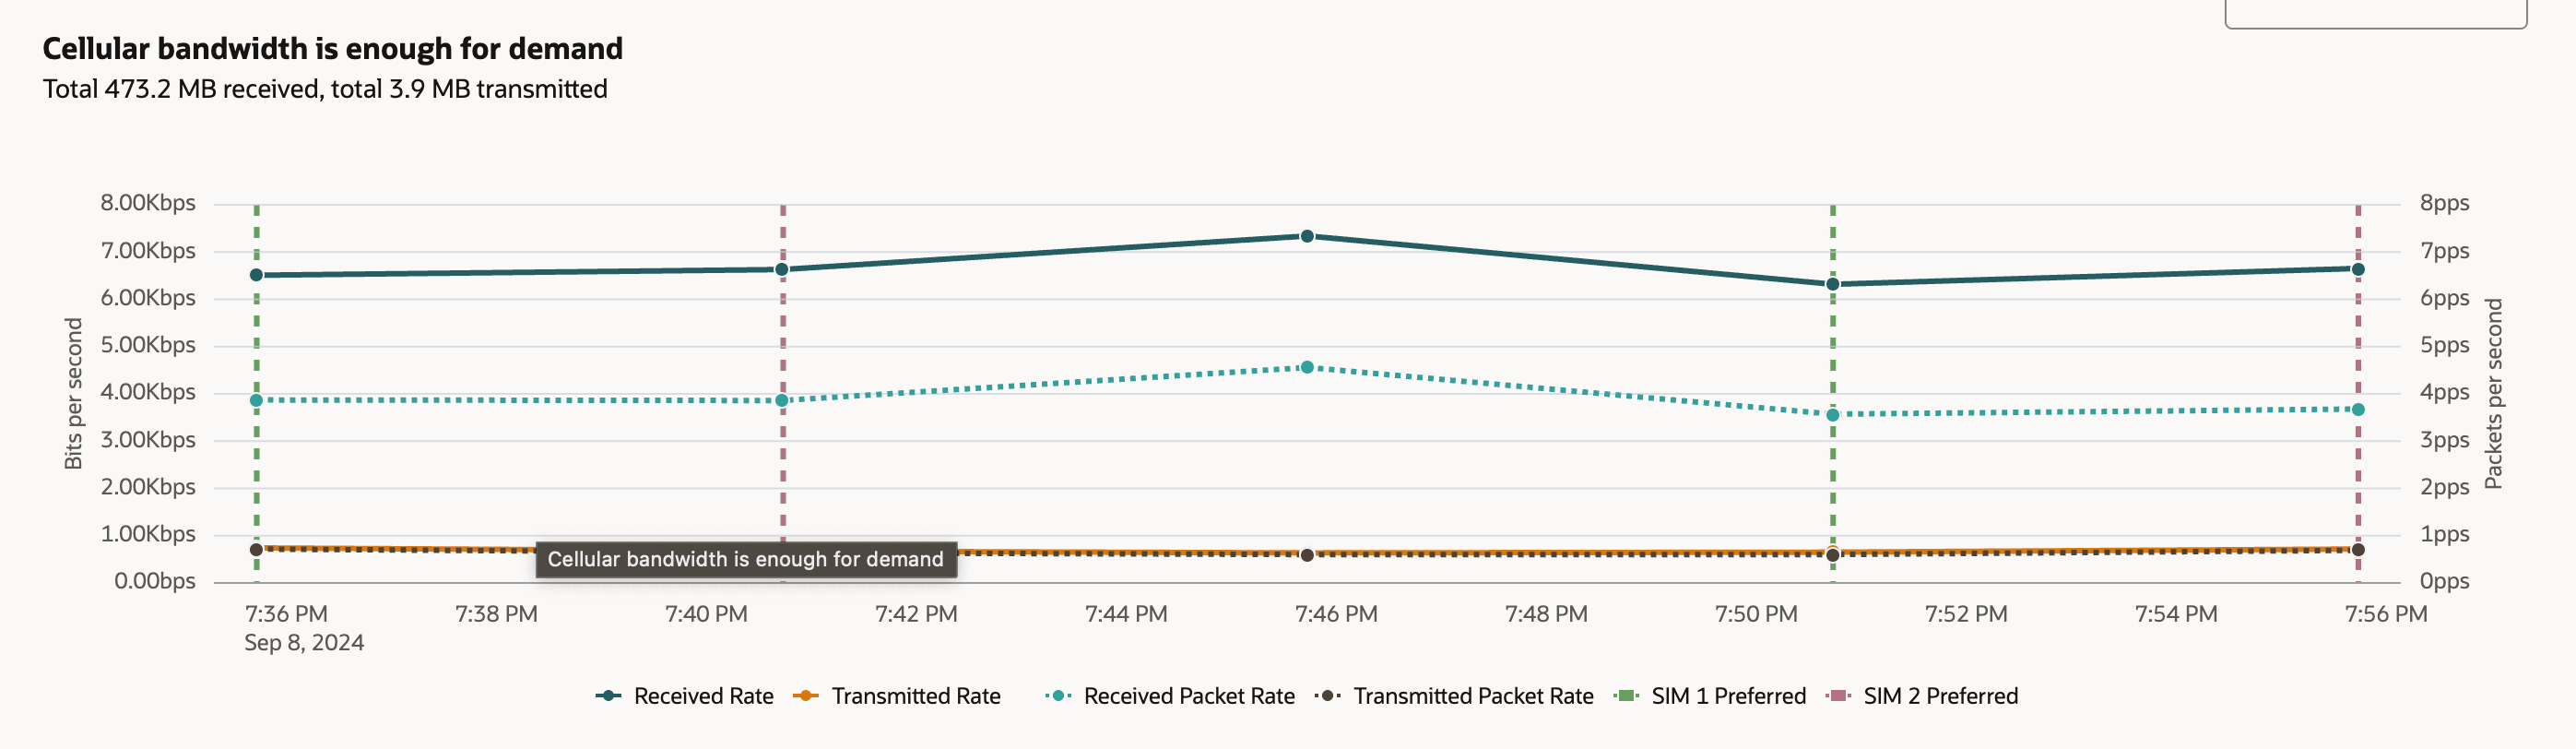
These SIM switching indicators provide valuable context for troubleshooting and analyzing connectivity. For example, if users observe performance issues or connectivity drops, the SIM switch markers help pinpoint whether these issues coincide with changes in the active SIM. In this particular chart, there is no noticeable impact on bandwidth or packet rates at the moments of SIM card changeover, demonstrating that the device handles the transitions smoothly without interrupting ongoing network activity.
SIM Tracking in the Cellular MNO Usage Chart
Figure 7-2 SIM Change in the MNO Usage Chart
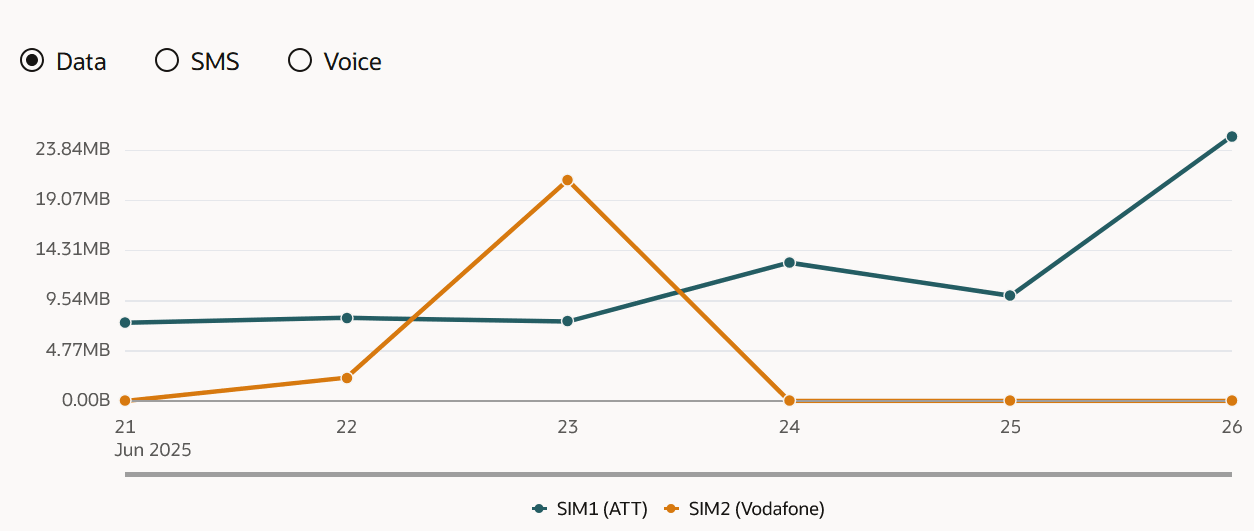
This type of visualization helps users better understand and track data consumption patterns across multiple providers. By reviewing these trends, users can identify which SIM is responsible for higher usage, evaluate the effectiveness of network switching strategies, and troubleshoot issues related to data consumption. This information can also assist with managing data plan allocations and keeping track of carrier-specific network performance.