2 Home Tab Dashboard Operations
The Oracle® Enterprise Session Border Controller (E-SBC) provides a web-based dashboard on the Home tab that can display SIP data statistics to help you monitor and manage the system, for example, to see SIP Media Flows and Current Memory Usage. The E-SBC collects only SIP data for the dashboard widgets, including the default CPU and Memory widgets. For this reason, you must set up a valid SIP configuration before the E-SBC can display any data on a dashboard widget.
- Highest CPU Usage
- Current Memory Usage
- Historical Memory Usage
Use the following controls to customize the Home page display.
Refresh—Updates all of the widgets on the Dashboard.
Add Widget—Displays a list of widgets that you can add to the Dashboard.
Reset—Resets the Dashboard to display the default widgets. All other widgets are removed from the Dashboard.
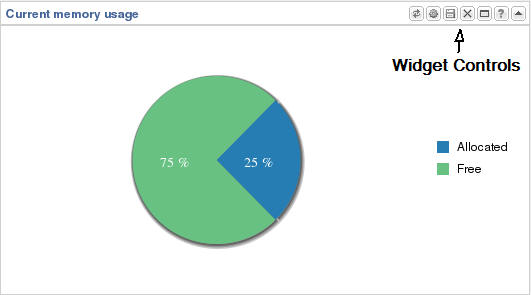
Use the icons in the upper right corner of the widget to perform specific tasks. Roll the mouse over the icon for a description of the function.

Note that the operation of widgets, such as those that require the SIP Session module, may affect system performance. The system displays a warning when you add a widget that may affect performance. Oracle recommends adding such widgets at a time when the performance impact will not degrade service.