2 Dashboard Tab Operations
The Oracle® Enterprise Session Border Controller (E-SBC) provides a web-based Dashboard that can display SIP data statistics to help you monitor and manage the system. The E-SBC collects only SIP data for the dashboard widgets, including the default CPU and Memory widgets. For this reason, you must set up a valid SIP configuration before the E-SBC can display any data on a dashboard widget.
- Highest CPU Usage
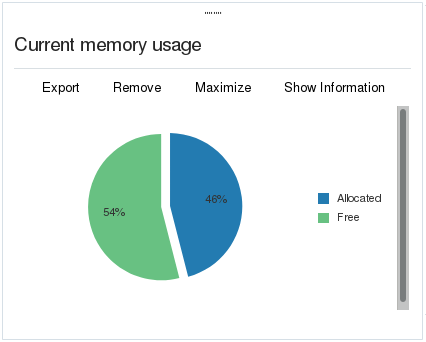
- Current Memory Usage
- Historical Memory Usage
- Alarms
The Dashboard page provides the following controls to manage the widgets:
Refresh—Updates all of the widgets on the Dashboard.
Add Widget—Displays a list of widgets that you can add to the Dashboard.
Reset—Resets the Dashboard to display the default widgets and removes all other widgets from the Dashboard.
Each widget contains the particular controls that you need to manage the widget. The controls display as text until you hover over one. Upon hover, the text becomes a button that you click to perform a task. The following screen capture shows Refresh as a button upon hover, while Settings, Export, Removed, and Maximize remain static text.

- Export—Download the data displayed in the Widget.
- Remove—Remove the Widget from the dashboard. When you remove all Widgets from the dashboard, the GUI displays the following message: " Your dashboard is empty, please add a widget or reset to restore the original dashboard."
- Settings—Set the data sampling parameters for the Widget.
- Maximize—Display the Widget in ful-screen size.
- Show Information—Display data in a graph or table.
Note that the operation of widgets, such as those that require the SIP Session module, may affect system performance. The system displays a warning when you add a widget that may affect performance. Oracle recommends adding such widgets at a time when the performance impact will not degrade service.
Add a Dashboard Widget
You can add up to 18 widgets to the Web GUI Dashboard to display SIP and System statistics to help you monitor and manage the system.
The system does not require a re-boot after performing the following procedure.
Configure Data Sampling Settings for a Dashboard Widget
- Confirm that the widget that you want to configure is on the Dashboard. See Add a Widget.
- Click the Home tab.
- On the Widget, click Maximize, and click Settings.
- Select a widget display refresh frequency from the Auto-Refresh Interval (seconds) drop down list.
- If the widget displays the Table Name drop-down list, select a data sampling increment for the widget display.
- Click OK.
- Click Close.
View A Widget That is Not on the Dashboard
The Dashboard is limited to displaying a maximum of 18 widgets. To see a widget that is not on the Dashboard, use the Widgets link on the Monitoring page to see a list of all of the Widgets.