Packet Trace Scenarios
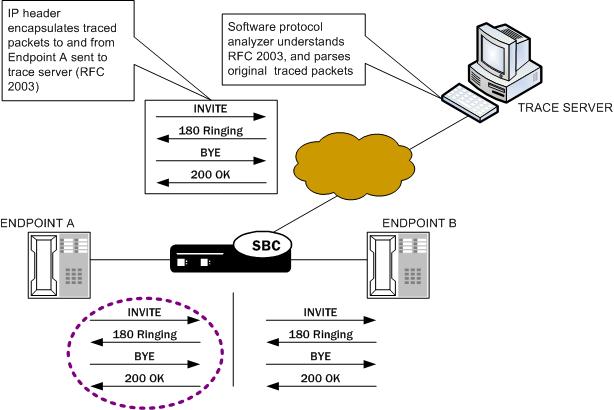
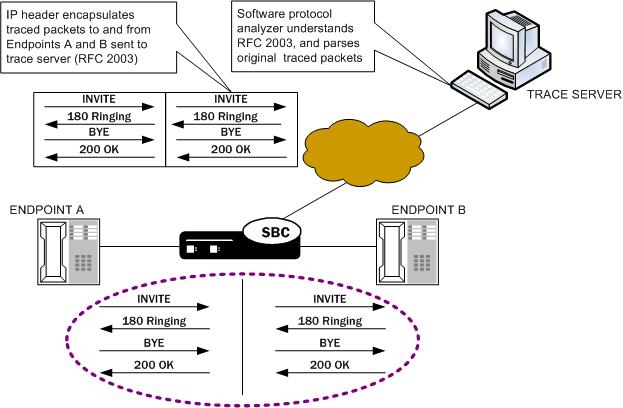
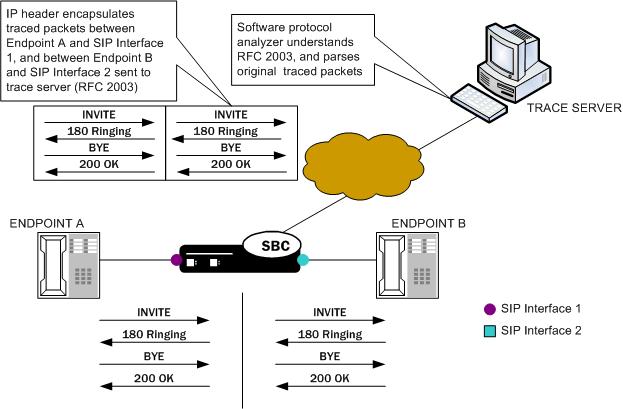
This section describes three possible ways that you might use the packet trace feature. You can examine communications sent to and from one endpoint, sent between two endpoints, or sent between ingress and/or egress Oracle® Enterprise Session Border Controller interfaces to endpoints.
Packet Trace for One Endpoint
When you use the packet-trace remote <state> command, the Oracle® Enterprise Session Border Controller sets up packet tracing for one endpoint. The Oracle® Enterprise Session Border Controller collects and replicates the packets to and from one endpoint. To enable this kind of trace, you set up one packet trace using the packet-trace command.
The commands you carry out for packet-trace remote would take the following form:
ORACLE# packet-trace remote start F01:0 <IP address of Endpoint A>
The commands you carry out for packet-trace local on platforms that use the DPDK datapath take the following form:
ORACLE# packet-trace local start F01:0 <"host IP address of Endpoint A">The commands you carry out for packet-trace local on all other platforms take the following form:
ORACLE# packet-trace local F01:0 <"host IP address of Endpoint A">Packet Trace for Both Call Legs
If you want to trace both sides (both call legs), then you must set up individual traces for each endpoint—meaning that you would initiate two packet traces. The results of the trace will give you the communications both call legs for the communication exchanged between the endpoints you specify.
If you initiate a packet trace for both endpoints that captures both signaling and media, the signaling will be captured as usual. However, RTP will only be traced for the ingress call leg. This is because the Oracle® Enterprise Session Border Controller performs NAT on the RTP, which means it cannot be captured on the egress call leg.
The commands you carry out for packet-trace remote would take the following form:
ORACLE# packet-trace remote start F01:0 <IP address of Endpoint A>
ORACLE# packet-trace remote start F02:0 <IP address of Endpoint B>
The commands you carry out for packet-trace local would take the following form:
ORACLE# packet-trace local F01:0 <"host IP address of Endpoint A">
ORACLE# packet-trace local F02:0 <"host IP address of Endpoint B">
Packet Trace for a Signaling Address
You can perform a packet trace for addresses internal to the Oracle® Enterprise Session Border Controller; this can be the address, for example, of a SIP interface. Using signaling interface addresses puts the emphasis on the Oracle® Enterprise Session Border Controller rather than on the endpoints by allowing you to view traffic from specified interfaces.
The commands you carry out for packet-trace remote would take the following form:
ORACLE# packet-trace remote start F01:0 <IP address of Oracle® Enterprise Session Border Controller interface1>
ORACLE# packet-trace remote start F02:0 <IP address of Oracle® Enterprise Session Border Controller interface2>
The commands you carry out for packet-trace local on platforms that use the DPDK datapath take the following form:
ORACLE# packet-trace local start F01:0 <"host IP address of Oracle® Enterprise Session Border Controller interface1">
ORACLE# packet-trace local start F02:0 <"host IP address of Oracle® Enterprise Session Border Controller interface2">
The commands you carry out for packet-trace local on all other platforms take the following form:
ORACLE# packet-trace local F01:0 <"host IP address of Oracle® Enterprise Session Border Controller interface1">
ORACLE# packet-trace local F02:0 <"host IP address of Oracle® Enterprise Session Border Controller interface2">
Note:
The system does not support egress RTP capture with Transcoding NIU