4 OCNWDAF Benchmarking Testing
This chapter describes various testing scenarios and the results obtained by running performance tests on Oracle Communications Networks Data Analytics Function.
A series of scripts is created to simulate the entire flow of CAP4C model execution and to extract the performance metrics of the models created. The scripts perform the following tasks:
- Insert synthetic data into the database.
- Call the Model Controller API to train the models and perform the prediction tasks.
- Retrieve the metrics from Jaeger.
- Delete the synthetic data in the database.
The table below displays the expected performance metrics (per model) on completion of the flow of CAP4C model executions:
Table 4-1 Expected Performance Metrics
| Metric Name | Expected Value |
|---|---|
| UE Mobility models trained | 6 |
| UE Mobility model trained max time | 275202.415ms |
| UE Mobility model trained avg time | 56976.9326ms |
| UE Mobility model trained min time | 2902.839ms |
| NF Load models trained | 5 |
| NF Load model trained max time | 9606.666 ms |
| NF Load model trained avg time | 8852.0124 ms |
| NF Load model trained min time | 8272.789 ms |
| Abnormal behavior models trained | 8 |
| Abnormal behavior m model trained max time | 8297.173 ms |
| Abnormal behavior m model trained avg time | 7504.53 ms |
| Abnormal behavior m model trained min time | 7094.006 ms |
| Network Performance model trained | 4 |
| Network Performance model trained max time | 245966 ms |
| Network Performance model trained avg time | 69722.4 ms |
| Network Performance model trained min time | 8894 ms |
Script Execution
- SQL script to insert data and call the Model Controller API.
- Script to extract Jaeger Metrics and delete synthetic data from the database.
A docker image is provided with the scripts, it can be deployed in the Kubernetes cluster where all the OCNWDAF services are running. The docker image is provided in the images folder of OCNWDAF installer.
-
To create the values.yml file, use the following information:
global: projectName: nwdaf-cap4c-initial-setup-script imageName: nwdaf-cap4c/nwdaf-cap4c-initial-setup-script imageVersion: 23.4.0.0.0 config: env: APPLICATION_NAME: nwdaf-cap4c-initial-setup-script APPLICATION_HOME: /app deploy: probes: readiness: enabled: false liveness: enabled: false - To deploy and run the image, create the values.yml file, run the following command:
$ helm install <deploy_name> <helm_chart> -f <path_values_file>/values.yml -n <namespace_name>For example:
$ helm install nwdaf-cap4c-initial-setup-script https://artifacthub-phx.oci.oraclecorp.com/artifactory/ocnwdaf-helm/nwdaf-cap4c-deployment-template-23.2.0.tgz -f <path_values_file>/values.yml -n <namespace_name> - A container will be running inside the Kubernetes cluster. Identify the container and note down the name of the container for reference in subsequent steps. Run the following command to obtain pod information:
$ kubectl get pods -n <namespace_name>For example:
NAME READY STATUS RESTARTS AGE nwdaf-cap4c-initial-setup-script-deploy-64b8fbcd9-2vqf9 1/1 Running 0 55s - Run the following command to access the container:
$ kubectl exec -n <namespace_name> <pod_name> -it bash -
Once inside the container, navigate to the path
/app/performance. The scripts are located in this path, follow the steps below to run the scripts:-
SQL script to insert data and to call the model controller api: This script handles the insertion of the synthetic data into the DB. Once all the tables are inserted, a process runs to call the Model Controller API. The models are generated and execution tasks are created to use the models. Run the script:
$ python3 performance/integration_script.py -h <host> -p <path> -t <type> -n <number_tests>Table 4-2 Parameters
Parameter Description Default Value -h The Model controllers host name or address localhost -p Path of the .csvfiles that have to create the request to controller../integration/data/ -t The files extension to read the data to generate payloads CSV -n Number of tests flows that the script will do. The recommended value of number of tests to be performed per pod. 10 Note:
If the parameters are not set, the script uses the default values.Example:
$ python3 integration_script.py -h http://cap4c-model-controller.ocnwdaf-ns:8080 -p /app/performance/integration/data/ -t CSV -n 10Sample output:
Figure 4-1 Sample Output

-
Script to extract Jaeger Metrics and to subsequently delete synthetic data from Database: This script extracts the metrics and then deletes the dummy data from the DB. Run the script:
$ python3 performance/report_script.py -h <host> -p <port> -m <options> -u <prefix> -y <types>Table 4-3 Parameters
Parameter Description Default Value -h Jaeger host name or address localhost -p Jaeger UI port 16686 -m Available options: ABNORMAL_BEHAVIOUR, NF_LOAD, and so on. all -u Set a URL prefix if needed, such as '/blurr7/jaegerNA -y Type of execution: TRAIN, EXECUTION, all. all Note:
If the parameters are not set, the script uses the default values.For example:
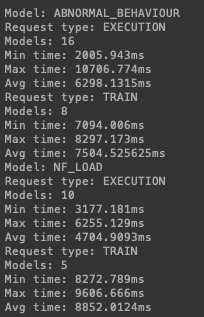
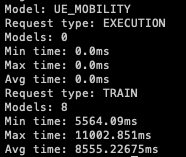
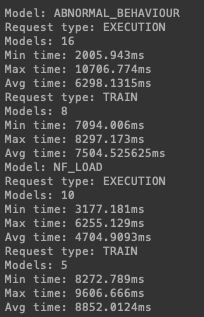
$ python report_script.py -t occne-tracer-jaeger-query.occne-infra -p 80 -u /blurr7/jaegerSample output:
Figure 4-2 Sample Output

Figure 4-3 Sample Output

-
Network Performance Analytics
The Network Performance Analytics provides various insights about the performance of a network. This information can be used for devising and deciding network strategies. The Network Performance data collected by the OCNWDAF can be used for network optimization, optimal resource allocation, and service assurance.
Predictive Analytics
The predictive analysis of Network Performance parameters in OCNWDAF facilitates the implementation of preemptive actions for improving the Network Performance by predicting values of attributes that impact the performance of a network.
Machine Learning (ML) Models and Performance Metrics
Predictive analysis of Network Performance parameters is based on time series prediction of Network Performance attributes:
Table 4-4 Network Performance Attributes
| Attributes | Input or Output to Model |
|---|---|
| TimeStamp | Input |
| sessSuccRatio | Output (predicted) |
| hoSuccRatio | Output (predicted) |
| gnbComputingUsage | Output (predicted) |
| gnbMemoryUsage | Output (predicted) |
| gnbDiskUsage | Output (predicted) |
| gnbActiveRatio | Output (predicted) |
The Long Short-Term Memory (LSTM) algorithm is a widely used Machine Learning (ML) algorithm for time-series prediction. Four LSTM models with some variations in their tuning are used for predicting the Network Performance parameters in OCNWDAF and integrated with CAP4C. The following table provides information on the base model, training time, and tuning parameters:
Table 4-5 LSTM
| Base Model | Training Time (MS) | Tuning Parameters | ||
|---|---|---|---|---|
| Epochs | Optimizer Used | Batch Size | ||
| LSTM | 245966 | 100 | Adm | 1 |
| LSTM | 8894 | 20 | Sgd | 32 |
| LSTM | 11840 | 50 | AdaMax | 32 |
| LSTM | 12189.6 | 50 | Adadelta | 32 |
Quality of Service (QoS) Sustainability Analytics
The Quality of Service (QoS) Sustainability Analytics information includes QoS change statistics in a target area for a specified period. Improving QoS in a network comprises reducing packet loss and latency by managing network data and traffic. Quality of Service (QoS) Sustainability Analytics information is used to manage network resources optimally.
QoS Predictions
Predictive analytics includes information about anticipated QoS changes at a future time in a target area. It leverages information obtained by historic network service usage practices.
Machine Learning Models and Performance Metrics Per QoS Model
The attributes listed in the table below are used for QoS predictions:
Table 4-6 Attributes
| Attributes | Input/Ouput to Model |
|---|---|
| load_timestamp | Input |
| snssai | Input |
| nr_cell_id | Input |
| 5qi | Input |
| number_of_released_active_qos_flow | Output (QoS prediction) |
Machine Learning (ML) Models for QoS Prediction and Performance Metrics
Listed below are the ML models used for QoS predictions and performance metrics:
- Random Forest Regressor
- K Nearest Neighbour (KNN)
- Decision Tree
QoS Prediction Models
Table 4-7 QoS Prediction Models
| Quality of Service (QoS) Prediction | |
|---|---|
| Model/Algorithm | Training Time in Millisec. |
| Random Forest Regrec ssor | 3539.15 |
| K Nearest Neighbour (KNN) | 17.48 |
| Decision Tree | 33.18 |
| Model Training Time and Total Models | |
| Total Models | 3 |
| Minimum Time (ms) | 17.48 |
| Maximum Time (ms) | 3539.15 |
| Average Time (ms) | 1196.60 |
Down Link (DL) Throughput Prediction
The Down Link Throughput is an important and effective performance indicator for determining the user experience. Hence, the prediction of Down Link Throughput plays a vital role in network dimensioning.
ML Models and Performance Metrics Per DL Throughput Model
The attributes listed in the table below are used for DL Throughput prediction:
Table 4-8 Attributes
| Attributes | Input/Ouput to Model |
|---|---|
| load_timestamp | Input |
| snssai | Input |
| nr_cell_id | Input |
| 5qi | Input |
| downlink_throughput | Output (DL Throughput prediction) |
Machine Learning (ML) Models for DL Throughput Prediction and Performance Metrics
Listed below are the ML models used for QoS predictions and performance metrics:
- Random Forest Regressor
- K Nearest Neighbour (KNN)
- Decision Tree
DL Throughput Prediction Models
Table 4-9 DL Throughput Prediction Models
| DL Throughput Prediction | |
|---|---|
| Model/Algorithm | Training Time in Millisec. |
| Random Forest Regressor | 3478.50 |
| K Nearest Neighbour (KNN) | 24.70 |
| Decision Tree | 33.54 |
| Model Training Time and Total Models | |
| Total Models | 3 |
| Minimum Time (ms) | 24.70 |
| Maximum Time (ms) | 3478.50 |
| Average Time (ms) | 1170.91 |
NWDAF ATS PerfGo Performance Results
Below are the results from the PerfGo tool after running performance tests on NWDAF ATS:
- Create Subscription
- Update Subscription
- Delete Subscription
Table 4-10 Create Subscription
| Request Base | Total | Success | Failure | Rate | Latency | Average Rate | Average Latency |
|---|---|---|---|---|---|---|---|
| ue-mobility-create.create-ue-mob-statistics.[CallFlow] | 622 | 417 | 194 | 16.0 | 734.3ms | 9.6 | 1030.6ms |
| ue-mobility-create.create-ue-mob-predictions.[CallFlow] | 637 | 430 | 196 | 11.0 | 749.6ms | 9.8 | 996.0ms |
| abnormal-behaviour-create.create-ab-predictions.[CallFlow] | 781 | 39 | 731 | 7.0 | 1145.5ms | 12.1 | 806.0ms |
| abnormal-behaviour-create.create-ab-statistics.[CallFlow] | 748 | 34 | 703 | 5.0 | 1201.1ms | 11.6 | 830.4ms |
| slice-load-level-create.create-sll-statistics.[CallFlow] | 295 | 32 | 252 | 13.0 | 860.6ms | 4.6 | 2256.8ms |
| slice-load-level-create.create-sll-predictions.[CallFlow] | 304 | 27 | 266 | 14.0 | 842.8ms | 4.7 | 2177.7ms |
| nf-load-create.create-nf-load-predictions.[CallFlow] | 691 | 247 | 434 | 9.0 | 813.7ms | 10.6 | 911.7ms |
| nf-load-create.create-nf-load-statistics.[CallFlow] | 705 | 260 | 434 | 11.0 | 805.9ms | 10.9 | 892.0ms |
Table 4-11 Update Subscription
| Request Base | Total | Success | Failure | Rate | Latency | Average Rate | Average Latency |
|---|---|---|---|---|---|---|---|
| ue-mobility-update.update-ue-mob.[CallFlow] | 80 | 80 | 0 | 3.0 | 953.4ms | 1.4 | 870.7ms |
| abnormal-behaviour-update.update-ab.[CallFlow] | 80 | 80 | 0 | 3.0 | 577.1ms | 1.5 | 555.8ms |
| slice-load-level-update.update-sll.[CallFlow] | 70 | 70 | 0 | 2.0 | 4119.4ms | 1.1 | 1441.4ms |
| nf-load-update.update-nf-load.[CallFlow] | 73 | 73 | 0 | 2.0 | 610.3ms | 1.3 | 552.4ms |
Table 4-12 Delete Subscription
| Request Base | Total | Success | Failure | Rate | Latency | Average Rate | Average Latency |
|---|---|---|---|---|---|---|---|
| ue-mobility-delete.delete-ue-mob.[CallFlow] | 80 | 80 | 0 | 6.0 | 799.4ms | 1.4 | 611.2ms |
| abnormal-behaviour-delete.delete-ab.[CallFlow] | 80 | 80 | 0 | 2.7 | 577.1ms | 1.4 | 591.0ms |
| slice-load-level-delete.delete-sll.[CallFlow] | 65 | 65 | 0 | 2.0 | 777.3ms | 1.2 | 890.6ms |
| nf-load-delete.delete-nf-load.[CallFlow] | 59 | 59 | 0 | 2.0 | 474.6ms | 1.0 | 536.1ms |
User Data Congestion (UDC)
UDC Descriptive Analytics Metrics
The Subscription service directly calls the Reporting Service to generate reports. The JMeter is used to test the Reporting Service APIs.
URL: http://nwdaf-cap4c-reporting-service:8080/v1/userdatacongestion/descriptive
Table 4-13 UDC Descriptive Metrics
| Request Type | Threads | Range | Avg. Latency |
|---|---|---|---|
| GET | 100 | 1 hour | 432 ms |
| GET | 200 | 1 hour | 434 ms |
| GET | 100 | 24 hours | 604 ms |
| GET | 200 | 24 hours | 1908 ms |
UDC Analytics Information Metrics
The Analytic Information service directly calls the Reporting Service to pull the available reports. The JMeter is used to test the Reporting Service API's
URL: http://nwdaf-cap4c-reporting-service:8080/v1/userdatacongestion/info
Table 4-14 UDC Analytics Information Metrics
| Request Type | Threads | Records in DB | Avg. Latency |
|---|---|---|---|
| GET | 100 | 100 records | 516 ms |
| GET | 200 | 200 records | 2229 ms |