This guide describes how to use the Oracle Communications Order and Service Management (OSM) Order Operations and Fallout Management graphical user interface (GUI), with which you can monitor order volumes in real-time and manage fallout orders in your OSM cloud native deployment.
Topics in this document:
Logging in to the User Interface
Log in to the Order Operations and Fallout Management UI using the URL and credentials that your administrator configured. See OSM Cloud Native Deployment Guide for instructions about setting up the user interface. Once you have the URL and the credentials, open a web browser and log in to the Order Operations and Fallout Management UI.
https://project.instance.osm.org:port/OrderManagement/osm-landingpage/Note:
For information about configuring the UI on https, see OSM Cloud Native Deployment Guide.For
project, instance, and
port details, check with your administrator. Also,
in the project specification, your administrator may have configured a different
domain name, instead of osm.org.
You can also access and view the UI in landscape mode on iPad.
Session Timeout
When logged into the application, if you leave the user interface idle in a tab, a pop-up window appears after 80% of the configured session timeout duration is reached. The pop-up window indicates how much time you have before your session times out. If you click OK or refresh the page, the timer is reset. However, if you do not take any action, you will be logged out once the remaining time is run out.
If you have the application open in two separate browser windows or tabs, and one of them is kept idle, a pop-up window appears on the one that is left idle after 80% of the configured session timeout duration is reached. If you do not click the OK button, or refresh the page on the idle browser window, when the time runs out, you will be logged out of the application on both the windows.
Your administrator can configure the duration for session timeout. See OSM Cloud Native Deployment Guide for details.
Note:
When using multiple sessions, if one of the session times out, or if you log out in one, a session timeout popup is displayed in the other session window. Click OK and then proceed to login again. Not doing so leads you to a blank landing page. If you are not able to login again, close all open tabs and login again to fix the error.Landing Page
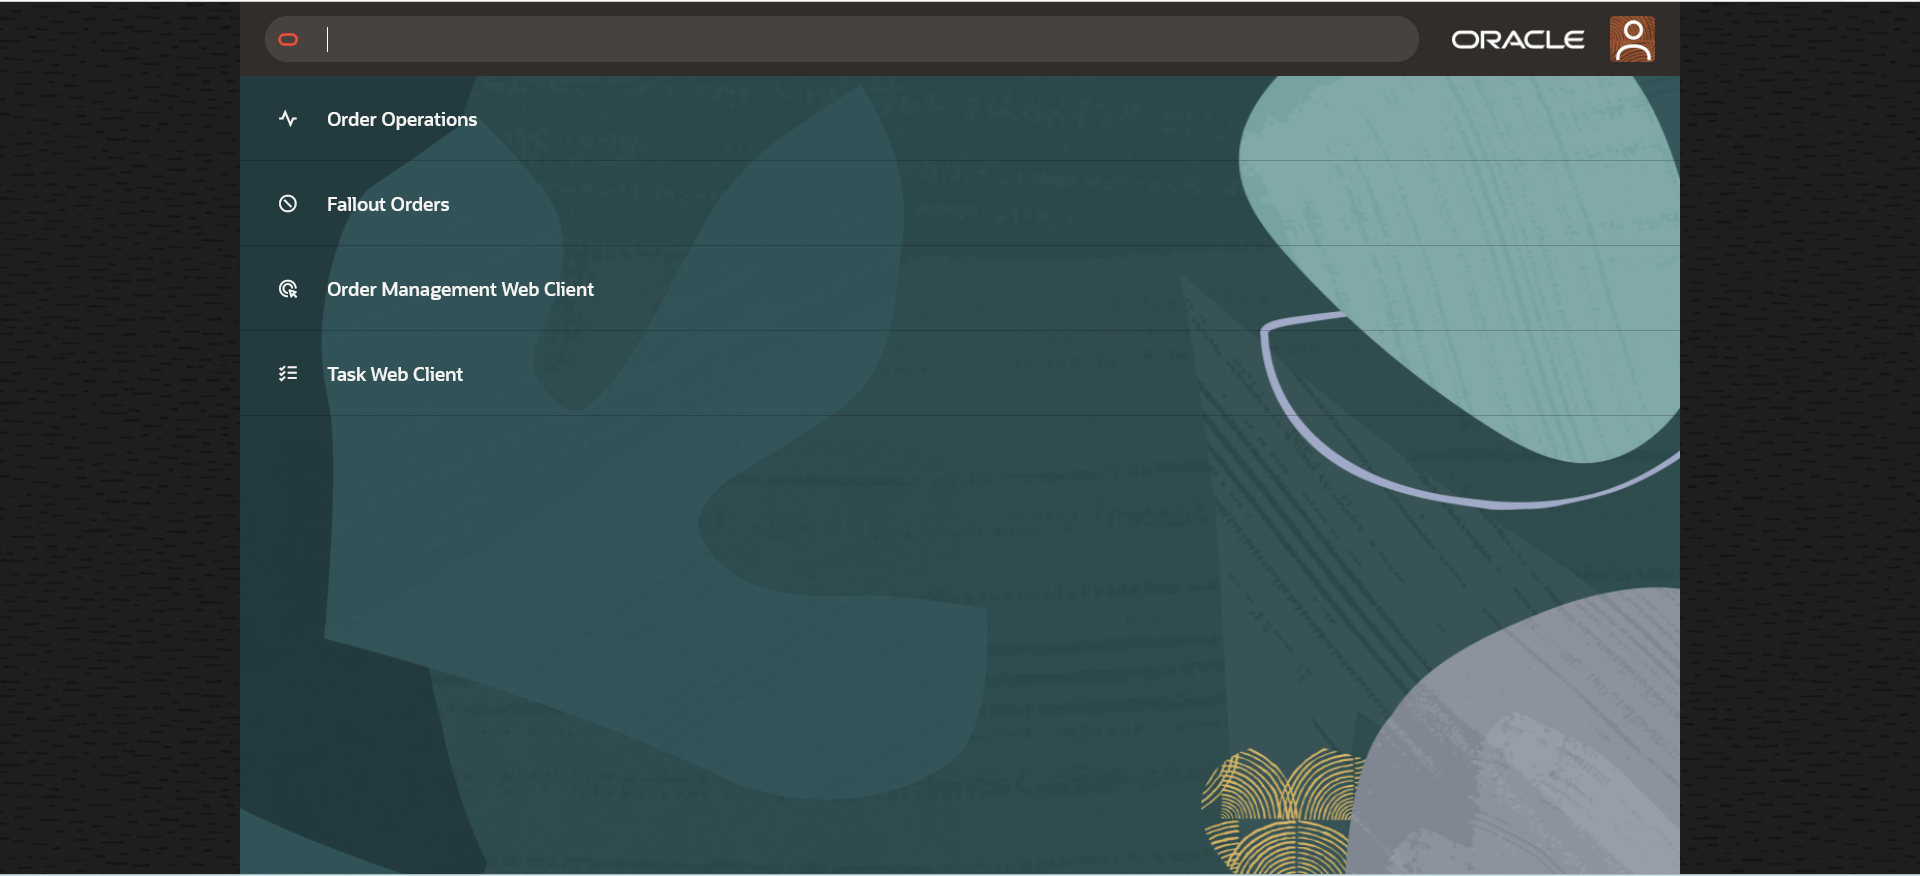
After logging in, the user interface displays the landing page.
- Order Operations: Opens the Order Operations dashboard. This dashboard displays a bar chart, line graph, order metrics for a specified duration, Refresh icon and an Alerts icon.
- Fallout Orders: Opens the Fallout Orders page. This page displays orders and their details in fallout. You can search for a specific set of orders or a specific order using different filters. You can navigate to the Worklist page and the Process History - Summary Table page of the OSM Task Web client to view the details of an order at the point of fallout and the process history summary of an order.
- Order Management Web Client: Opens the Order Management Web client. This client enables you to perform order management and administration tasks. See the OSM Order Management Web Client User's Guide for instructions about using this client application.
- Task Web Client: Opens the Task Web client. This client application enables you to create, view, edit, track, and report on orders and tasks in the OSM system. See the OSM Task Web Client User's Guide for instructions about using this client application.
From within any of these applications, click ![]()
Description of the illustration askoracle.png (Ask Oracle icon) to navigate back to the landing page.
Finding Help
In the user menu, located at the top-right corner of the landing page, click Help to open the user's guides of OSM web clients and other documentation about OSM. Click About to view the version of the OSM application that you are currently logged into.
Logging Out
To log out of the application, navigate to the landing page, click the user menu (at the top-right corner) and then click Sign Out.
Monitoring Orders
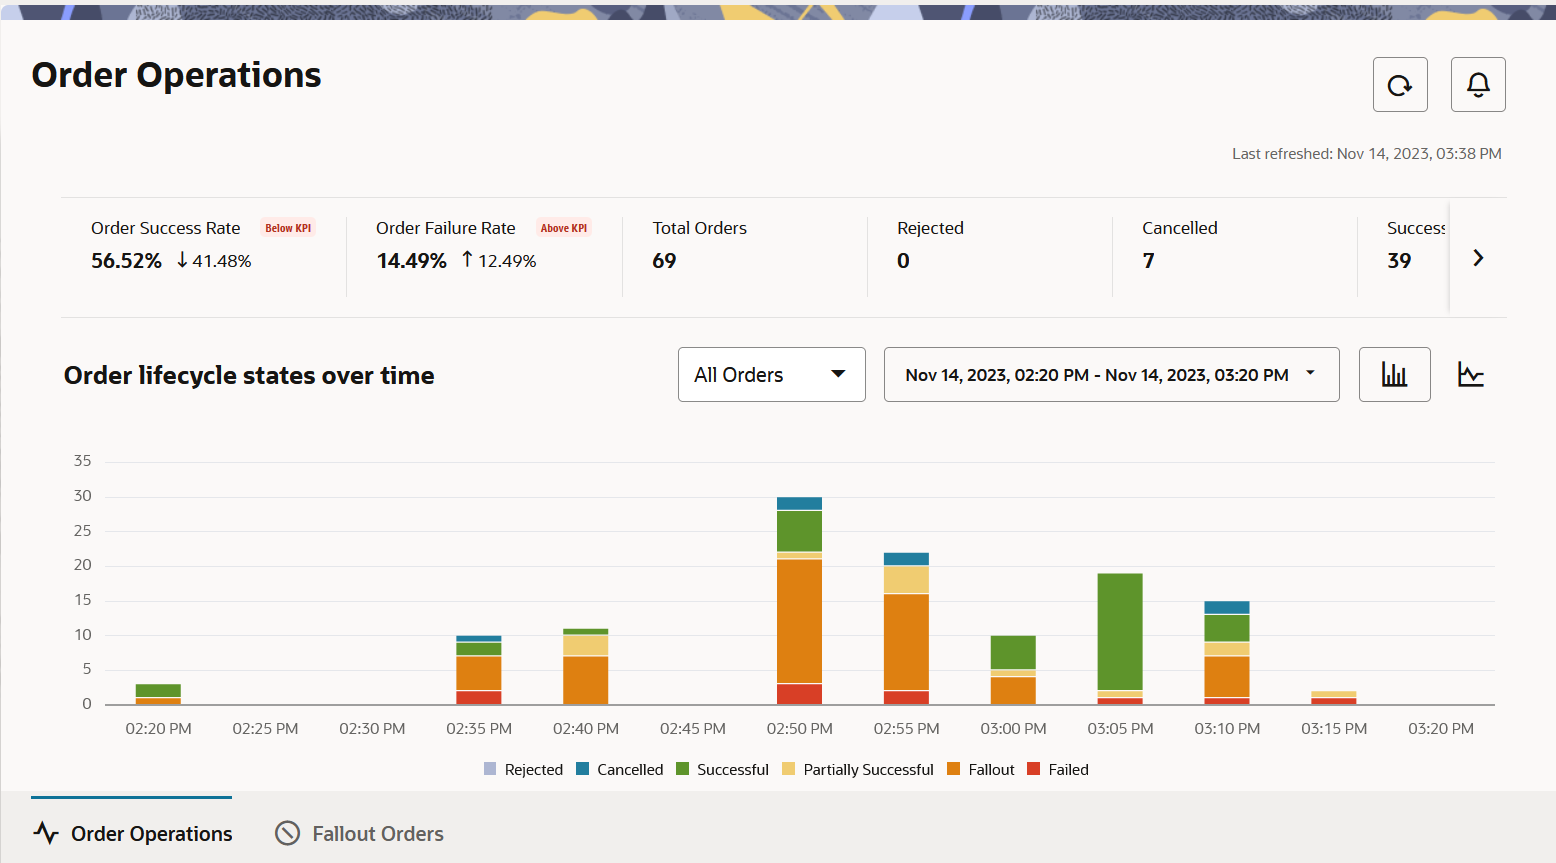
On the landing page, click Order Operations to open the Order Operations dashboard. Using the Order Operations dashboard, you can monitor order volumes in real-time.
Note:
The data in this image has been set up to showcase all the data facets that can be visible in the dashboard.Figure 1-2 Bar Chart in Order Operations Dashboard
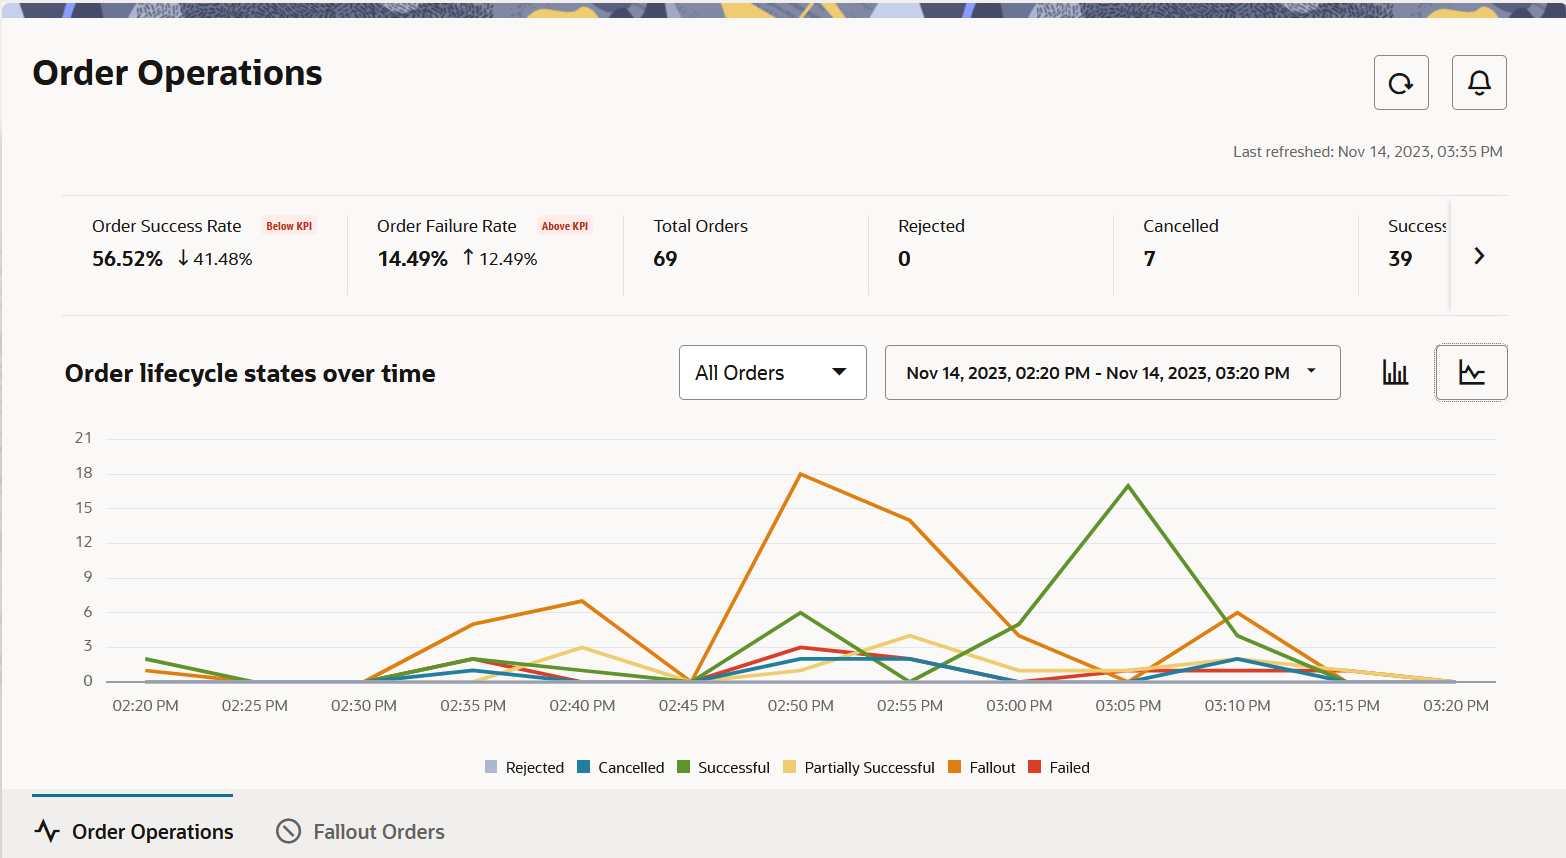
The following image shows the Order Operations dashboard, with the line graph selected.
Note:
The data in this image has been set up to showcase all the data facets that can be visible in the dashboard.Figure 1-3 Line Graph in Order Operations Dashboard
Note:
All metrics displayed on the dashboard are for TMF orders only.The dashboard shows real-time order status information for a specified duration and refreshes automatically after every 3 minutes, by default.
Clicking ![]() (Refresh icon) refreshes the data and displays the latest order status
information in real-time.
(Refresh icon) refreshes the data and displays the latest order status
information in real-time.
Clicking ![]() (Alerts icon) opens the Alerts panel, which displays alerts when a
threshold set on a specific order metric is reached. For example, by default, an alert
is generated and displayed every time the order success rate drops below 98%. See Viewing Alerts for further details about alerts.
(Alerts icon) opens the Alerts panel, which displays alerts when a
threshold set on a specific order metric is reached. For example, by default, an alert
is generated and displayed every time the order success rate drops below 98%. See Viewing Alerts for further details about alerts.
Key Performance Indicators (KPIs)
The dashboard displays the following key performance indicators about the orders OSM received:
-
Order Success Rate: This KPI represents the % of the number of Completed Orders proportionate to the number of Total Orders. When this % drops below a threshold that you set, a down arrow and the percentage of the drop (as in a stock ticker) are displayed. By default, the threshold is set to 98%. The equation for calculating this KPI is as follows:
Order Success Rate = (Number of Completed Orders / Number of Total Orders) x 100 -
Order Failure Rate: This KPI represents the % of the number of Failed Orders proportionate to the number of Total Orders. When this % rises above a threshold that you set, an up arrow and the percentage of the rise (as in a stock ticker) are displayed. By default, the threshold is set to 2%. The equation for calculating this KPI is as follows:
Order Failure Rate = (Number of Failed Orders + Number of Rejected Orders) / Number of Total Orders x 100 - Total Orders: This is the total number of orders that OSM
received.
Total Orders = Rejected Orders + Cancelled Orders + Completed Orders + Partial Orders + Failed Orders
The KPIs are displayed for the orders that OSM received over the configured duration. The default duration is 6 months, but your administrator can modify this in the instance specification file.
Order Life Cycle States
The dashboard displays the numbers of orders that are in each life cycle state.
- Rejected: Represents the number of rejected orders. An order
could be rejected for the following reasons:
- The order feasibility check failed.
- Invalid information is provided in the order request.
- The order request failed to meet the business rules for ordering.
- Cancelled: These are orders placed and then cancelled.
- Successful: These are fulfilled orders, for which services are provisioned. This state corresponds to the Completed TM Forum order state.
- Partially Successful: These are orders for which OSM has completed processing only some order line items, while other order line items haven't been fulfilled. This state corresponds to the Partial TM Forum order state.
- Fallout: These are orders that are in fallout.
- Failed: These are orders that couldn't be processed and fulfilled. This state corresponds to the Failed TM Forum order state.
These numbers are displayed for the orders that OSM processed over the configured duration. The default duration is 6 months, but your administrator can modify this in the instance specification file.
Bar Chart and Line Graph
Click ![]() (Bar Chart icon) to view the bar graph.
(Bar Chart icon) to view the bar graph.
Click ![]() (Line graph icon) to view the line chart.
(Line graph icon) to view the line chart.
Each colored block in the stacked bar chart and each colored line in the line chart represent orders in a specific life cycle state. These states are based on the TM Forum model for order life cycle states.
- Choose to view only product orders, only service orders, or both types of orders by using the drop-down list on the graph. By default, this field is set to All Orders.
-
Specify a duration for which you want to view the status of orders. By default, the duration is set to Today, which displays order volumes and their states for the current rolling hour.
To specify a duration, click the date range drop-down list on the graph, specify the duration of your choice, and then click Apply. The charts reflect the total number of orders in their current states in an interval-based counter (or equivalent) that reflects the total number over a defined interval period.
By default, you can choose to view order states for a maximum of 6 months and within the last 6 months.
Note:
The bar chart and the line graphs represent the number of orders transitioning into a particular state in the specified time period, and not the total number of orders currently in that state. - Hover over the colored blocks in the bar chart to view the value of the orders in that state.
- Use the colored checkboxes (squares) below the chart to hide or show the order states in the graph or chart.
- Refresh the data by clicking the
 (Refresh icon) at the top.
Viewing Alerts
On the Operations Dashboard, click ![]() (Alerts icon) to open the Alerts panel.
(Alerts icon) to open the Alerts panel.
OSM generates alerts everytime the threshold set on a specific metric is reached within the last 24 hours. The last 24 hour time period is calculated in a rolling window from the closest half an hour period.
- Orders submitted in an hour. An alert is raised when OSM receives more than a configured maximum number of orders in an hour. Every time this maximum is exceeded, an alert is generated. The default maximum number of orders is 5,000. The hour time period is calculated in a rolling window everytime the page is refreshed. If the threshold is breached in any rolling window, an alert will be raised. Since alerts are not stored, they appear based on the order data of that rolling window of an hour.
- Order completion success percentage. An alert is raised when the rate of successful order processing drops below a configured minimum threshold. Everytime this minimum is breached, an alert is generated. The default minimum threshold is 98%.
Your administrator can change these default values to your own values to set up and trigger alerts as per your organization's needs. For information about configuring alerts, see the chapter about setting up the Order Operations and Fallout Management GUI in the OSM Cloud Native Deployment Guide.
To close the Alerts panel, click ![]() (Alerts icon) again.
(Alerts icon) again.
Managing Fallout Orders
Use the Fallout Orders page to manage orders with a fallout exception.
On the landing page, click Fallout Orders to open the Fallout Orders page. If you are on the Operations Dashboard, you can also click the Fallout Orders tab below the bar chart to switch to the Fallout Orders page.
The Fallout Orders page displays details about all orders, both TMF and non-TMF, that are waiting for user intervention as a result of issues during fulfillment. The page displays fallout orders and their details only if your cartridge leverages the simplified fallout exception management capabilities. Specifically, automation plugins must have emitted a fallout exception using the automation APIs. For information about fallout exception management, see OSM Concepts and OSM Modeling Guide.
The data displayed in the Fallout Orders table is received from the OSM Fallout Exception Management API.
For a Freeform cartridge, the values for the Order Type, Customer Name, and External ID columns would be blank.
For TMF cartridges, the values for these fields is resolved from data on the Hosted Specification inside a cartridge.
The following table lists the columns in the UI and the source of the information.
Table 1-1 Column and Data Field Mappings
| Column in the UI | Source |
|---|---|
| Product | Product specification name |
| Error Category | FullfillmentFunction + ": " + category |
| Timestamp | Creation Date |
| Related Task | Task that raised the fallout exception |
| Description | Message supplied by automation plugin when raising fallout exception |
By default, the page displays all orders that are currently in fallout. Use the Search box, filter chips, and the provided options to search for specific fallout orders and filter the results.
Click ![]() (Refresh icon) to refresh the results.
(Refresh icon) to refresh the results.
Click ![]() (Column picker icon) to choose and reorder the columns you want to view on the
page. In the Columns dialog box, select the columns you want to include in the page.
Drag the columns up or down to arrange the columns in the order you want to view in the
page. Click the Restore Defaults button to restore the columns displayed and the
sequence in which they are arranged by default.
(Column picker icon) to choose and reorder the columns you want to view on the
page. In the Columns dialog box, select the columns you want to include in the page.
Drag the columns up or down to arrange the columns in the order you want to view in the
page. Click the Restore Defaults button to restore the columns displayed and the
sequence in which they are arranged by default.
Searching for Orders
You can search for fallout orders using multiple ways.
You can search for fallout orders by typing in the Search box. As you type, a suggestion list is displayed below the Search box. Suggestions for Customer Name or Order ID are available. However, text can only be matched to customer name for TMF orders.
By default, if you enter an alphanumeric or alphabetical value within the Search box, the page retrieves a match against a customer name. If you type a numeric value, the page retrieves a match against an order ID.
Note:
Numeric values must be an exact match to an Order ID to return a result. Search does not return partial matches.If you choose to search against customer name, you can also conduct a wildcard search. Wildcard searches only return results for TMF orders.
- Contains: You can also retrieve fallout orders where the customer’s name contains the text you have entered in the Search bar. For this, insert the percent symbol before as well after your text and press Enter. This retrieves all orders where the customer’s name contains the text that you have entered.
- Start with: You can retrieve specific fallout orders where the customer’s name starts with the text that you have entered in the Search bar. For this, insert the percent symbol after the text and press Enter. This retrieves all orders where the customer’s name starts with the text you have entered.
- End with: You can retrieve fallout orders where the customer’s name ends with the text that you have entered in the Search bar. For this, insert the percent symbol before the text and press Enter. This retrieves all orders where the customer’s name ends with the text that you have entered.
You can also apply preset filters to retrieve and view a specific set of orders by using the provided filter chips. You can use a single filter chip or a combination of multiple filter chips.
-
Order Type: Click this filter chip to retrieve only TMF product orders or only TMF service orders. The Search box is filled with the filter chip and the page lists only that type of orders that is already specified within the filter chip.
Clicking the chip opens a drop-down list, using which you can choose one of the two TMF order types - Product or Service. The page then displays only the type of orders you select.
-
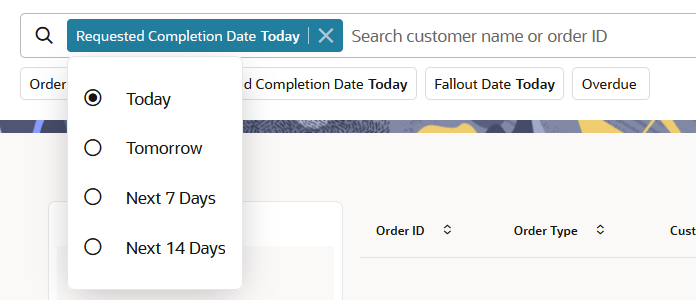
Requested Completion Date: Click this filter chip to retrieve and view orders by a specific requested completion date or for a specific duration. The Search box is filled with the filter chip and the page displays the orders based on the selection already specified within the filter chip.
By default, the filter chip is set to retrieve orders that have the requested completion date as the current date. Clicking the chip opens a drop-down list, using which you can make a selection. The available options are: Today, which is the current day that is local to your time zone, Tomorrow, which is the day after the current day that is local to your time zone, the Next 7 days that are local to your time zone, and the Next 14 days that are local to your time zone.
-
Fallout Date: Click this filter chip to retrieve and view orders that have a specific fallout date or for a duration. The Search box is filled with the filter chip and the page lists orders for the fallout date or duration that is already specified within the filter chip.
By default, the filter chip is set to retrieve orders that have the fallout date as the current date that is local to your time zone. Clicking the chip opens a drop-down list, using which you can make a selection. The available options are: Today, which is the current day that is local to your time zone, Yesterday, which is the day before the current day that is local to your time zone, the Last 7 days that are local to your time zone, and the Last 14 days that are local to your time zone.
-
Overdue: Click this filter chip to retrieve and view orders that are overdue. The Search box is filled with the filter chip and the page lists orders that are overdue.
- Review orders: You can review the list of fallout orders. For each order, along with other details, the page shows the number of errors associated with the order in the Total Errors column and the status of the order in the Status column. A hyphen in the Status column indicates that the order is on schedule.
- View order error details: You can view the details of the errors by clicking the link for an order in the Order ID column. Clicking the order ID link opens the error details page.
- Choose and reorder columns: Click
 (Column Picker icon) to choose and reorder the columns you want to view
on the page. In the Columns dialog box, select the columns you want to include
in the page. Drag the columns up or down to arrange the columns in the order you
want to view in the page. Click the Restore Defaults button to restore
the columns and the sequence in which they were arranged after the last time the
page was loaded.
- Refresh the results by clicking the
 (Refresh icon) at the top.
Within a login session, the dashboard remembers the selected filter chips and the sorting applied on the columns in the fallout orders table.
About the Pie Chart
The pie chart represents the number of fallout orders that are on schedule and overdue.
- Overdue: Indicates that an order has not been processed and fulfilled by the requested completion date.
- On Schedule: Indicates that the processing of an order is on schedule.
Clicking on the colored portion of the pie chart brings up the list of orders that match the selected portion - In Fallout and Overdue or In Fallout and On Schedule.
Investigating Fallout and Taking Corrective Actions
On the Fallout Orders page, click the link in the Order ID column to view the fallout details page for an order and to take corrective actions on the order.
-
To see the details of an order at the point of fallout, or to take a corrective action, click the link in the Related task column. This opens the related task in the Worklist page of the OSM Task Web client in a new tab. See OSM Task Web Client User's Guide for instructions about taking an action.
-
To view the process history summary of an order, click the Actions menu and then select View Process History. This opens the Process History - Summary Table page for the order in the OSM Task Web client in a new tab. You can review the process history of the order or navigate elsewhere in the Task Web client to examine the order, related tasks, or work on the task itself.
The Product column is displayed only if it is modeled in the solution cartridge.
Documentation Accessibility
For information about Oracle's commitment to accessibility, visit the Oracle Accessibility Program website at http://www.oracle.com/pls/topic/lookup?ctx=acc&id=docacc.
Access to Oracle Support
Oracle customers that have purchased support have access to electronic support through My Oracle Support. For information, visit http://www.oracle.com/pls/topic/lookup?ctx=acc&id=info or visit http://www.oracle.com/pls/topic/lookup?ctx=acc&id=trs if you are hearing impaired.
Oracle Communications Order and Service Management Order Operations and Fallout Management User’s Guide, Release 7.5
F78683-01
November 2023
Copyright © 2023, Oracle and/or its affiliates.


