View Congestion
Oracle SD-WAN Edge 4.3 enhances the Web console to display a WAN Egress congestion state if it occurs within the site. There are three states associated with congestion:
- UNKNOWN: The WAN Link, Path, or Conduit is down so there is no congestion state
- NO: The WAN Link, Path, or Conduit is not congested
- YES: The WAN Link, Path, or Conduit is congested
In addition to the Web console displaying a congested state, there are also event notifications that users can enable and that the appliance generates when the congested state occurs. The event options include:
- WAN_LINK_CONGESTION: A WAN Link has become congested or un-congested
- USAGE_CONGESTION: A Conduit has become congested or un-congested
Note:
Congestion is detected if packets in the WAN are delayed more than 100ms from the expected time of arrival.To view congestion on a WAN Link, go to Monitor Statistics and choose WAN Link Usage from the Show drop-down menu. See Figure 8 for a screen capture of a congested WAN Link. The congested WAN Link is highlighted in red with the Congestion state as YES.
![]()
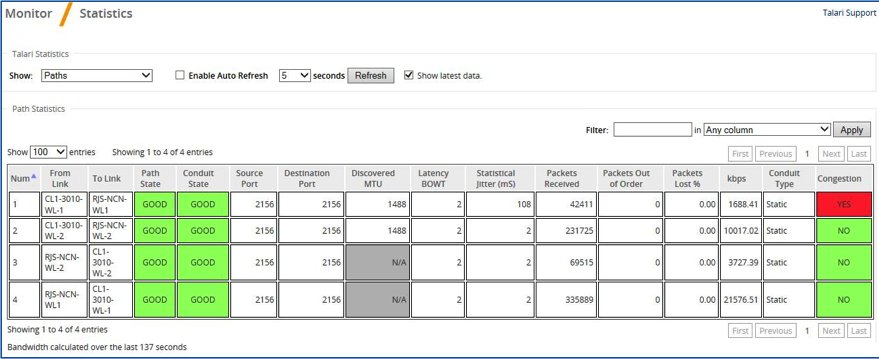
To view congestion on a Path, go to Monitor Statistics and choose Paths from the Show drop-down menu. See Figure 9 for a congested Path.

Figure 9: Congested Path
As illustrated in Figure 9, congestion can occur in one direction of a Path. In the above Oracle SD-WAN Edge, congestion is occurring from CL1-3010-WL1 RJS-NCNWL1. So, congestion (WAN Egress) is occurring from the Client site to the NCN site. Figure 9 was taken at the Client site. The Oracle NCN uses Oracle encapsulation to notify the Client appliance that it has congestion on the defined Path above. With this information, the Client appliance can also display that congested state.
To view congestion on a Conduit, go to Monitor Statistics and choose Conduit from the Show dropdown menu.
Note:
If a WAN Link, Path, or Conduit is congested, the Web console will display this state while the congestion persists and for an additional 15 seconds after the congestion clears. This is to provide users the ability to troubleshoot the event when it occurs.