WAN Optimization Dashboard and Reporting Enhancements
7.2 provides a new at-a-glance dashboard for WAN Optimization with more detailed reports and more data about the protocols being optimized. The dashboard refreshes automatically every minute to provide up-to-date information. Additionally, all WANOp pages have been consolidated into the new WAN Optimization menu in the sidebar for ease of location. The WAN Optimization menus and dashboard will only be displayed on appliances that support WAN Optimization.
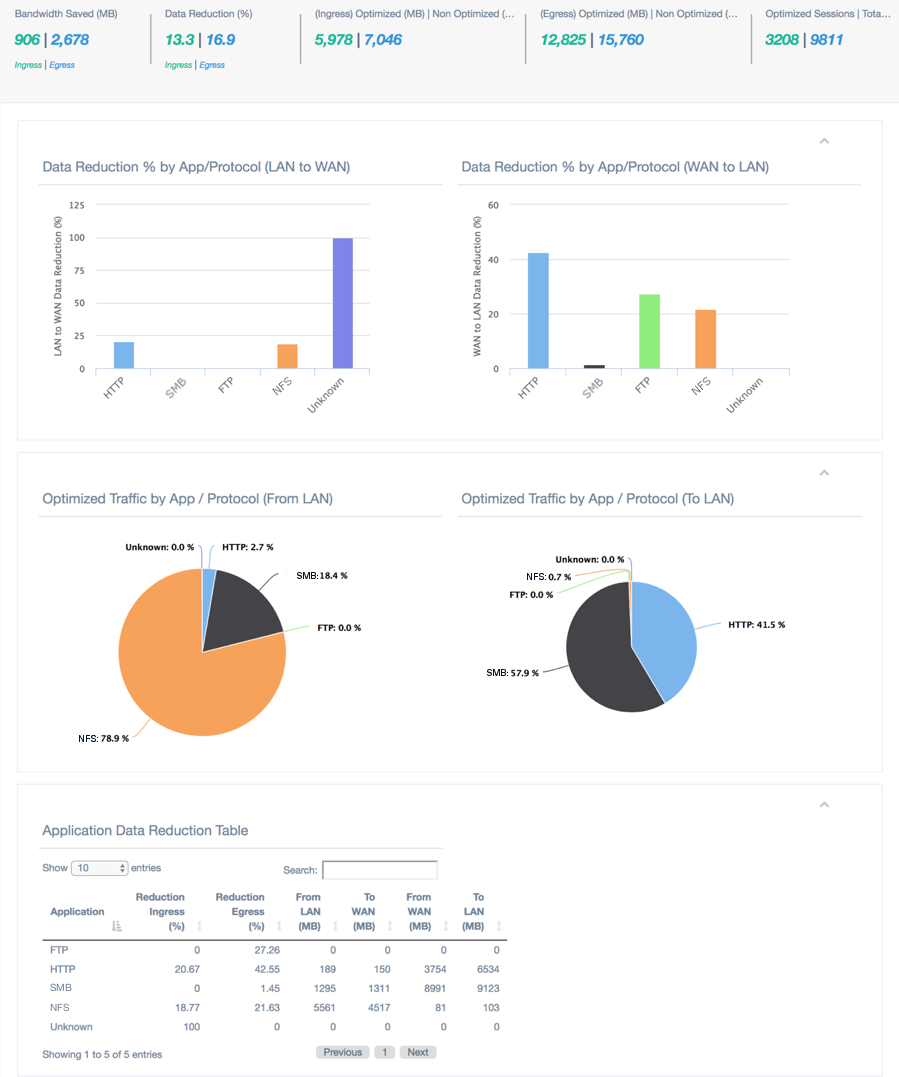
To view the WAN Optimization dashboard, navigate to WAN Optimization > Dashboard:

WAN Optimization Dashboard Overview
Note:
The new WAN Optimization dashboard takes advantage of the Application objects that can be defined in the Configuration (Global > Applications). Application Recognition was introduced in 6.1. Please see the 6.1 New Features Guide for configuration details.If an application is defined in the configuration and used in policies or rules, individual WANOp statistics will be tracked for that application and tagged with the application name defined in the configuration.
WAN Optimization Dashboard Components
The first section of the WAN Optimization dashboard presents summary information about WAN Optimization function at the site:
![]()
Bandwidth Saved (MB): Total bandwidth saved using WAN Optimization in MB, for WAN Ingress and WAN Egress. Links to WAN Optimization > Monitor WANOp with the Kbytes Saved report pre-selected.
Data Reduction (%): Data reduction percentage using WAN Optimization, for WAN Ingress and WAN Egress. Links to WAN Optimization > Monitor WANOp with the Data Reduction % report pre-selected.
(Ingress) Optimized (MB) | Non Optimized (MB): Total WAN Ingress bandwidth optimized vs non-optimized, in MB. Links to WAN Optimization > Statistics.
(Egress) Optimized (MB) | Non Optimized (MB): Total WAN Egress bandwidth optimized vs non-optimized, in MB. Links to WAN Optimization > Statistics.
Optimized Sessions | Total Flows: Total number of active WAN Optimized sessions vs total active sessions. Links to WAN Optimization > Flows, with WAN Ingress, WAN Egress, and TCP Termination Table pre-selected.
The second section of the WAN Optimization dashboard provides data reduction reports by application/protocol:

Data Reduction % by App/Protocol (LAN to WAN): Data reduction percentage for each protocol or application (for applications defined in the configuration), for WAN Ingress (upload). Users may hover over each bar to see the exact percentage.
Data Reduction % by App/Protocol (WAN to LAN): Data reduction percentage for each protocol or application (for applications defined in the configuration), for WAN Egress (download). Users may hover over each bar to see the exact percentage.
The third section of the WAN Optimization dashboard provides information about optimized traffic by application/protocol:

Optimized Traffic by App/Protocol (From LAN): Chart displaying the percentage of total optimized upload/WAN Ingress traffic for each protocol or application (for applications defined in the configuration). Users may hover over each bar to see the exact percentage.
Optimized Traffic by App/Protocol (To LAN): Chart displaying the percentage of total optimized download/WAN Egress traffic for each protocol or application (for applications defined in the configuration). Users may hover over each bar to see the exact percentage.
The final section of the WAN Optimization dashboard is the Application Data Reduction Table:

The Application Data Reduction table shows flow statistics for WAN Optimized sessions that match user-defined Application objects in the configuration, as well as WAN Optimized HTTP, HTTPS, FTP, SSH, and Telnet sessions that do not match a defined Application object.
For more information about WAN Optimization, please see the WAN Optimization Guide.