Flow Analytics
This section shows you how to interact with Unified Assurance Flow Analytics. This is recommended for use by trained Unified Assurance administrators and consultants to plan, execute, and support a Flow Analytics deployment.
Introduction
Unified Assurance Flow Analytics is a complete solution to collect, analyze, and provide real-time visibility into whom and what are consuming network bandwidth.
Key features include:
-
See which users, devices and/or applications are using the most bandwidth
-
Discover traffic patterns & device performance
-
Prioritize business-critical applications
-
Validate effectiveness of CBQoS policies
Architecture
With all Unified Assurance solutions, the components are broken down into three layers: collection, database, and presentation. The majority of the solution resides in the collection layer on a dedicated server. If multiple data centers or multiple managed customers will be exporting flows, it is recommended to install separate collection servers in each data center to get as close to the exporting devices as possible. Raw flow data should not have to consume bandwidth traversing WAN links if possible.
The architecture of the product includes the following key functions to provide its end-to-end functionality:
-
Devices send flow data into the collection servers where they are processed. See the Flow Collector documentation for additional information.
-
Flows are stored in the ElasticSearch Database.
-
Users interact with the Flow diagrams in the Kibana UI inside the Unified Assurance UI. The default dashboards are available through the Analytics -> Events -> Dashboard option in the navigation bar, then selecting one of the "Flow" dashboards.
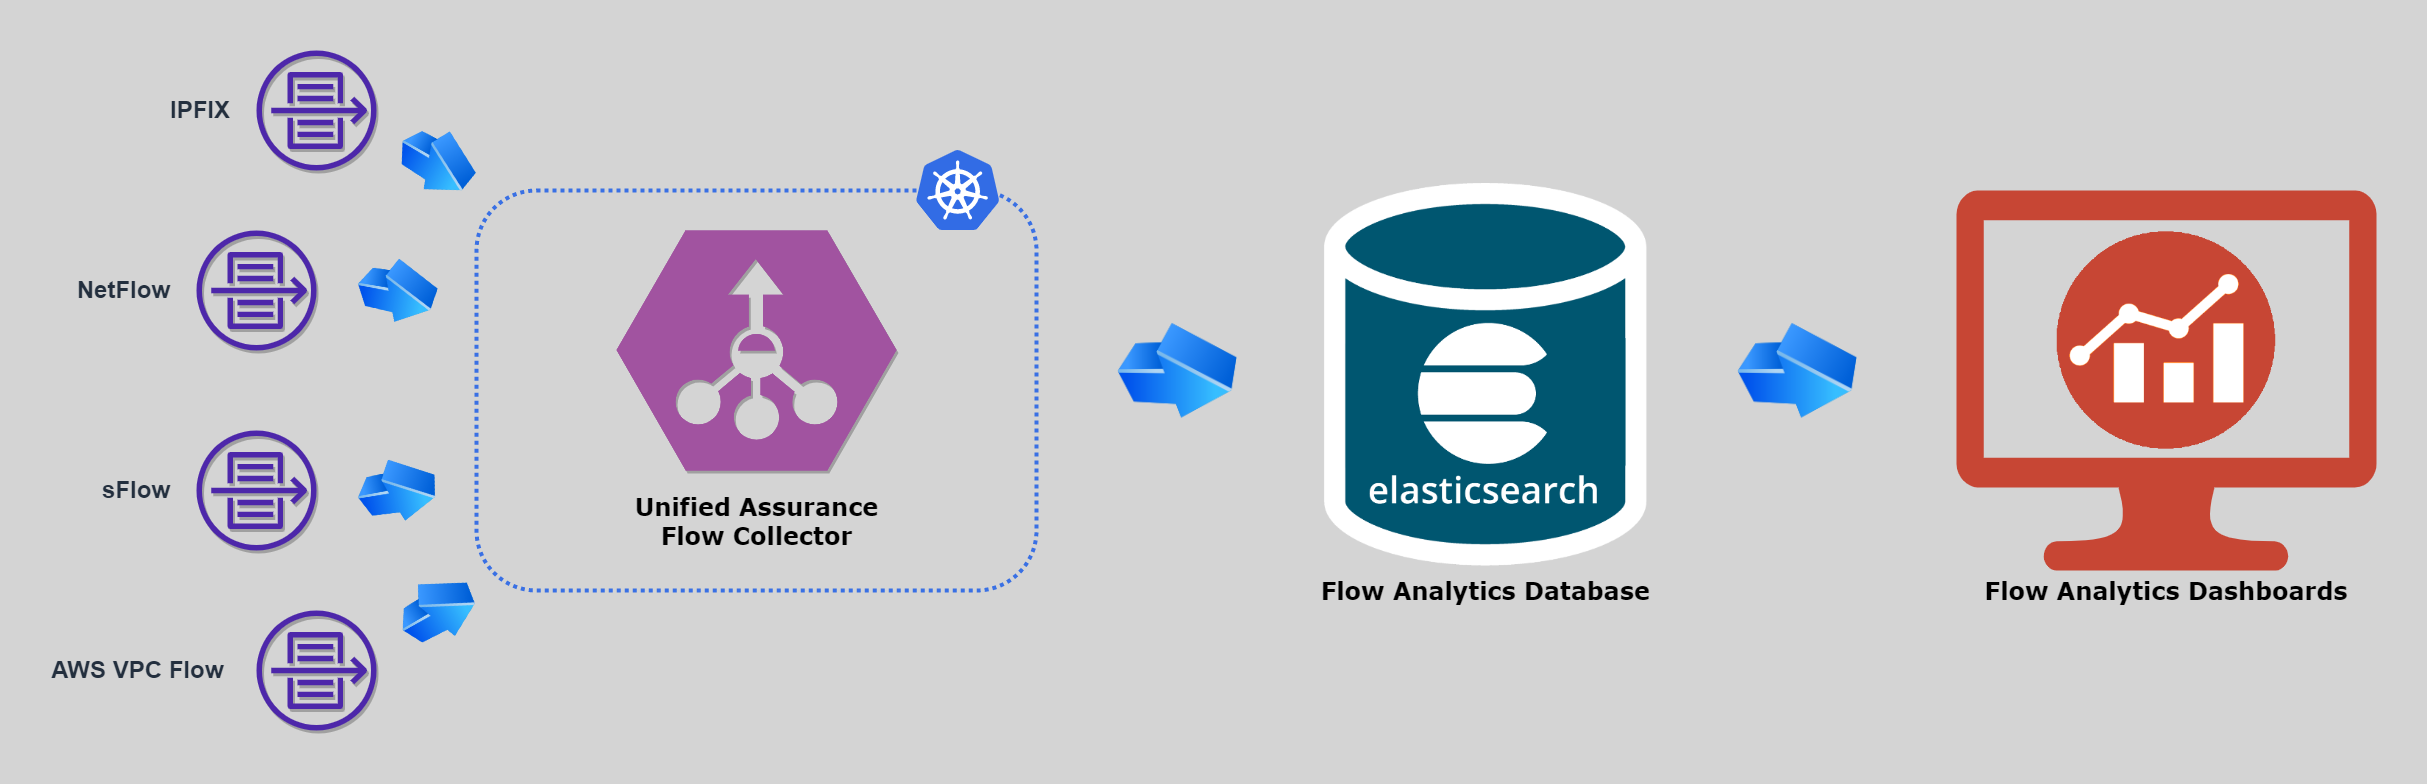
Description of illustration flow-analytics-architecture-diagram.png