Event Analytics
This section shows you how to install, maintain, and interact with Unified Assurance Event Analytics. This is recommended for use by trained Unified Assurance administrators and consultants to plan, run, and support an Event Analytics deployment.
Introduction
Unified Assurance Event Analytics is intended to assist operations in leveraging the past to assist in the future. The goal is to accomplish this task with as much automation as possible. This product line provides a Machine Learning Feedback Loop to take data, process it, analyze it, and alert back into the real-time fault engine for correlation purposes. This document focuses on tracking the product's architecture, integration with Unified Assurance, installation, key maintenance items, and tips/tricks.
Purpose
This text should be used to educate administrators on the product and how to manage an instance of Unified Assurance Event Analytics. Oracle Communications recommends that you complete the online training portal before implementing this document.
Scope
Unified Assurance Event Analytics requires Unified Assurance fault management functionality to support real-time fault ingestion. Without data, Unified Assurance Event Analytics will not be able to function nor provide value. Currently the product only supports fault ingestion from Unified Assurance fault management.
Product Overview
Unified Assurance with Event Analytics makes it faster and easier to navigate historical data to determine root causes and document historical things that happened. It leverages Machine Learning to spot real-time event anomalies based on historical knowledge. Anomalies are then injected as Root Causal Events back into Unified Assurance based on many individual Machine Learning Jobs. Unified Assurance can finally detect and suppress noise based on the Root Causal Events.
Benefits
-
Makes it faster to analyze history.
-
Has the system learn from history.
-
Shows root cause anomalies; laser focuses the NOC on actionable events.
-
Suppresses noise; hide the distractions from the NOC.
Architecture
This section explains the interworking of the product as designed. The components and integration are documented so that administrators understand how data flows throughout the product.
Overview Diagram
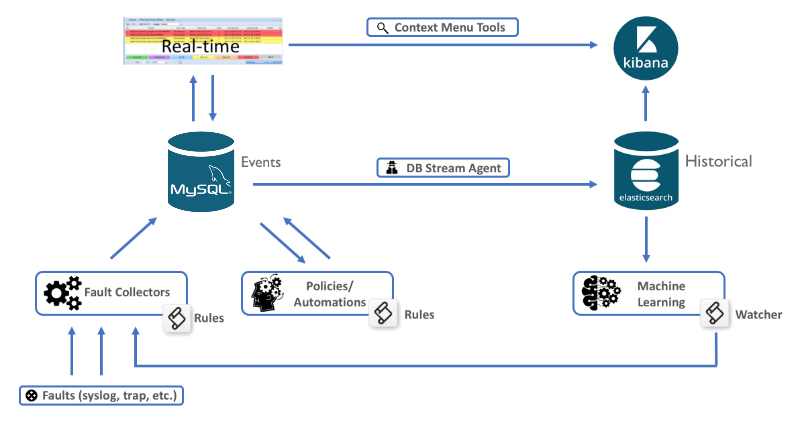
Description of illustration event-analytics-architecture-diagram.png
The architecture of the product includes leveraging the real-time Unified Assurance fault data and storage layer as well as the Elasticsearch historical event database. Between them, an aggregator will collect the results from analysis and insert the anomalies as new faults. The Kibana user interface will support reporting of the libraries of analysis jobs.
Key Workflows
The product runs the following key functions to provide its end-to-end functionality:
-
Devices and systems send faults into the collection servers, where they are processed through rules and normalized.
-
Events are stored in in the real-time Events database.
-
The DB stream agent (Elasticsearch Data Importer) takes all new, updated, and deleted event data and copies them to the Historical Elasticsearch Database.
-
Users interact with the Event List from the Unified Assurance UI and can manually adjust events (change severity, delete, acknowledge, etc.).
-
Users interact with the Historical Events from the Kibana UI inside the Unified Assurance UI either manually, or from context menu tools in the real-time Event List.
-
Machine Learning Jobs analyze the historical data and determine anomalies.
-
Elasticsearch Watcher, send anomalies to the WebHook aggregator.
-
The WebHook Aggregator creates new events indicating the anomalies detected.
-
Policies in Custom Action Policy Engine (CAPE) process the anomalies to correlate, enrich, and suppress events.
Key Components
The Unified Assurance Event Analytics product is made up of many Unified Assurance libraries and components. Each component has its own configuration and documentation within the overall Unified Assurance product suite. Below are summaries and links to documentation of the key components used for the product.
Elasticsearch Database
The Elasticsearch Database is the new historical fault analytic service. It stores all historical events for a period of time defined by the retention days in Historical Event Rotation. It runs the Machine Learning Jobs and sends notifications about anomalies.
Kibana
The Kibana web user interface is installed on Unified Assurance presentation servers and access to the UI is available from the Analytics -> Events options in the navigation bar.
Elasticsearch Data Importer
The Elasticsearch Data Importer is designed to read from MySQL binary logs and insert changes into Elasticsearch.
WebHook Aggregator
This WebHook Aggregator (part of the Collection.Core role) is designed to listen for data POSTed from a remote web application and process the data as a possible real-time fault.
Custom Action Policy Engine (CAPE)
CAPE is designed to listen for specific event based on filters and run custom actions. The Unified Assurance Event Analytics product leverages CAPE to provide automation run on the anomalies as they are detected in real-time.
Installation and Base Configuration
With Unified Assurance, Event Analytics is installed and configured as part of the base product installation. The installation guides for the different server configurations can be reviewed for additional information.
Post Install Actions
Once the AnalyticsWizard setup is complete, you must finish the installation by performing the following steps to complete the core functionality.
Turn on WebHook Alerting
The WebHook Aggregator is designed to catch alerts from Elasticsearch Watcher. You will need to enable the WebHook Aggregator on the specific collection server(s). You will also need to configure the Easticsearch Watcher webhook action to point to the correct host (replacing localhost). On redundant systems, the primary Elasticsearch Database should be configured to the primary WebHook Aggregator, and the redundant/backup Elasticsearch Database should be configured to the redundant/backup WebHook Aggregator.
Turn on Custom Action Policy Engine (CAPE)
Once WebHook alerting is configured, the correlation available out-of-the-box become available. To leverage the correlation policy, you must enable them and the Custom Action Policy Engine.
Enable Machine Learning Policies (Jobs)
With the alerting and correlation engines enabled, you can now turn on the Machine Learning Jobs applicable to your environment and use cases desired.
Once Running Set as Opened & Started
Scale
To prepare and plan for the environment prior to installation, the best practice is to run a scale calculator.
Ingestion
The recommendation is each node can handle up to 2500 events per second per node. Additional nodes can scale this linearly.
Sizing Calculations
-
1GB data space for each 1M rows of data - start with 20GB
-
1GB memory for each 5 Machine Learning jobs running - start with 4GB
-
1 vCPU/core for each 10 Machine Learning jobs running - start with 2 vCPU
-
IO - RAID10/3600 IOPS or better
Standard Hardware Recommendation
-
4 vCPU (up to 20 Machine Learning jobs)
-
8GB RAM (up to 20 Machine Learning jobs)
-
100GB Disk (up to 60M fault records analyzed)
Backup and Restore
Best practices dictate that all data and configurations must be backed up regularly. These backups need to be available, secure, and easily used for restoration. This section covers how to perform a backup and restoration.
For complete information about backing up and restoring the Elasticsearch database, see the Elasticsearch snapshot and restore documentation.
Backup
The following command allows you to export data to a file location.
PUT /_snapshot/my_backup
{
  "type": "fs",
  "settings": {
    "location": "my_backup_location"
  }
}
Restore
The following command loads a backup to a specific index.
POST /_snapshot/my_backup/snapshot_1/_restore
{
  "indices": "index_1,index_2",
  "ignore_unavailable": true,
  "include_global_state": true
  "rename_pattern": "index_(.+)",
  "rename_replacement": "restored_index_$1"
}
Automation Policies
As part of Event Analytics, anomalies can be consumed as new real-time events. At this point, those events can be used for a variety of automation. The Unified Assurance Custom Action Policy Engine (CAPE) leveraged with off-the-shelf policies to perform the encapsulation, correlation, escalation, and/or notification. This section covers the included policy that is leveraged for the product as shipped.
Suppress by Anomaly
This policy runs an RCA correlation action that effectively performs the following functions:
-
Parse from anomaly the timestamp and influencers (effectively a net).
-
Find events in the real-time database that are impacted by the anomaly (cast the net).
-
Suppress/annotate RCA (EventID of anomaly event) for all events found.
Escalate by Anomaly
This policy runs an escalation action (increased severity) that effectively performs the following functions:
-
Parse from anomaly the timestamp and influencers (effectively a net - i.e. EventKey).
-
Find events in the real-time database that are impacted by the anomaly (cast the net).
-
Escalate annotate RCA for all events found. New severity indicated by the anomaly event field, set in webhook aggregator rules.
Notify by Anomaly
This policy runs a notification action that effectively performs the following functions:
-
Parse from anomaly the email addresses to notify
-
Run email (SMTP) notification
-
Clears anomaly and marks journal that a notification was sent
Tips and Tricks
This section covers commonly used actions for administration with Unified Assurance Event Analytics. Each subsection will cover independent context.
- The Kibana Dev Tools allows running API calls without worrying about authentication or writing custom scripts.