Navigating Vision
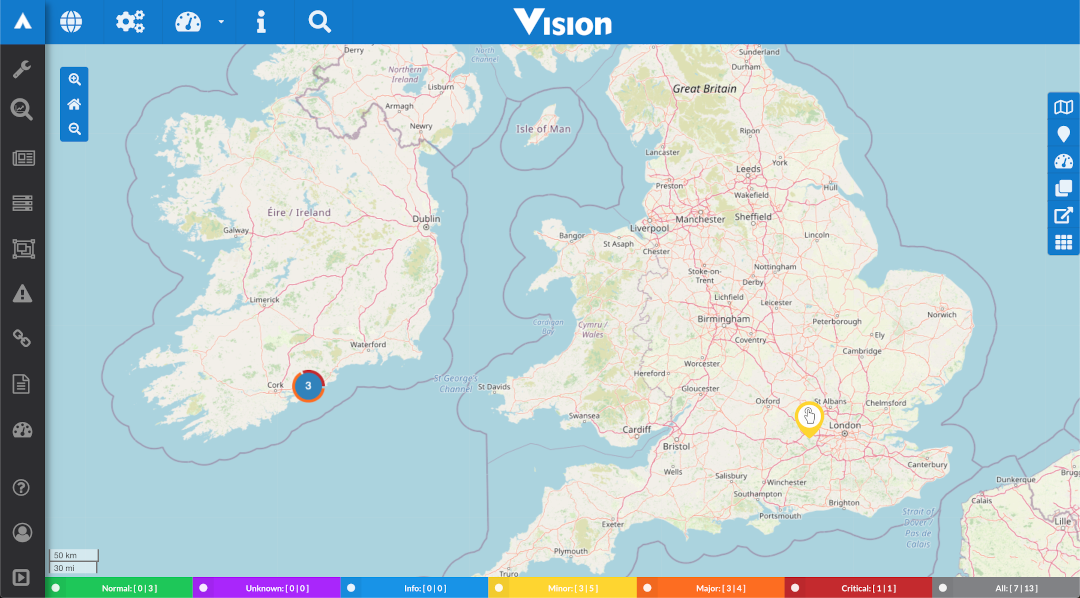
Description of illustration main-map-view.png
Vision Home Screen
Navigating the map:
-
Left-click and hold on the map to pan around the screen, or use the arrow keys.
-
Right-click the map to open a context menu with access to Measuring Mode, Geofencing Mode, and Show Coordinates. Menu items change depending on the context.
-
Click the colored filters on the bottom of the screen to filter events based on severity.
Note:
Control + left-click to select multiple severities at the same time.
Using Zoom Controls
Zoom controls are on the top left of the map. The Home button returns the map to the default zoom and location. The Plus and Minus buttons let you zoom in and out.
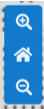
Description of illustration zoom-control.png
Using the Pause Button
When you click an event, the Pause button appears and the events are paused. Once you click the Pause button, the events resume and the button disappears from the UI.

Description of illustration paused-events.png
Using the Menu Bar

Description of illustration menu-bar.png
The menu bar is found at the top of every page in Vision. The following list describes the menu bar buttons:
-
Home View: This button returns you to the map from any screen; it also reloads the map if it is currently open.
-
Settings: This brings you to the Settings page. Refer to the Settings pages for more details.
-
Dashboards: This button is a drop-down menu which displays a list of available dashboards. Click an item on the list to go to that dashboard. Refer to Dashboards for more details.
-
Attribution: This button calls a pop-up with information about versioning and third-party software used within Vision. It also shows accreditation for map tiles that have been used in the current session.
-
Search: This extends a search bar and pauses the map to allow you to perform a search of any currently displayed events and custom layers. Refer to the Using the Search Feature for more detail.
-
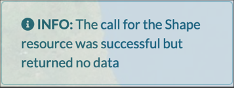
Error Message: This is displayed when an error or warning message is available for your attention. The icon is red when there are unread messages. Click the icon to open a pop-up box. This displays all error or warning messages received in the current session. Messages are displayed in reverse chronological order, with the latest message appearing at the top. The ten most recent errors display. To display the full list, select the list all button in the top right of the pop-up.
Using the Search Feature

Description of illustration search-feature.png
The search feature lets you search the active events and custom layers visible on the map. It also lets you filter the tables in the settings menu.
-
Click the search button on the menu bar. Events on the map are paused.
-
Enter at least three characters to start the search and return matches.
-
Select an item in the results drop-down list to pan and zoom the map to that item.
Use Search on the Map page to search on currently displayed entities and custom layers by name, address, IP Address, latitude, or longitude.
Limit your search to specific fields with the following keywords:
-
NAME: Searches using only the name field.
-
ADDRESS: Searches using only the address field.
-
IPADDRESS: Searches using only the IP address field.
Just type the keyword you want to use first in the search bar, for example, enter NAME: London in the search bar to search for anything with a name field containing London.
Using the Sidebar Menu
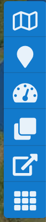
Description of illustration sidebar.png
The sidebar menu shows you available layers, divided into 6 different tabs: Maps, Events, Dashboards, Tiles, Custom Layer, and Packages.
You can toggle the layers that are visible on the map. The controllers and the layer will inform you if there are no available layers or an issue with a layer. Hover over a layer with an issue to see a tooltip with a short message explaining the issue. Below are examples of a layer that has an issue and a Sidebar with no available layers:
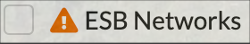
Description of illustration layer-with-an-issue.png
Description of illustration sidebar-no-layers-available.png
Maps Tab
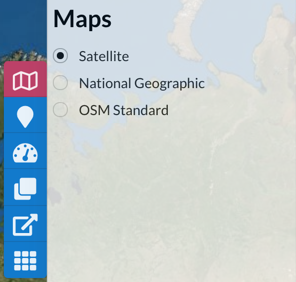
Description of illustration maps-layer-tab.png
The Maps tab lets you select from all configured base maps. For example, you can choose a Satellite map, or the Open Street Map (OSM) standard map.
Events Tab
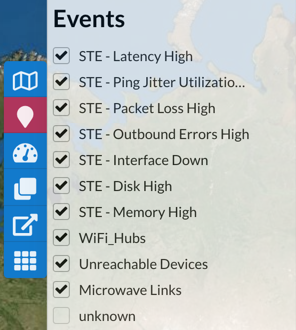
Description of illustration events-layer-tab.png
The Events tab lets you select which event layers are visible.
Dashboards Tab
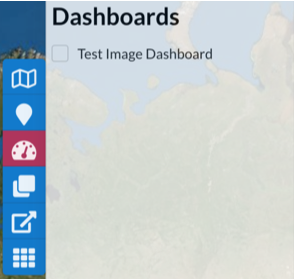
Description of illustration dashboards-tab.png
The Dashboards tab lets you select which dashboard layers are visible. This tab will only be available when there are dashboard layers configured to be displayed on the map. The dashboard layers shown here are ones that have their show on map flag set to true. If multiple dashboards use the same links, those links will only be added to the map once.
Tiles Tab
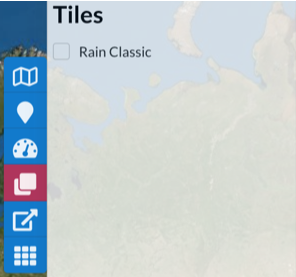
Description of illustration tiles-tab.png
The Tiles tab lets you select which overlay tiles are visible. Once a tile layer has been enabled it will appear on the map. Some tile layers may have a legend associated with them. If applicable, the legend will also appear on the map. The below example shows that the Rain Classic tile layer has been enabled; the rain overlay is on the map and the legend is displayed in the bottom left.
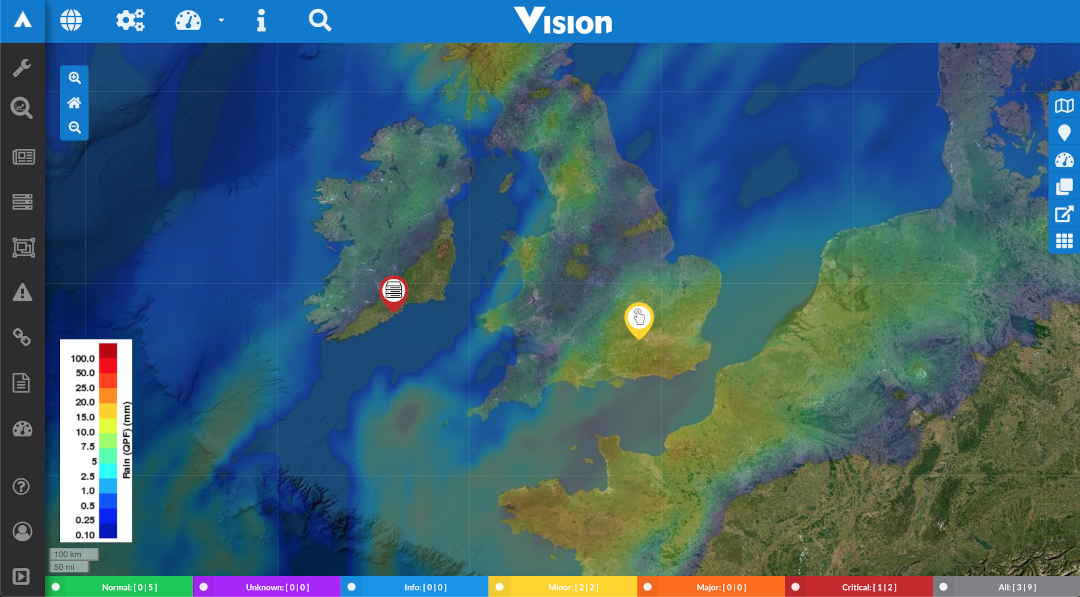
Description of illustration rain-tile.png
Custom Layer Tab
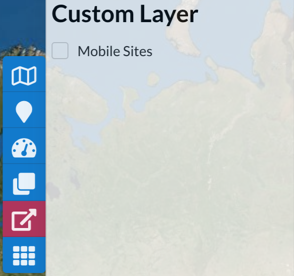
Description of illustration custom-tab.png
The Custom Layer tab lets you select which custom layers are visible. This tab will only be available when there are custom layers.
Packages Tab
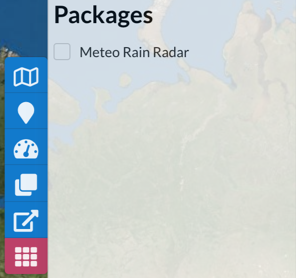
Description of illustration packages-tab.png
The Packages tab lets you select the packages that are visible.
Using the Context Menu
The Context menu has three modes: Measuring, Geofencing, and Show Coordinates.
Measuring Mode
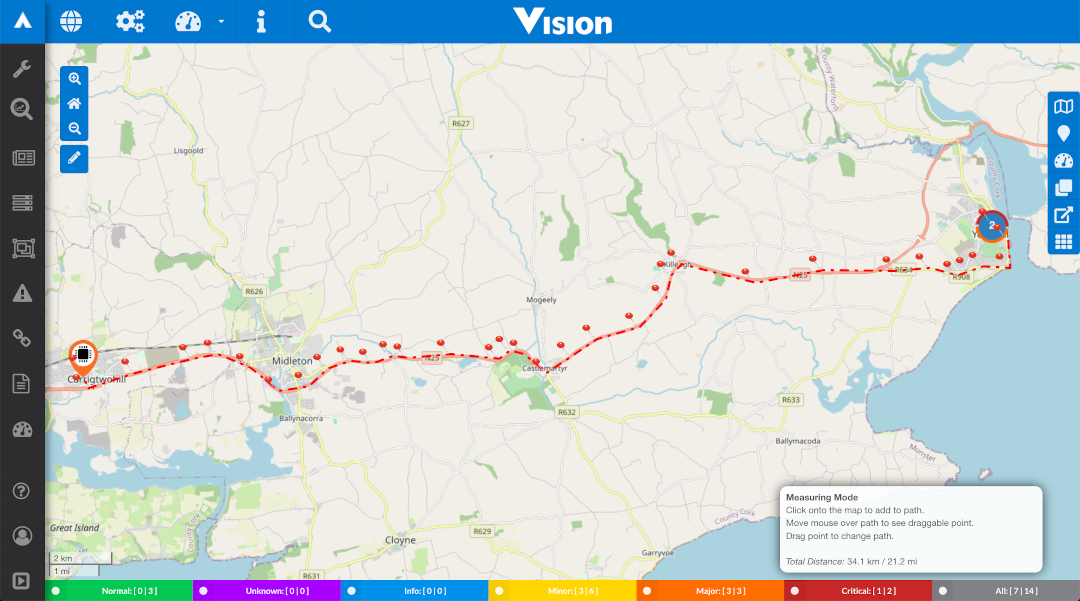
Description of illustration measure-distance-tool.png
-
Right-click the map and select Measure Distance to create a pin at the location of the right-click.
-
Left-click the map to create additional pins.
-
The right-hand side of the screen shows the total distance between the start and end points.
-
Hover over the line between points to see a green ball. Click and drag this ball to add an additional pin to the line.
-
Left-click a pin to delete it. Measuring mode redraws the line between the remaining pins.
-
Drag pins around the screen as required.
-
Click the button on the left-hand side of the screen to end measuring mode (same button that appeared when it was enabled). Or, right-click on screen again and select End Measure Mode.
Geofencing Mode
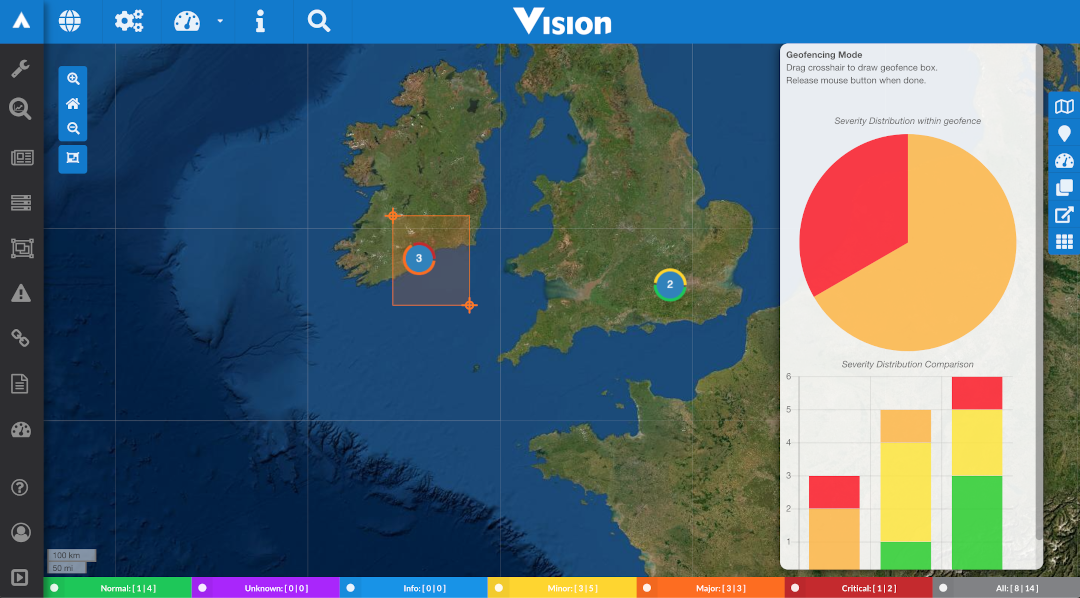
Description of illustration geofencing-tool.png
-
Right-click the map and select Geofencing to create a crosshair at the location of the right-click. This indicates the start point of the geofencing box.
-
Drag this crosshair around the area where you want data.
-
The right-hand side of the screen shows the severity distribution information regarding the events within the box you created.
-
Drag one of the two corner markers to adjust the geofence area. The data in the box will update to show the new selection.
-
Click the button on the left-hand side of the screen to stop the geofencing mode or right-click and select End Geofencing.
Show Coordinates
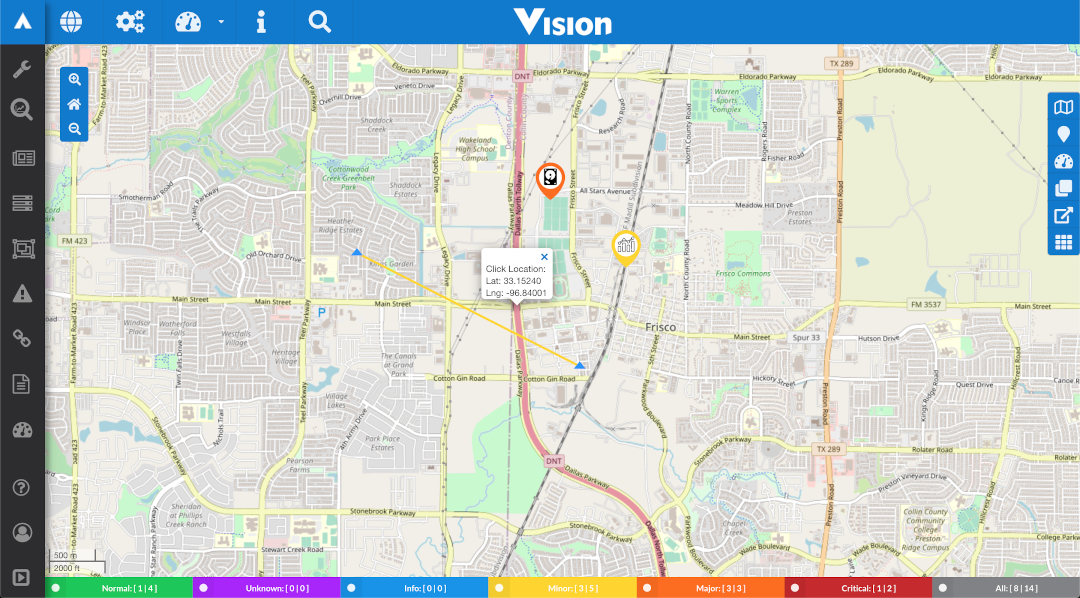
Description of illustration show-coordinates-tool.png
Right-click the map and select Show Coordinates. A pop-up on the map shows the latitude and longitude at the location of the right-click.