Understanding Events on the Map
Events are added to Vision by streaming them directly from Unified Assurance. Events in Unified Assurance will also be enriched with coordinates, weather and power data (where available). Events within Vision are colour coded to correspond with their severity. This colour coding is as follows in order of highest to lowest:
- Critical – Red
- Major – Orange
- Minor – Yellow
- Info – Blue
- Unknown – Purple
- Normal – Green
Each section in the severity bar has two numbers; the first is the number of events currently on the map matching that severity, the second is the total number of events matching that severity in Vision including those events not currently displayed on the map.

Description of illustration event-severity-filter-bar.png
Events are represented on the map in a number of formats:
- Single Marker Events.
- Clustered Marker Events
- Link Events.
- Dashboard Events.
Single Marker
A single marker event appears on the map as shown in the following figure.
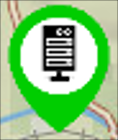
Description of illustration single-marker-event.png
The icon in the centre of the marker indicates the layer of the associated event. The colour of the marker reflects the severity of the event. In the given example, the code is green for normal.
Clustered Marker Events
Single marker events are clustered together to prevent over saturation of the map. This occurs when, at the current zoom level, any markers are too close to each other to be displayed separately. A cluster of markers appears like this on the map:

Description of illustration clustered-event-markers.png
The number in the centre represents the number of events within that cluster. The coloured segments around the outside of the centre blue circle show the percentage of markers of each severity within that cluster.
Link Events
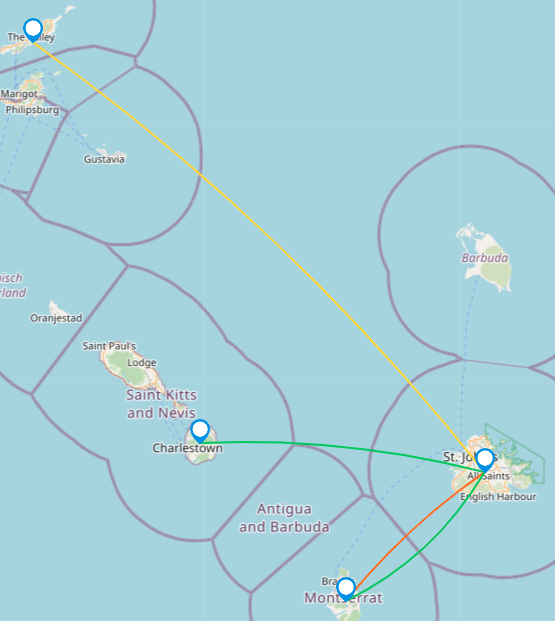
Link events will display on the map as a coloured line. The colour of the line represents the severity of the event.
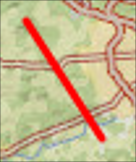
Description of illustration link-event.png
When at a higher zoom level, the event will show the line but also blue triangles that represent the entities at either end of the link, as shown in the following figure.
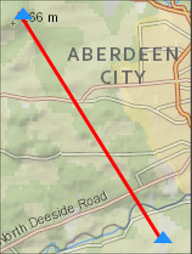
Description of illustration zoomed-link-event.png
Dashboard Events
Dashboard events will be displayed when a Dashboard has been configured to be shown on the map.
Description of illustration dashboard-event.png
To learn more about Dashboards, read about dashboards and their links here.