Understanding the Metric Pipeline
Learn about how the metric microservice pipeline works in Oracle Communications Unified Assurance.
About the Metric Pipeline
The metric pipeline collects performance metrics and key performance indicators (KPIs), processes them, and inserts them into the Metrics database. This pipeline helps provide insights into the health and behavior of network services, and enables you to monitor and analyze your networks and devices.
The following figure shows the flow of the metric pipeline.
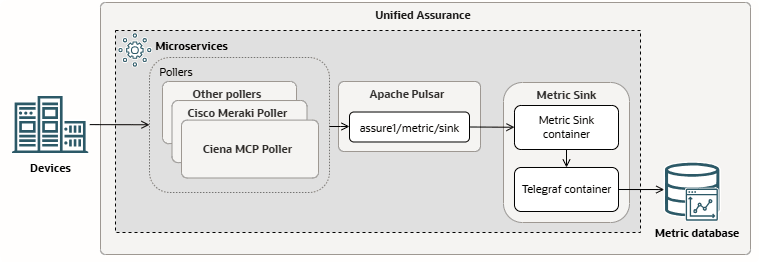
Description of illustration metric-microservice-pipeline.png
Metric Pipeline Components
The metric pipeline consists of the following components, sorted by component type and location in the pipeline:
| Type | Component | Description |
|---|---|---|
| Microservice | Ciena MCP Poller | Polls metrics from Ciena MCP devices and publishes them to the assure1/metric/sink topic. |
| Microservice | Cisco Meraki Poller | Polls metrics from Cisco Meraki devices and publishes them to the assure1/metric/sink topic. |
| Microservice | Netapp Poller | Polls metrics from the Netapp ONTAP REST API and publishes them to the assure1/metric/sink topic. |
| Microservice | Aruba Central Poller | Polls metrics from HPE Aruba Networking Central and publishes them to the assure1/metric/sink topic. |
| Microservice | Mist Poller | Polls metrics from the Mist REST API and publishes them to the assure1/metric/sink topic. |
| Microservice | Metric Sink | Reads metrics from assure1/metric/sink and inserts them into the Metrics database. |
| Supporting Microservice | Prometheus | Collects performance metrics from microservices and inserts them into the Metrics database. This microservice is not shown in the figure. It runs in the background for all microservices. Note: The self-monitoring metrics collected by Prometheus are not part of the metric microservice pipeline. |
| Supporting Microservice | Apache Pulsar | Provides the messaging framework for pipeline microservices to publish and read data. |
| Supporting Microservice | Telegraf | The Metric Sink microservice uses Telegraf to insert metrics into the Metrics database. Telegraf is automatically included as a pod within the deployment when you deploy the Metric Sink microservice. You do not need to deploy it separately. |
| Pulsar Topic | assure1/metric/sink | The poller microservices publish metric data here, Metric Sink microservice subscribes. |
| Database | Metric InfluxDB Database | The Metric Sink microservice inserts metrics here. |
Metric Pipeline Flow
The metric pipeline flow is as follows:
-
The various pollers collect metric data from the respective devices.
-
The pollers publish the metric data to the assure1/metric/sink topic.
-
The Metric Sink microservice reads the metrics from assure1/metric/sink and publishes them to the Metrics database using two containers:
-
The Metric Sink container reads the metrics from assure1/metric/sink, translates it into a format understood by Telegraf, and sends the translated metrics on the local host within the pod to the Telegraf container.
-
The Telegraf container publishes the metrics directly to the Metrics database.
-
Related Topics
For general information about microservices and microservice pipelines, see Understanding Microservices and Understanding Microservice Pipelines.
For information about deploying and configuring the microservices in this pipeline, see the following topics in Unified Assurance Implementation Guide: