Using the Guided Network Discovery Flow
This chapter describes the guided Network Discovery flow, a step-by-step process for creating and running a Network Discovery Job in a structured, guided manner. A Network Discovery Job scans your network using preferred protocols on scheduled intervals to keep your inventory up to date.
You can access the guided Network Discovery flow from the Network Discovery UI by clicking Create Discovery Job.
Note:
The guided Network Discovery flow is a separate process from the legacy SOA applications discovery process. You can use existing device zones and device groups, but Network Discovery does not reuse any other existing SOA discovery configurations, such as inclusion and exclusion profiles, access profiles, discovery jobs, and pollers. If you have already discovered devices using SOA applications or the legacy microservice flow, you must rediscover them to monitor them in NPM dashboards.
About the Network Discovery UI
You can use the Network Discovery UI to view previously created discovery jobs and to create new jobs.
To open the Network Discovery UI, from the main navigation menu, select Configuration, then Metrics, then NPM, and then Discovery Jobs.
Note:
To access this UI, you need to deploy the Web UI and Web API microservices. See Setting Up Microservices for NPM.
The interface includes the following key components:
-
Search and filters: Lets you search jobs by name, status, or zone. Use the filter chips to filter the job list (for example, by Created On, Discovered, Last Run, Name, Status, and Zone).
-
Create Discovery Job button: Opens the Create Discovery Job guided flow to create a new discovery job.
-
Jobs table: Lists previously created discovery jobs with each row representing one discovery job.
Jobs Table
The jobs table displays all the discovery jobs along with key details in the following columns:
-
Name: The job name.
-
ID: The unique identifier for the job.
-
Zone: The zone associated with the job.
-
Created On: The date and time the job was created.
-
Last Run: The date and time the job most recently ran.
-
Schedule: The configured schedule for the job. If no schedule is configured, this may be shown as -.
-
Discovered: The number of devices discovered by the job.
-
Status: The current state of the job such as Completed or In Progress.
-
Run: Runs the selected discovery job.
-
More actions (ellipsis menu): Actions available for the particular job, such as editing, cloning, or deleting depending on the availability.
Creating a Discovery Job
The guided Network Discovery window that opens up when you click Create Discovery Job contains a panel with the following tasks:
Add Discovery Details
In this section, provide the following details to create a discovery job:
-
Name: Enter a unique name for the discovery job.
-
Description: Optionally enter a description to help identify the purpose of the job.
-
Tenant: Select the tenant that owns the discovery job. The selected tenant determines the device groups available for selection.
-
Device Group: To select a device group, click Select Group. In the selection drawer, search or browse the Device Groups hierarchy, expand groups as needed, and select one group. The flow displays the selected group and its parent group. The selected group is used as the parent context for devices added to monitoring. See Device Group Placement for more information.
Note:
Discovery jobs created before device group selection was introduced use the Root device group after upgrade. To associate devices with another group, edit the job and select a different device group.
When you edit or clone a discovery job, the flow loads the saved device group. If the saved group no longer exists or cannot be resolved, select a replacement device group before saving the job.
If the device group that you want to use does not exist, create it before creating the discovery job. See Device Groups for more information.
-
Zone: Select the device zone in which to run the discovery job.
Select Discovery Method
Choose the discovery methods you want to use to scan and identify devices.
The discovery methods are organized into the following levels:
-
Level 1 - Basic Reachability
-
ICMP Availability: Uses ICMP ("ping") to check if devices are reachable.
-
ICMP Performance: Uses ICMP to gather performance-related measurements.
-
-
Level 2 - Standard Protocols
-
SNMP Availability: Uses SNMP to retrieve device information such as status, interfaces, and performance metrics.
-
SNMP Performance: Uses SNMP to gather detailed performance-related data from devices.
-
gNMI: Uses gNMI to discover and monitor supported devices.
-
-
Level 3 - API Based Integrations
-
VMware: Uses VMware APIs to discover and retrieve information about virtual infrastructure.
-
Cisco Meraki: Uses Cisco Meraki APIs to discover and monitor Meraki-managed environments.
-
Aruba: Uses Aruba APIs to discover and monitor Aruba-managed environments.
-
Cisco DNA: Uses Cisco DNA APIs to discover and monitor supported devices.
-
For each selected discovery method, click the clock icon to open the Define Poll Interval dialog box. The dialog box displays only the poll-interval fields that apply to the selected method.
-
For ICMP Availability and SNMP Availability, set the Availability Poll Interval.
-
For ICMP Performance, SNMP Performance, gNMI, Cisco Meraki, Cisco DNA, and Aruba, set the Performance Poll Interval.
-
For VMware, set both the Availability Poll Interval and the Performance Poll Interval.
The availability poll interval controls how often Unified Assurance collects availability-related information. The performance poll interval controls how often it collects performance-related information.
Define Network
Specify the IP addresses you want to scan to discover devices. Select the IP address version and provide targets using IP ranges, subnets, or individual IPv4 addresses, and optionally list addresses to exclude from discovery.
Note:
You can only select IPv4 for the IP address version.
Assign Profiles
Assign the protocol-specific profiles required to authenticate to devices during discovery. A profile stores the connection and authentication details required to access targets during discovery.
Note:
You can only assign authentication profiles for discovery methods from Level 2 - Standard Protocols and Level 3 - API Based Integrations in the Select Discovery Method section.
For the SNMP discovery method, click Add Profile. In the profile drawer, select Select Existing to choose one or more profiles from the shared SNMP Access profile list, or select Create New to create an SNMP access profile. A profile created from the Guided Discovery flow is added to the same shared SNMP Access configuration and is available for future selection. See SNMP Access for information about managing SNMP access profiles. The form you get when you click Create New for creating a new SNMP access profile does not contain fields for tenant and zone as these details will be taken from the Add Discovery Details tab.
The selected profiles apply to the SNMP protocol for the discovery job. They are not associated one-to-one with the IP addresses, subnets, or ranges specified in Define Network. Unified Assurance uses the selected profiles as appropriate when communicating with discovered devices.
For the gNMI discovery method, provide the connection details in the gNMI profile form. The current flow supports only one gNMI profile.
For each selected Level 3 API-based integration, assign one integration-specific profile. The profile contains the connection and authentication details for the API integration and is not associated with an IP address, subnet, or IP range.
Configure Schedule
Set when the discovery job runs, including the scheduling mode, start date, and time. You can also choose how to handle discovered devices for monitoring; either review and select devices to monitor or automatically monitor all results. Optionally, run the discovery job immediately after creating it.
Managing Discovered Devices
After a discovery job runs successfully, you can review the devices found by the latest successful scan and choose which devices to monitor from the Discovery Job Results page. To open the results for a discovery job, go to the Network Discovery UI and select the discovery job name from the jobs table. The results page shows the job name, status, zone, discovery method, run time, and run duration.
The Discovery Job Results page also contains Discovered and Under Monitoring tabs.
The Discovered tab lists all devices discovered by the discovery job. You can use the search field to search by device name, IP address, or device type. You can also filter results by values such as device type, discovery method, IP address, and last discovered time.
To start monitoring discovered devices and optionally filter object instances:
-
On the Discovered tab, do one of the following:
-
Select one or more devices, then click Monitor Selected.
-
Click Monitor All Discovered to monitor all devices returned by the discovery job.
-
-
In the Select Object Type and Interfaces drawer, select the object or interface types to monitor. To filter a selected object or interface type, complete the following steps for each item that you want to filter:
-
Select the object name, then click the filter icon in the Set Filter column.
-
In the Set Filter drawer, define the filter criteria. Use filters to avoid monitoring instances that are not required for your environment.
-
Click View Results, then select a device to preview the instances that match the criteria.
The results for the selected device are a preview only. When you start monitoring, Unified Assurance applies the filter to the object or interface type across all selected devices.
- Click Apply Filter.
!!! note: Instance filtering explained in this step is only applicable for SNMP devices.
-
-
In the Select Object Type and Interfaces drawer, click Start Monitoring.
Filters are stored for individual devices. When you monitor one device, previously applied filters for that device are available in the filtering flow. When you monitor multiple devices or all discovered devices, Unified Assurance does not display a combined list of previously applied filters.
Note:
-
When an availability object and a performance object have the same name, Unified Assurance also applies the filter configured for the availability object to the corresponding performance object.
-
When you edit a monitoring selection, Unified Assurance replaces the previously selected device objects and object instances with those in the updated configuration for the selected devices. It does not add the updated selection to the previous configuration. For example, if you initially configure five interfaces for Device A and Device B each, then later update the configuration to select three interfaces only for Device A, Unified Assurance replaces the monitored-interface selection for Device A with the three updated interfaces. The configuration for Device B remains unchanged.
-
The Under Monitoring tab lists discovered devices that have already been added to monitoring. Use this tab to verify which devices from the discovery results are currently being monitored.
When you open a device, the Interfaces and Other Objects tabs on the Discovered tab show all instances identified during discovery. For the same device on the Under Monitoring tab, these tabs show only the instances added to monitoring.
Device Group Placement
When you add discovered devices to monitoring, Unified Assurance associates them with the device group selected for the discovery job. The selected group provides the parent context for the discovered devices.
The following diagram provides a possible representation of device group placement:
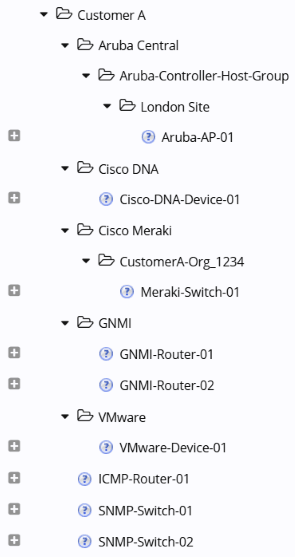
Description of fig-device-group-placement.png
For example, if you select the CustomerA device group for a discovery job:
-
ICMP and SNMP devices are associated directly with CustomerA.
-
gNMI devices are associated with a GNMI child group beneath CustomerA.
-
Devices discovered through API-based methods are organized in protocol or vendor-specific child groups beneath CustomerA.
Unified Assurance creates or reuses the required child groups beneath the selected device group. For example, if CustomerA already contains a GNMI child group, additional gNMI devices discovered by the job are associated with that group. If a different job selects CustomerB, Unified Assurance creates or uses a separate CustomerB/GNMI group.
If you change the device group for a discovery job, subsequent monitoring runs associate devices with the new group hierarchy. Existing device-group memberships remain unchanged. For example, if a job initially uses CustomerA and is later updated to use CustomerB, a device previously associated with CustomerA is also associated with CustomerB when it is monitored again.
Network Performance Management Reporting Guide
G49449-03
Copyright © 2026, Oracle and/or its affiliates.