Personal Protective Equipment Dashboard
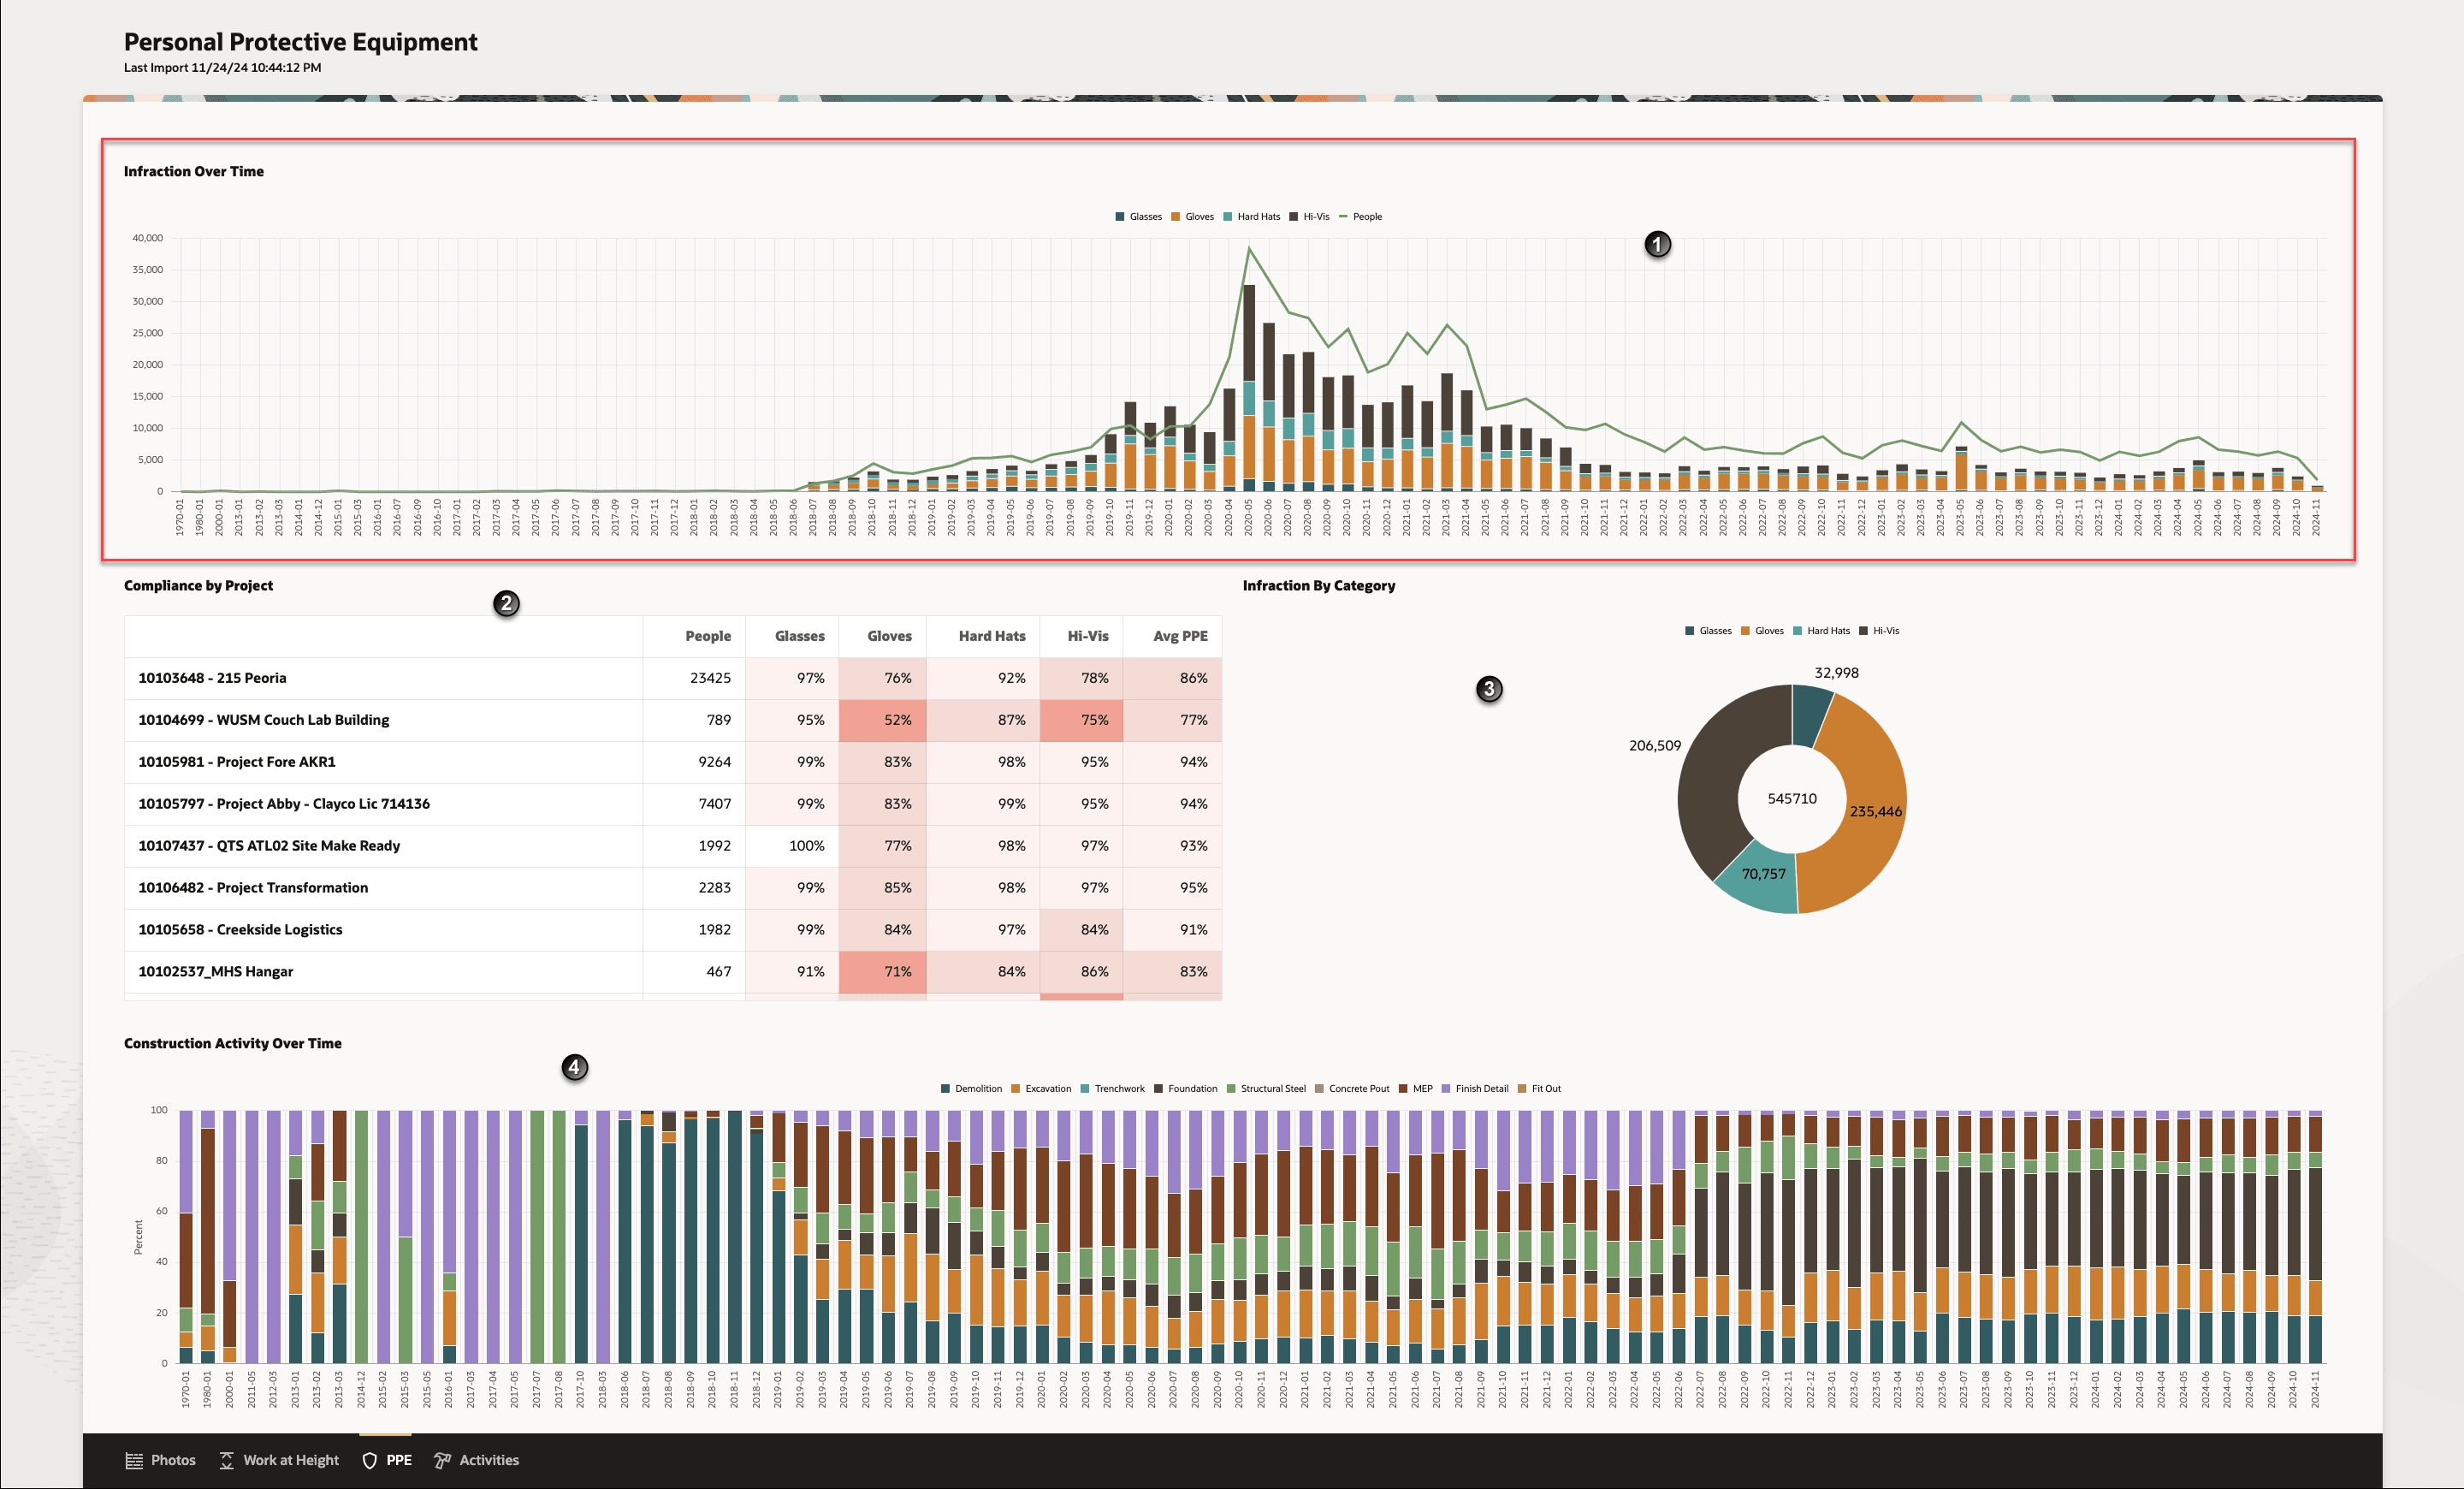
Use the Personal Protective Equipment dashboard to review the compliance of Personal Protective Equipment (PPE) at the job site.
You can use the data to analyze any potential safety risk at your job site. 
| Screen Elements | Description |
|---|---|
| 1 | Infraction Over Time: Displays the distribution of number of tags for Glasses, Gloves, Hard Hats, and Hi-Vis tags and the number of People tags among all the construction photos as monthly trend. |
| 2 | Compliance by Project: Displays the number of AI tags for People, and the compliance percentage of Glasses, Gloves, Hard Hats, Hi-Vis, and Average PPE among the construction photos available for each project in the form of heat map. The color coding is done as shades of red in the blocks of 0-50%, 51-75%, 76-90%, and 91-99% compliance. The color is white for 100% compliance. PPE associated with the construction photos for the chosen duration for each project group and project. |
| 3 | Infraction by Category: Displays the distribution of Glasses, Gloves, Hard Hats, and Hi-Vis tags in the form of donut chart. |
| 4 | Construction Activity Over Time: Displays the distribution of construction activities as monthly trend. The construction photos are tagged under the following categories: Demolition, Excavation, Trenchwork, Foundation, Structural Steel, Concrete Pout, MEP, Finish Detail, and Fit Out. |