Crop Monitoring with Visual Explorer
Visual Explorer Overview
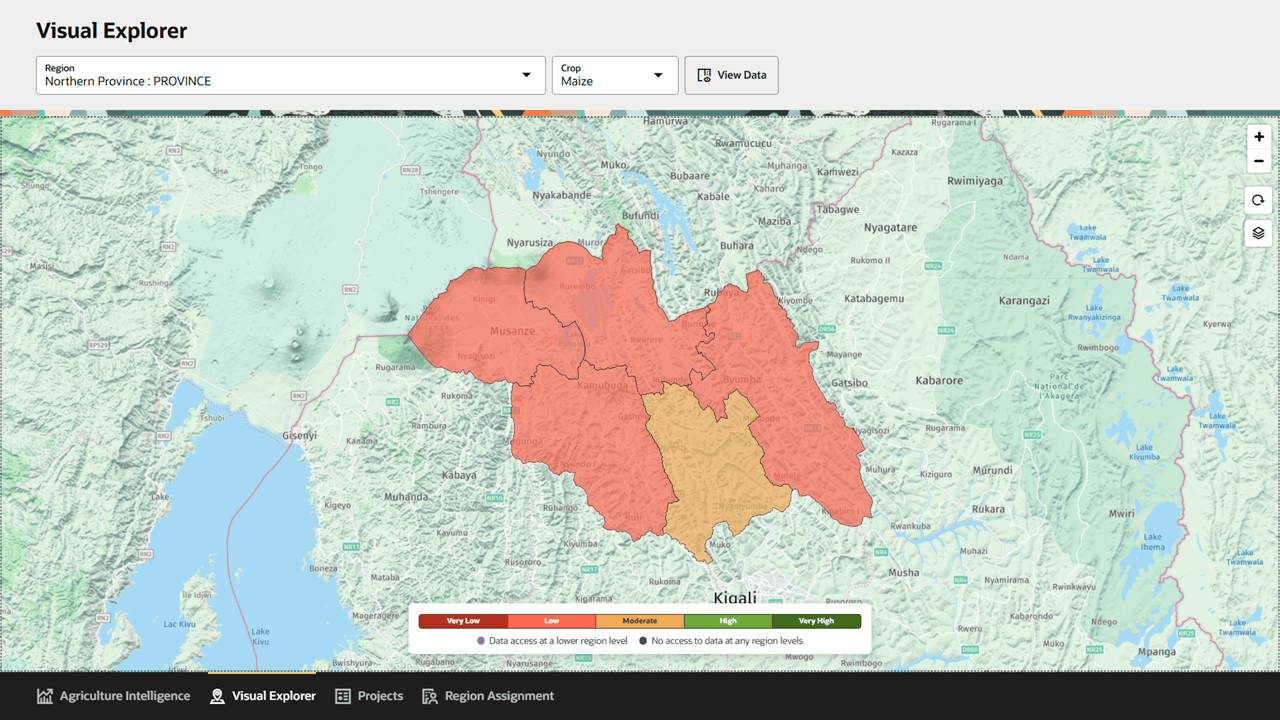
Understanding the Redesigned Visual Explorer
Visual Explorer is the map-first workspace for reviewing crop production forecasts and yield performance in Oracle Agriculture Intelligence. In version 1.2, Visual Explorer brings the map, region selection, crop selection, and data review workflow into a single exploration experience.
The redesigned page opens directly on an interactive map. Users select a region and crop from the controls at the top of the page, review yield categories on the map, and open region details when they need tables, history, charts, downloads, or sub-region comparisons.
Key Concepts in the New Workflow
The redesigned Visual Explorer is organized around a few core concepts:
- Region context, which defines the geographic area being explored.
- Crop context, which defines the crop or crops used for map shading, forecasts, and tabular results.
- Yield category, which classifies forecasted yield into Very Low, Low, Moderate, High, and Very High categories.
- Data access status, which indicates where data is available at lower region levels and where lower-level data is not available.
- Region details, which provides the analytical view for the selected region, including overview metrics, history, sub-region comparisons, chart views, and downloads.
This structure reduces the need to switch between separate Crop Production and Crop Performance pages. Users can stay in the map, inspect a region, and then open deeper detail when the analysis requires it.
What Changed from Version 1.1
In version 1.1, the documentation described separate Crop Production and Crop Performance views with a shared left-side analysis panel. Version 1.2 should describe Visual Explorer as a unified workspace:
- The main experience is now a full-width interactive map rather than separate analysis pages.
- Region and crop selectors sit at the top of the page.
- The View Data action opens a Region Details drawer for the current selection.
- Crop production, crop area, yield forecast, and yield category appear together in tables and summaries.
- Users can compare sub-regions in table form or switch to a chart view.
- Users can download data from the detail views.
- The map includes a yield category legend and data access indicators.
- Map interaction tools include zoom, refresh or recenter, and layers controls.
How Visual Explorer Fits Into the Agriculture Intelligence Workflow
Visual Explorer supports users who need to move from geographic patterns to evidence-based decisions. The map helps identify where crop yield categories vary across a region. The detail drawer then provides production forecasts, area detected, yield forecasts, historical values, and sub-region comparisons.
Users can use Visual Explorer to:
- Identify areas with low or very low yield categories.
- Compare production forecasts across regions and crops.
- Review historical production context before interpreting forecasts.
- Download data for reporting, analysis, or coordination.
- Use map-based evidence to inform insights, projects, and operational planning.
By combining map exploration with downloadable crop forecasting data, Visual Explorer gives users a faster path from regional pattern recognition to detailed agricultural analysis.