Crop Monitoring with Visual Explorer
Get to Know Visual Explorer
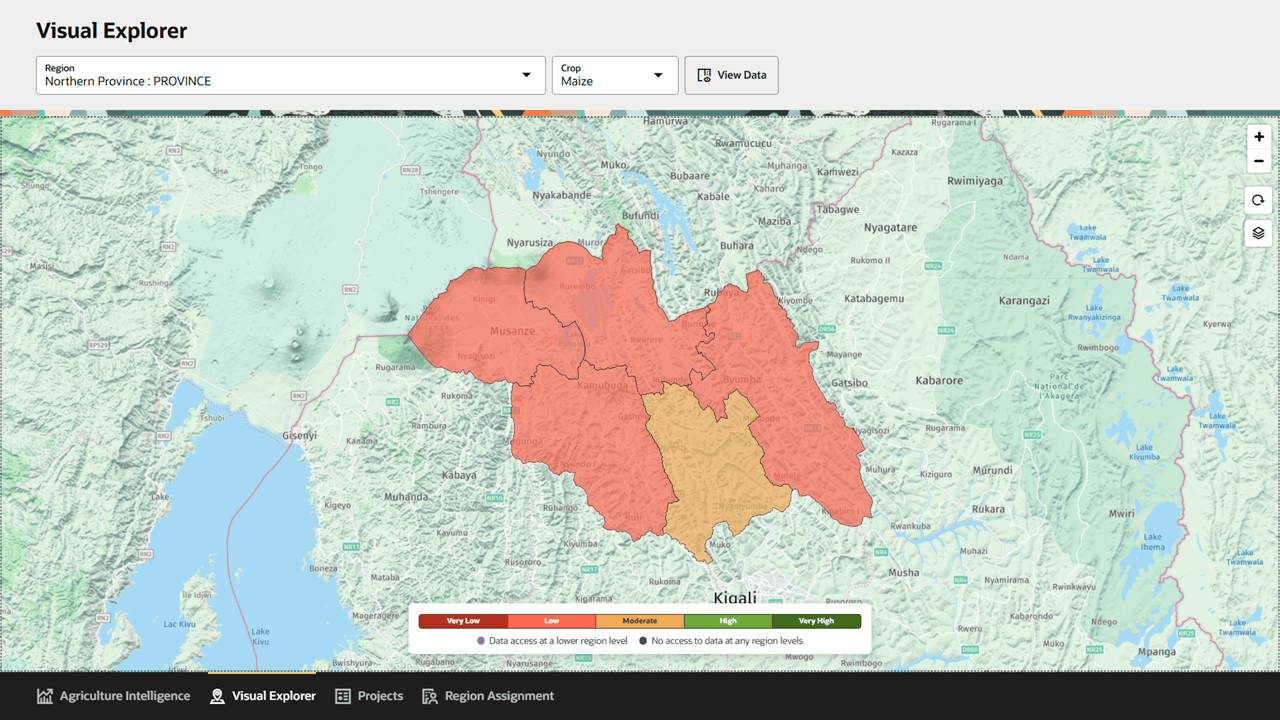
Visual Explorer provides a map-first view of crop production and yield forecast data. The redesigned page includes top-level filters, map controls, a yield category legend, and a Region Details drawer for deeper analysis.
Key Elements of the Visual Explorer Page
| Element | Description |
|---|---|
| Page title | Identifies the workspace as Visual Explorer. |
| Region selector | Sets the geographic context for the map and data views. The selector can include national, province, district, or other administrative regions, depending on configured region levels. |
| Crop selector | Sets the crop context for the map and detail views. |
| View Data | Opens the Region Details drawer for the selected region and crop. |
| Map | Displays the selected region and available sub-regions over the base map. Regions are shaded by yield category when forecast data is available. |
| Map controls | Provides zoom, refresh or recenter, and layer controls for navigating the map. |
| Yield category legend | Defines the colors used for Very Low, Low, Moderate, High, and Very High yield categories. |
| Data access indicators | Show whether lower-level data is available for a region. |
| Bottom navigation | Provides access to Agriculture Intelligence, Visual Explorer, Projects, and Region Assignment. |
Selecting a Region
The Region selector lets users change the geography used by Visual Explorer. The list can include multiple administrative levels, such as provinces and districts.
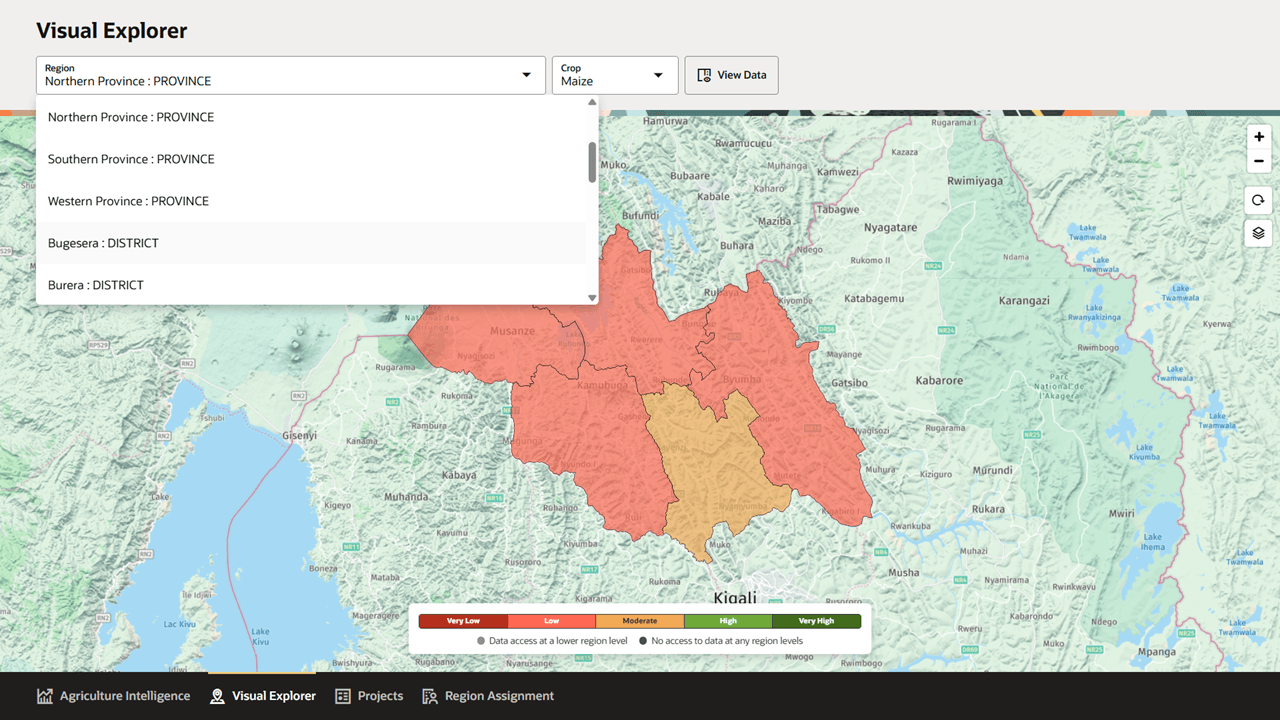
Selecting a region updates the map and sets the context used by the View Data action. If lower-level region data is available, the map can show sub-regions within the selected area.
Selecting a Crop
The Crop selector lets users choose the crop used for map shading, metrics, and forecasts.
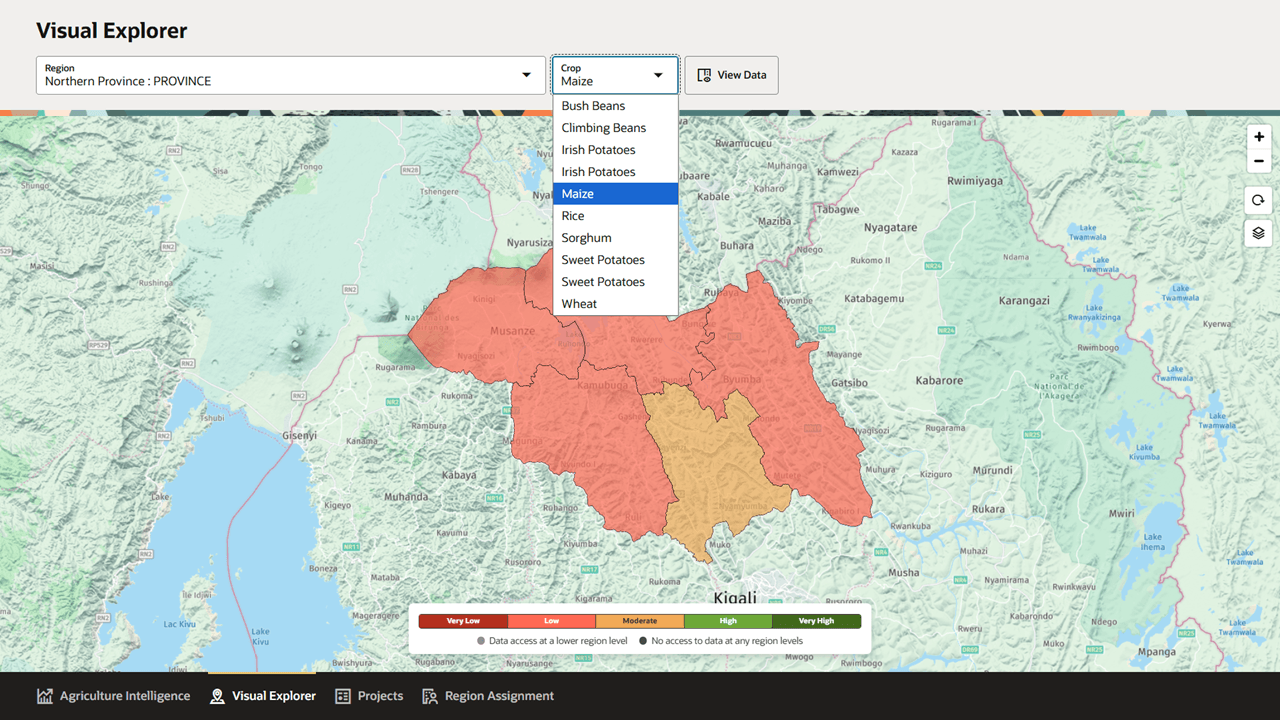
The crop list can include crops such as Bush Beans, Climbing Beans, Irish Potatoes, Maize, Rice, Sorghum, Sweet Potatoes, and Wheat. Available crops depend on the data configured for the selected geography.
Reviewing Map Details
Users can inspect regions on the map to review contextual values for the selected crop.
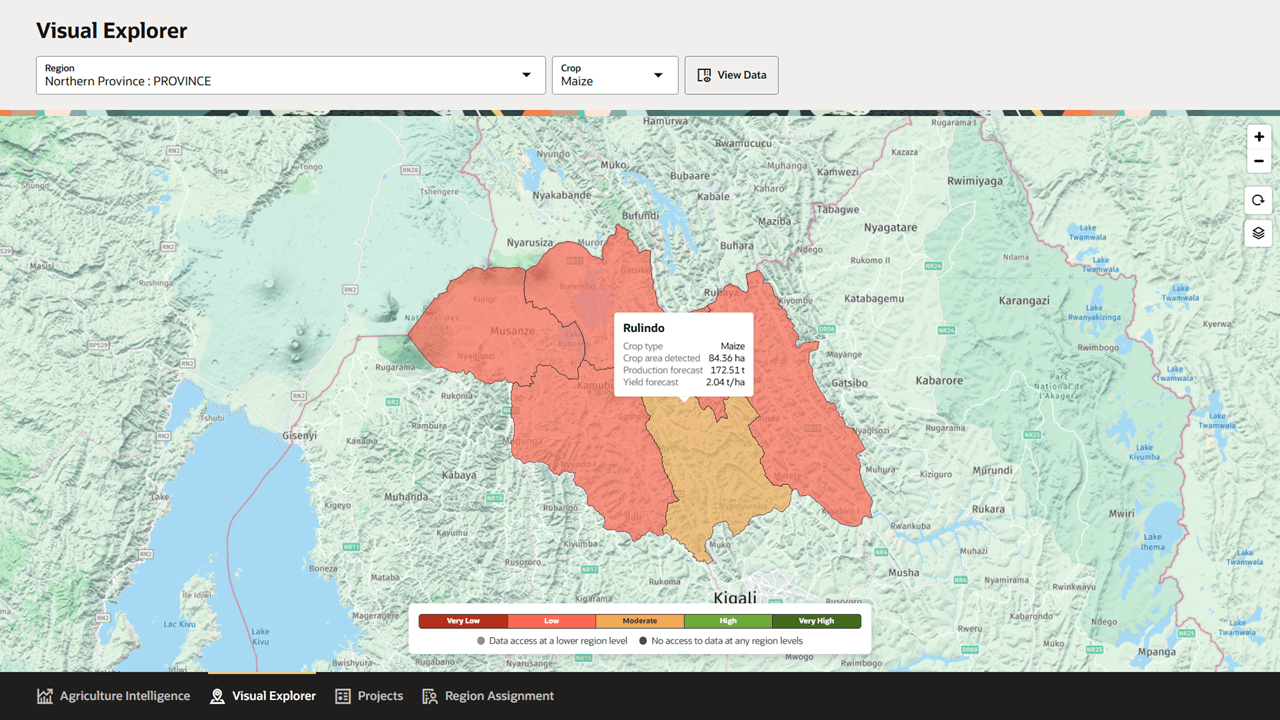
The map detail popover can show:
- Region name
- Crop type
- Crop area detected
- Production forecast
- Yield forecast
These map details help users quickly understand why a region is categorized as Very Low, Low, Moderate, High, or Very High before opening the full Region Details drawer.
Region Details Drawer
The View Data action opens the Region Details drawer. The drawer appears over the map and keeps the selected region visible in the breadcrumb.
The drawer includes:
- Region breadcrumb
- Crop selection control
- Action buttons for view options and filters
- Yield category thresholds link
- Overview, History, and Sub-Regions tabs
- Download controls where data export is available
- A close control to return to the map
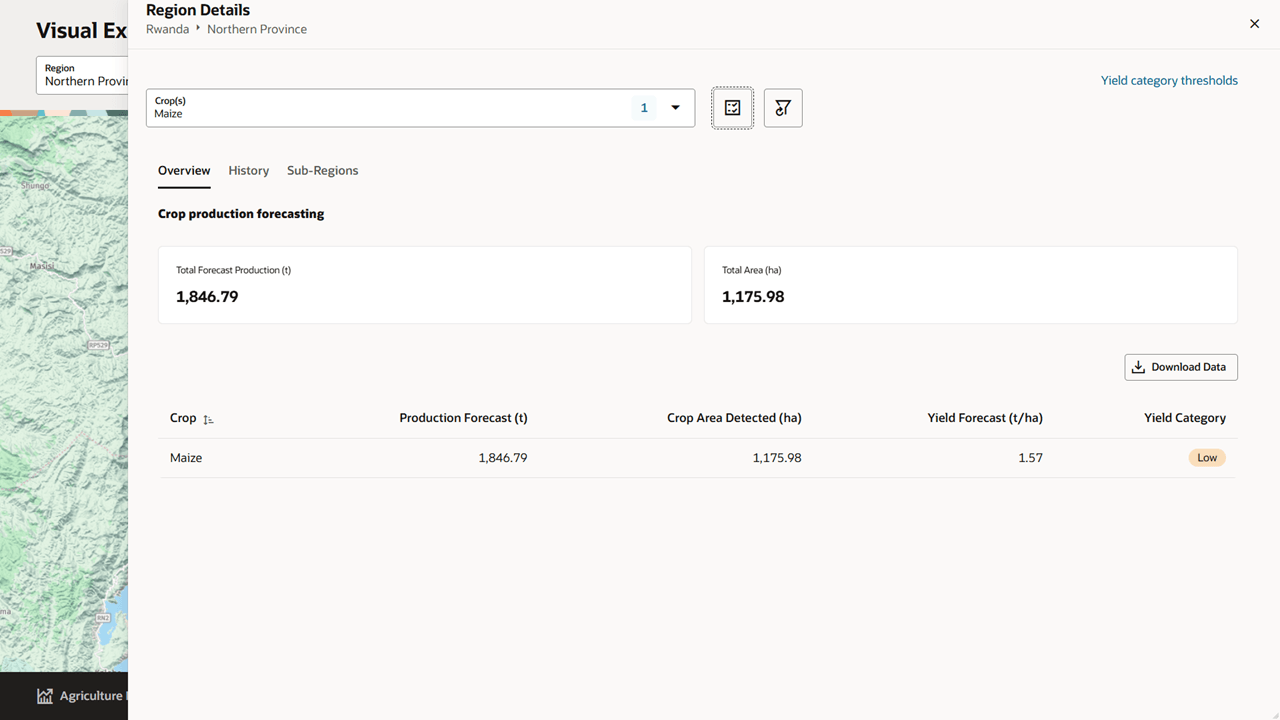
Overview Tab
The Overview tab summarizes the selected region and crop. It displays crop production forecasting metrics and a table with forecast values.
The overview can include:
- Total Forecast Production
- Total Area
- Crop
- Production Forecast
- Crop Area Detected
- Yield Forecast
- Yield Category
This tab is the best starting point for understanding the current forecast for the selected region.
History Tab
The History tab shows historical production information for the selected region and crop.
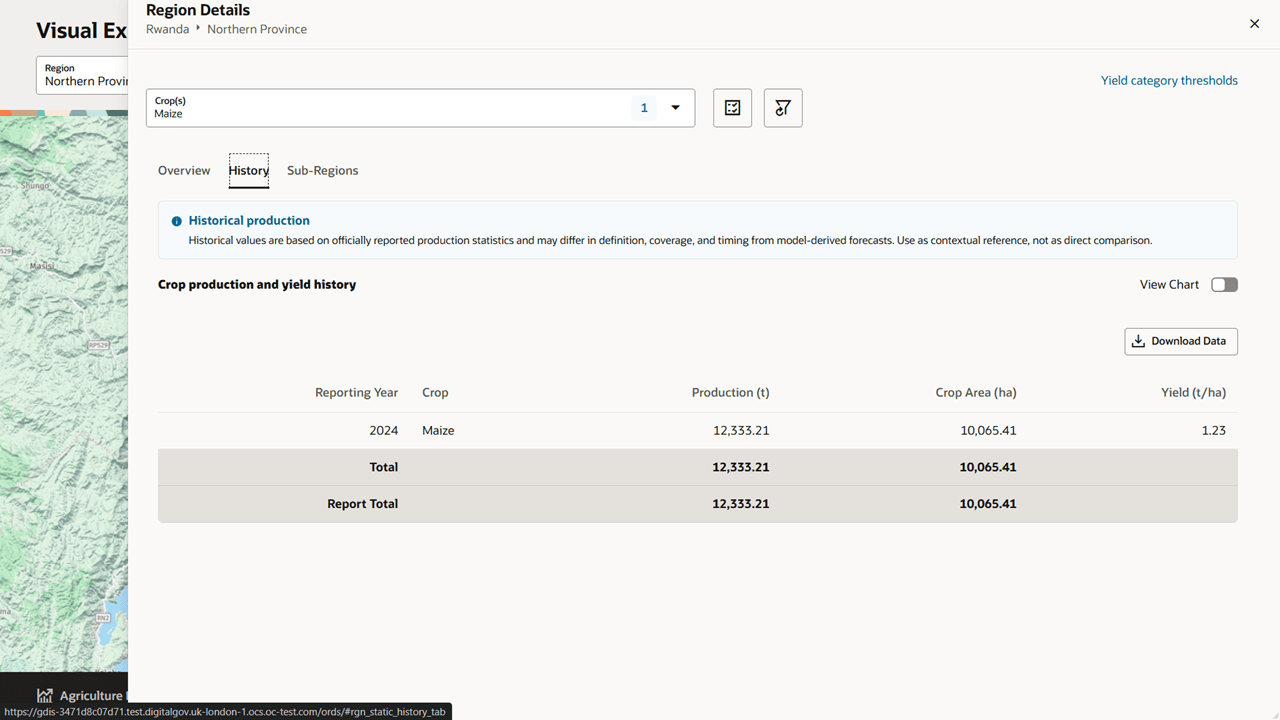
Historical values are based on officially reported production statistics and may differ in definition, coverage, and timing from model-derived forecasts. Use historical values as contextual reference, not as a direct comparison.
Users can review history as a table and, where available, switch to a chart view.
Sub-Regions Tab
The Sub-Regions tab compares forecast data across lower-level regions.
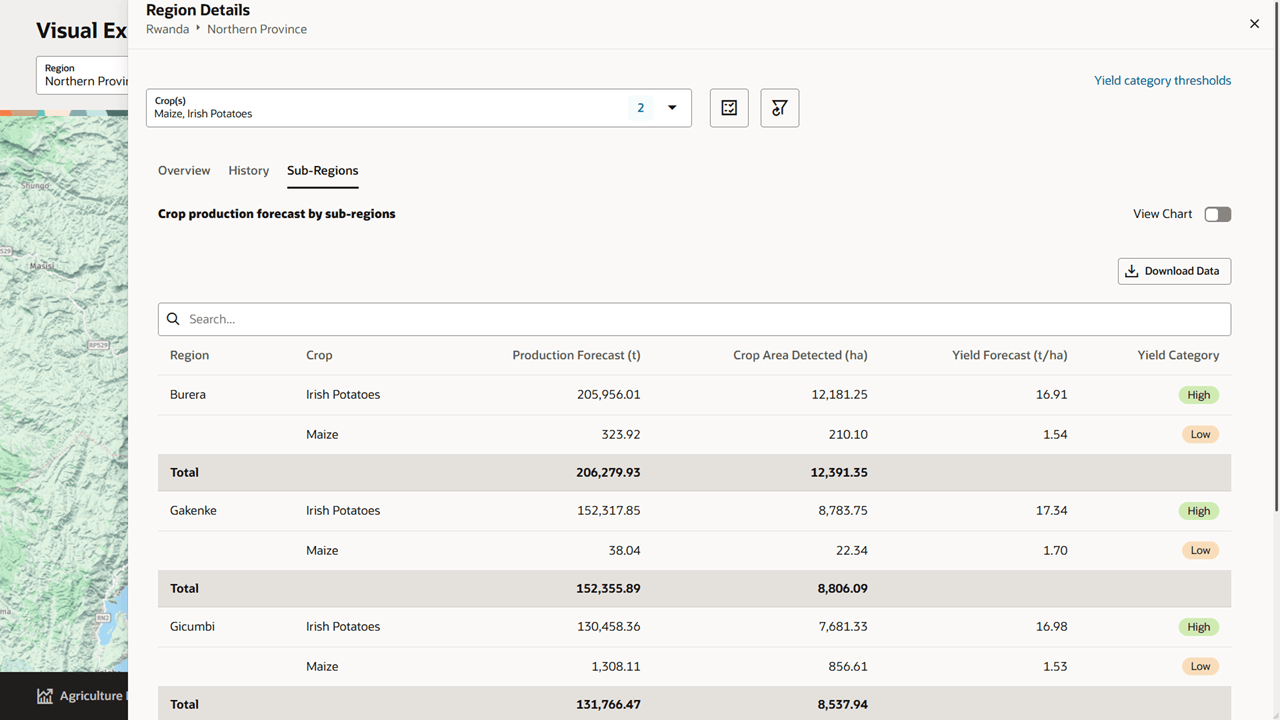
The table can include:
- Region
- Crop
- Production Forecast
- Crop Area Detected
- Yield Forecast
- Yield Category
- Regional totals
Users can search within the table and download the sub-region data.
Chart View
Some detail views include a View Chart toggle. When enabled, Visual Explorer displays the selected data as a chart above the table.
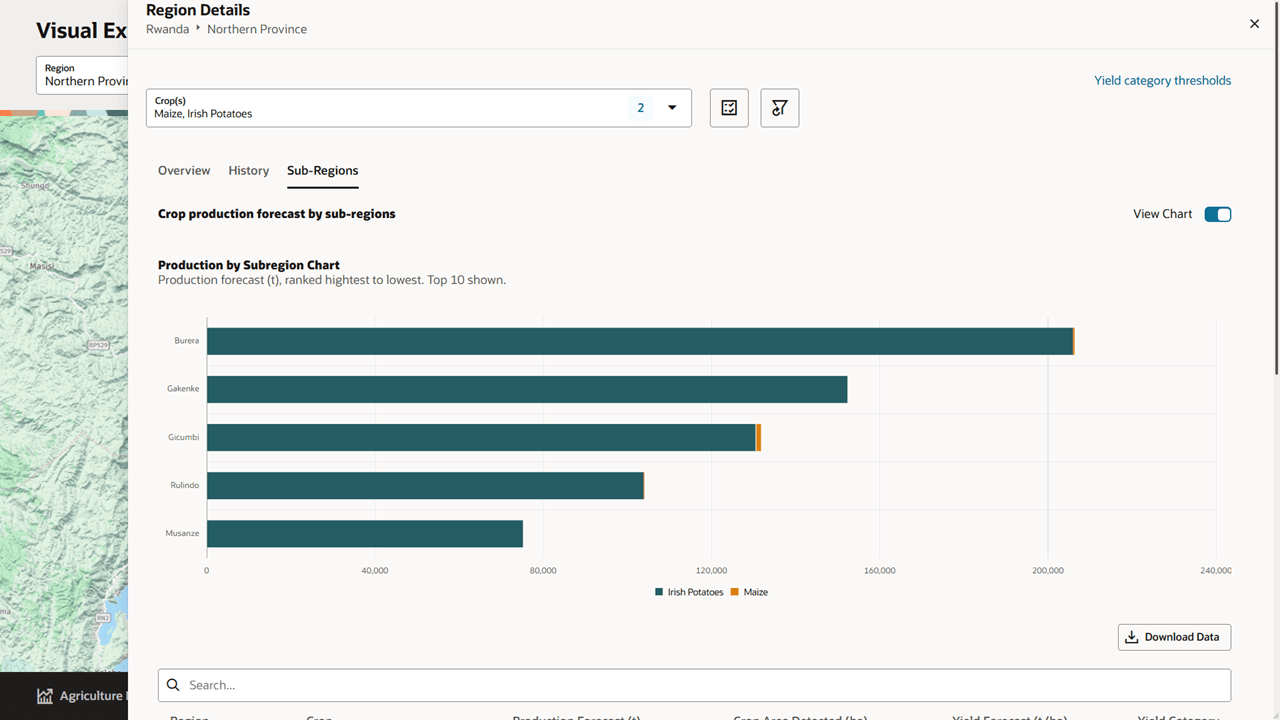
For sub-regions, the chart ranks regions by production forecast and shows the top results. When multiple crops are selected, each crop is shown in the chart legend.