Crop Monitoring with Visual Explorer
Common Visual Explorer Tasks
Task: Select a Region and Crop
This task explains how to define the geographic and crop context for analysis in Visual Explorer.
These are the steps needed to complete this task:
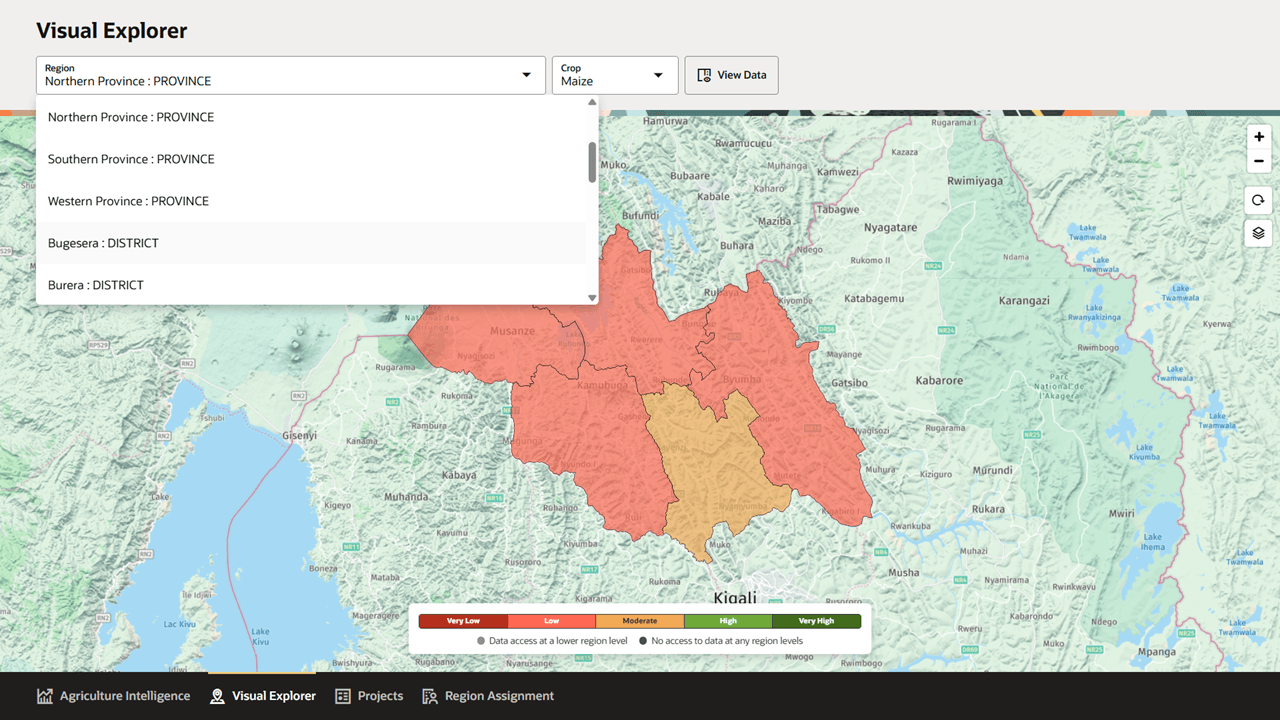
- Navigate to Visual Explorer from the bottom navigation bar.
- Select the Region field at the top of the page.
- Choose the country, province, district, or other administrative region you want to explore.
- Select the Crop field.
- Choose the crop you want to analyze.
- Confirm that the map updates for the selected region and crop.
After completing this task, the map and data views use the selected region and crop as the analysis context.
Task: Review Yield Categories on the Map
This task explains how to interpret the map view.
These are the steps needed to complete this task:
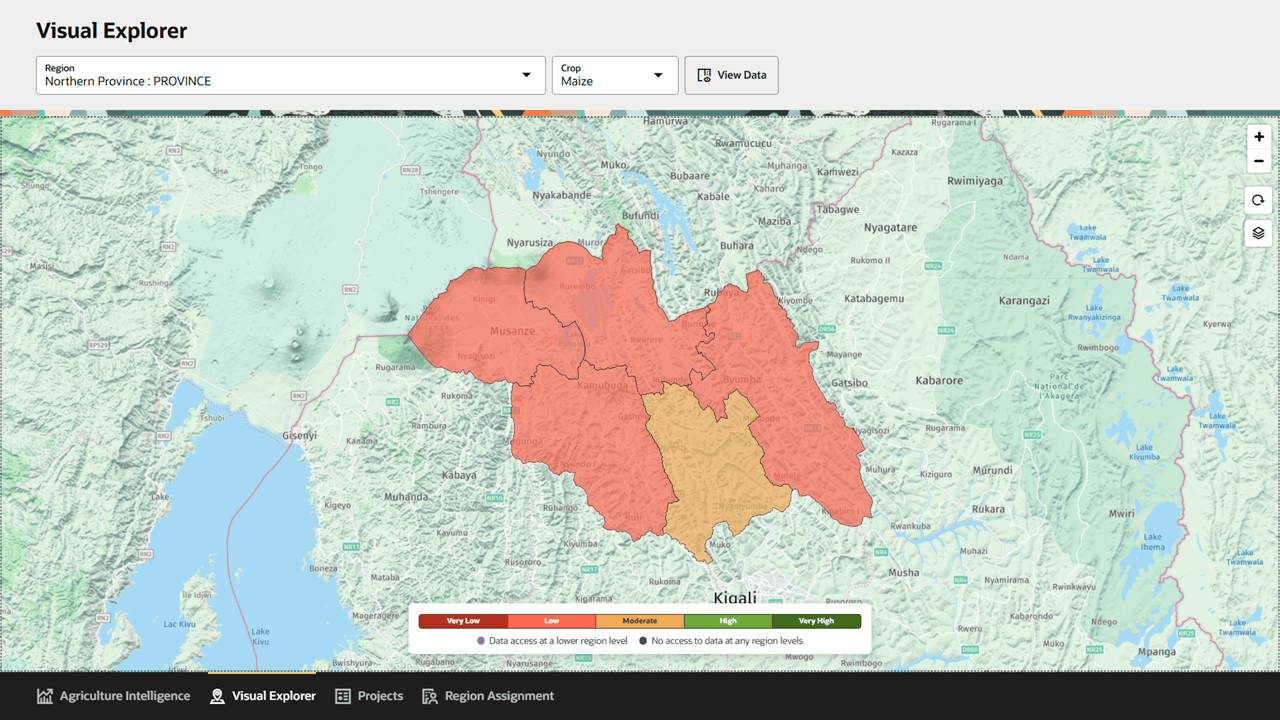
- Review the selected region on the map.
- Use the yield category legend to interpret region colors.
- Identify regions categorized as Very Low, Low, Moderate, High, or Very High.
- Review the data access indicators below the legend to understand whether lower-level data is available.
- Use zoom, refresh or recenter, and layer controls as needed to adjust the map.
After completing this task, you can identify where yield forecast conditions are strongest or weakest across the selected geography.
Task: Inspect a Region on the Map
This task explains how to view quick region details directly from the map.
These are the steps needed to complete this task:
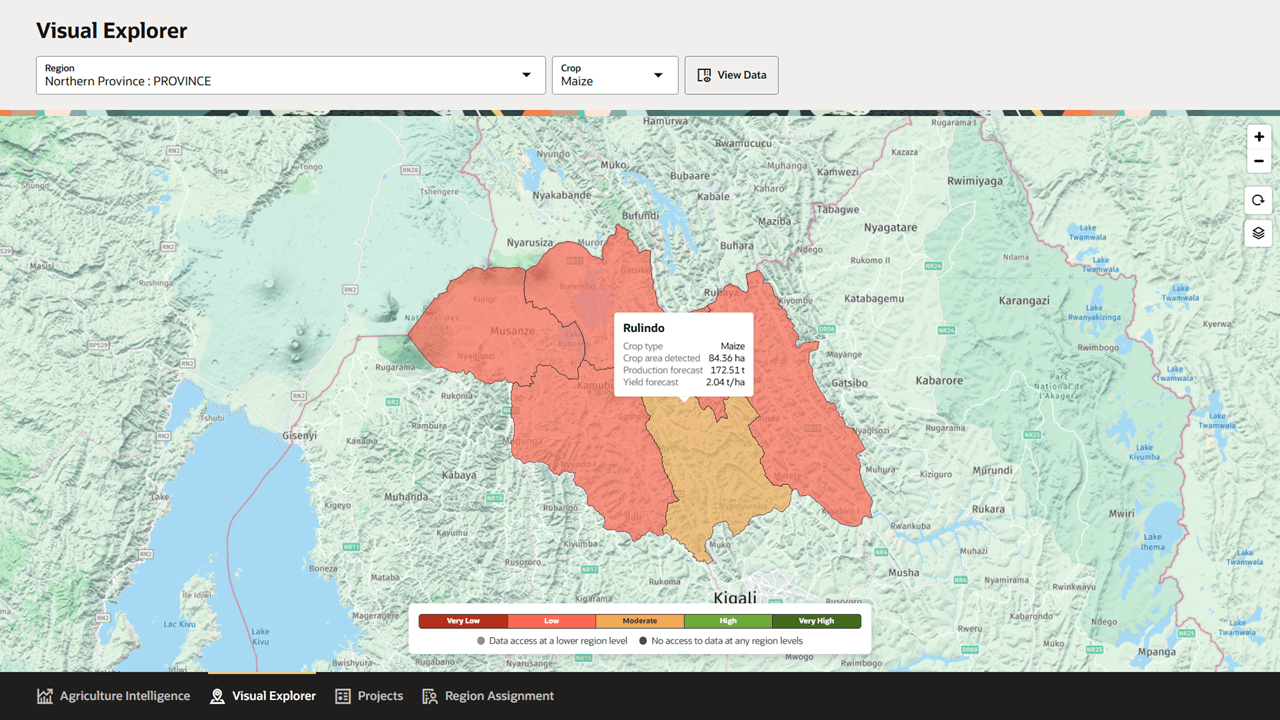
- Move the pointer over a region on the map.
- Review the popover for the region name and selected crop.
- Review the crop area detected, production forecast, and yield forecast.
- Compare the popover values with the yield category shown in the map legend.
After completing this task, you can quickly evaluate a region without opening the full Region Details drawer.
Task: Open Region Details
This task explains how to open the detailed analysis view for the selected region and crop.
These are the steps needed to complete this task:
- Select the region and crop you want to analyze.
- Select View Data.
- Confirm that the Region Details drawer opens.
- Review the breadcrumb to confirm the selected region.
- Use the drawer tabs to review overview, history, and sub-region information.
After completing this task, you can review forecast metrics and data tables for the selected region.
Task: Review Production Forecasting Overview
This task explains how to review current production forecast values for the selected region.
These are the steps needed to complete this task:
- Open the Region Details drawer.
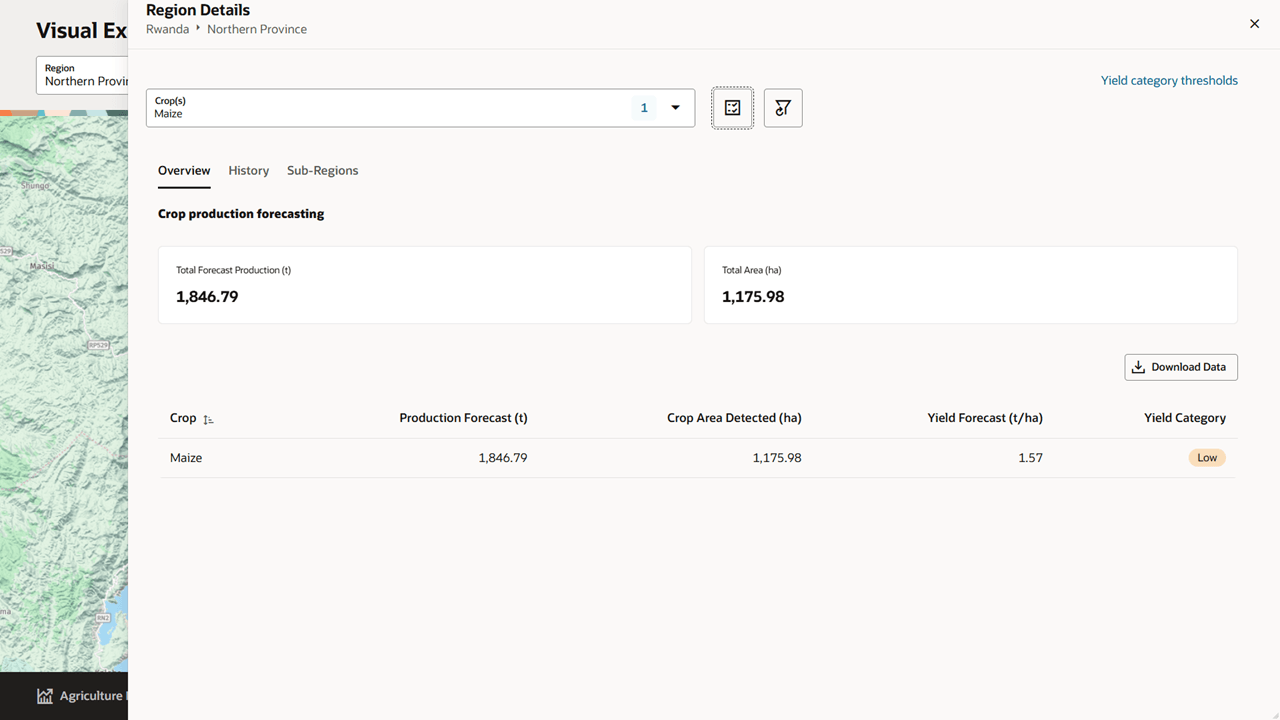
- Select the Overview tab.
- Review Total Forecast Production.
- Review Total Area.
- Review the table values for production forecast, crop area detected, yield forecast, and yield category.
- Select Download Data if you need to export the overview data.
After completing this task, you understand the current forecast for the selected crop and region.
Task: Review Historical Production
This task explains how to review historical production values.
These are the steps needed to complete this task:
- Open the Region Details drawer.
- Select the History tab.
- Review the historical production note.
- Review the table values for reporting year, crop, production, crop area, and yield.
- Turn on View Chart if you want to see the data as a chart.
- Select Download Data if you need to export historical values.
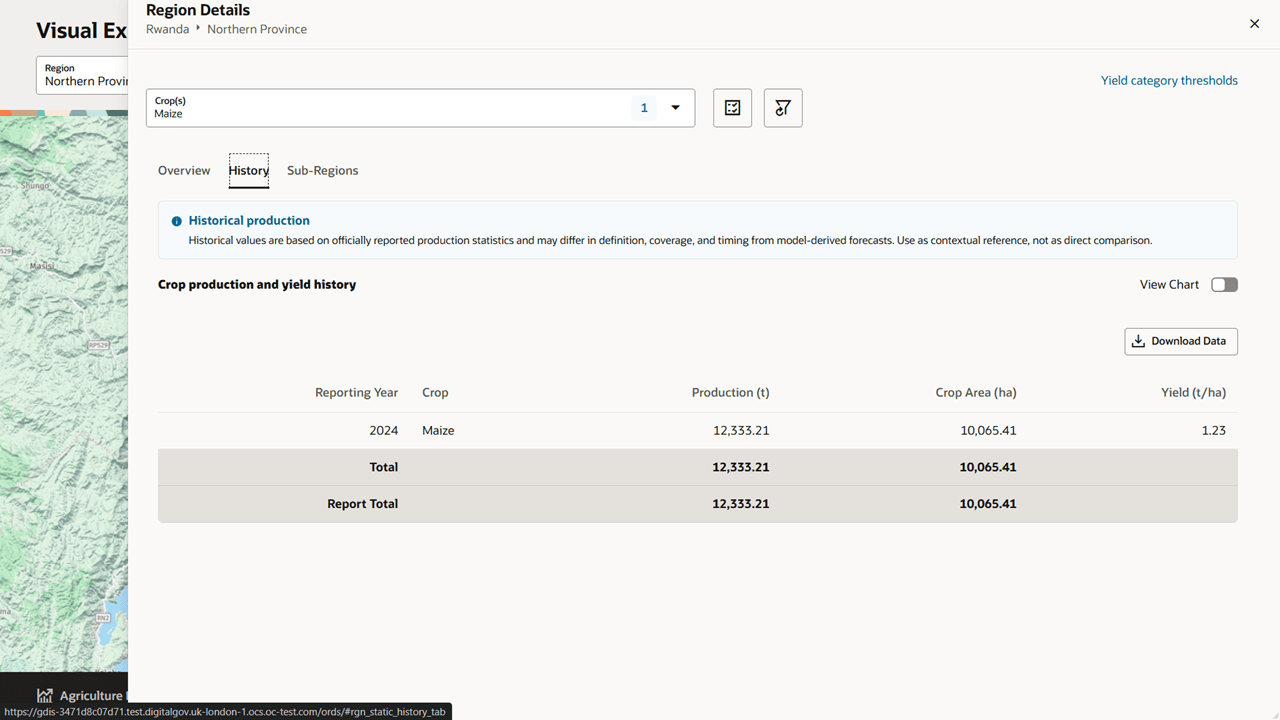
After completing this task, you have historical context for the selected region and crop.
Task: Compare Sub-Regions
This task explains how to compare crop production forecasts across lower-level regions.
These are the steps needed to complete this task:
- Open the Region Details drawer.
- Select the Sub-Regions tab.
- Use the crop selector if you want to include more than one crop.
- Review the table by region, crop, production forecast, crop area detected, yield forecast, and yield category.
- Use Search to find a specific sub-region or crop.
- Review regional totals where they appear in the table.
- Select Download Data if you need to export the sub-region data.
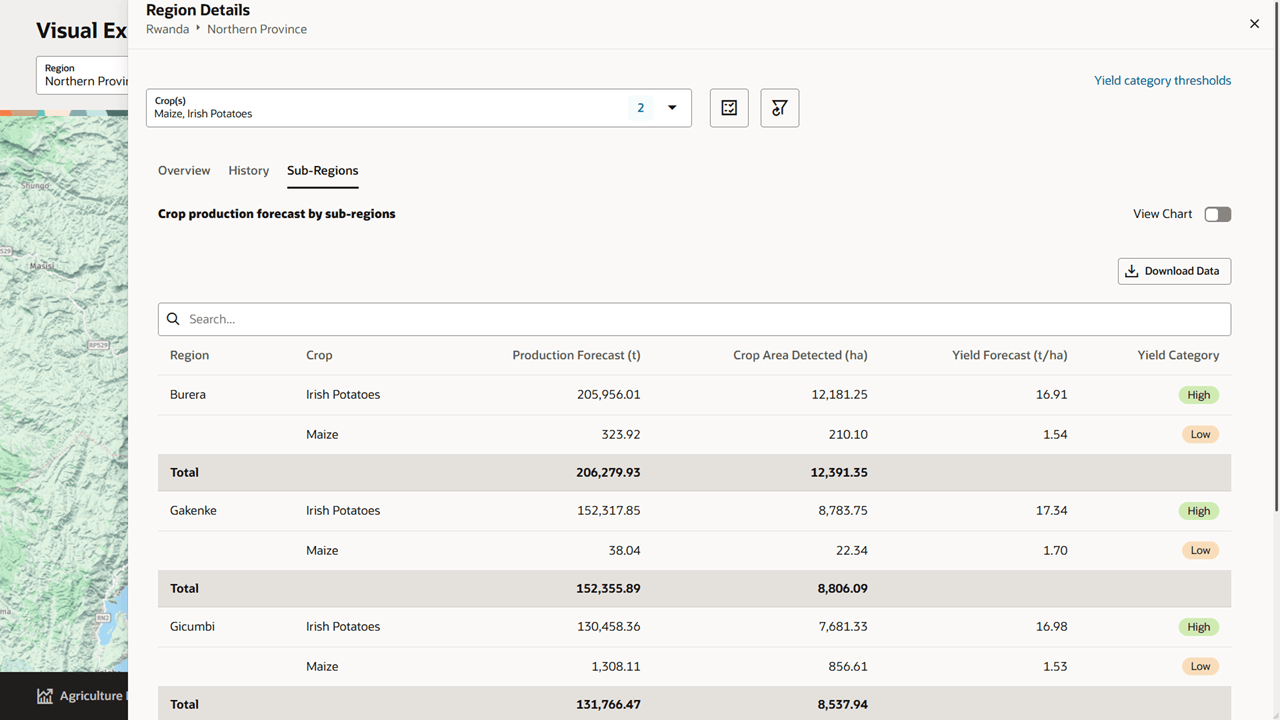
After completing this task, you can identify which sub-regions contribute most to production and which regions require closer attention.
Task: View Sub-Region Data as a Chart
This task explains how to switch from table review to chart review.
These are the steps needed to complete this task:
- Open the Region Details drawer.
- Select the Sub-Regions tab.
- Turn on View Chart.
- Review the ranked bar chart.
- Use the legend to distinguish crops when multiple crops are selected.
- Scroll to the table if you need exact values.
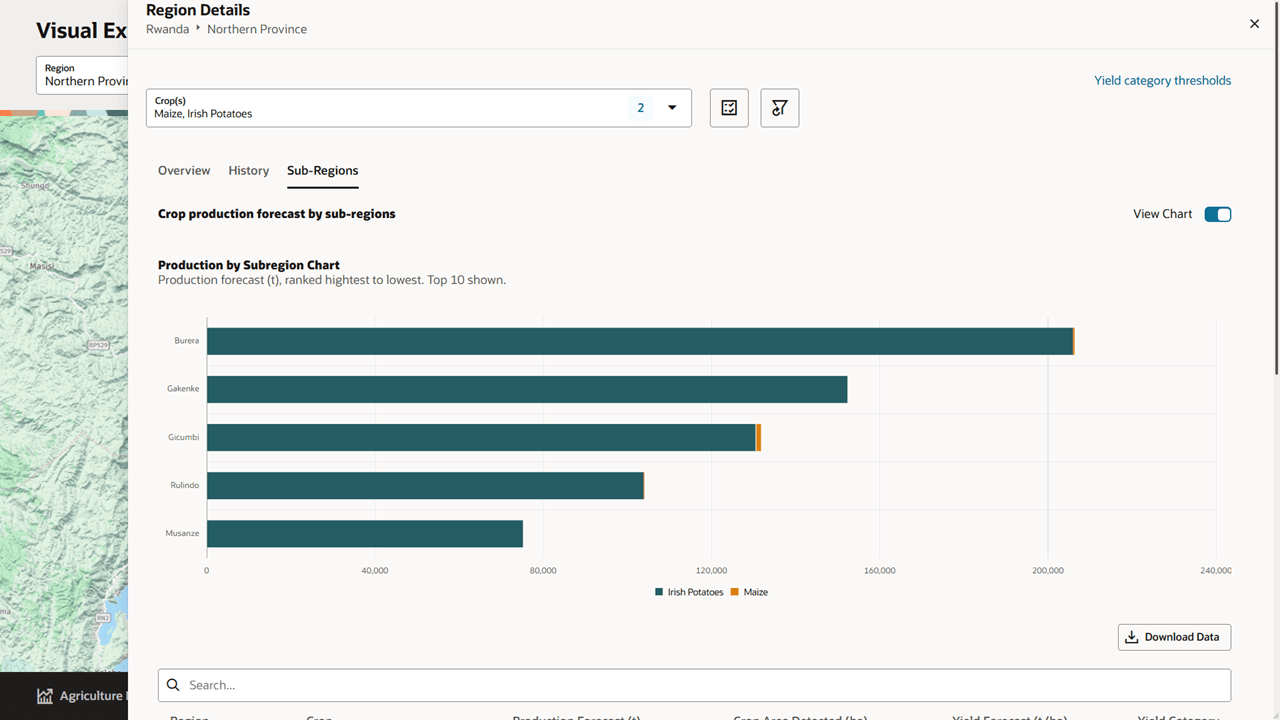
After completing this task, you can compare the highest production forecast regions visually.
Task: Review Yield Category Thresholds
This task explains how to review the threshold definitions used for yield categories.
These are the steps needed to complete this task:
- Open the Region Details drawer.
- Select Yield category thresholds.
- Review the threshold definitions for the selected crop and context.
- Return to the Region Details drawer when finished.
After completing this task, you can interpret Very Low, Low, Moderate, High, and Very High categories using the configured threshold definitions.