Explore the Map
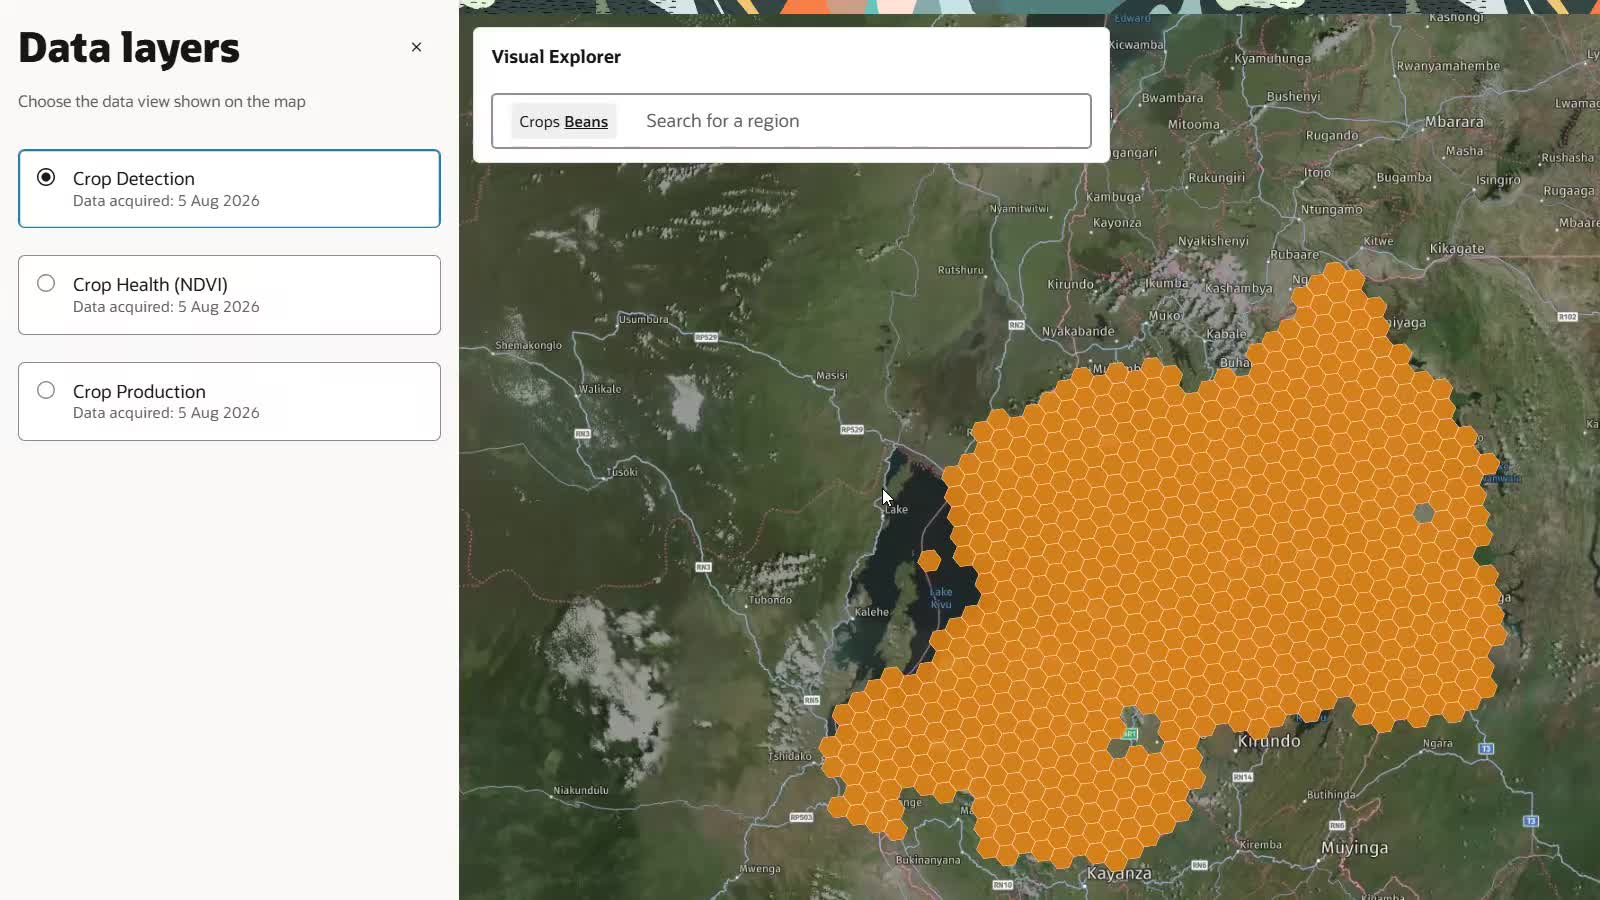
Choose a Layer
Select the data-layers control to choose the information displayed on the map. Depending on your configured data, Visual Explorer provides the following layers:
- Crop Detection shows where the selected crop has been detected in the available satellite-derived data.
- Crop Health (NDVI) shows a vegetation-health indicator for the selected crop and detection date.
- Crop Production shows regional crop-production information and yield-category context.
Each layer shows its available detection date. Select the layer that best supports the question you are investigating.
Select a Crop and Region
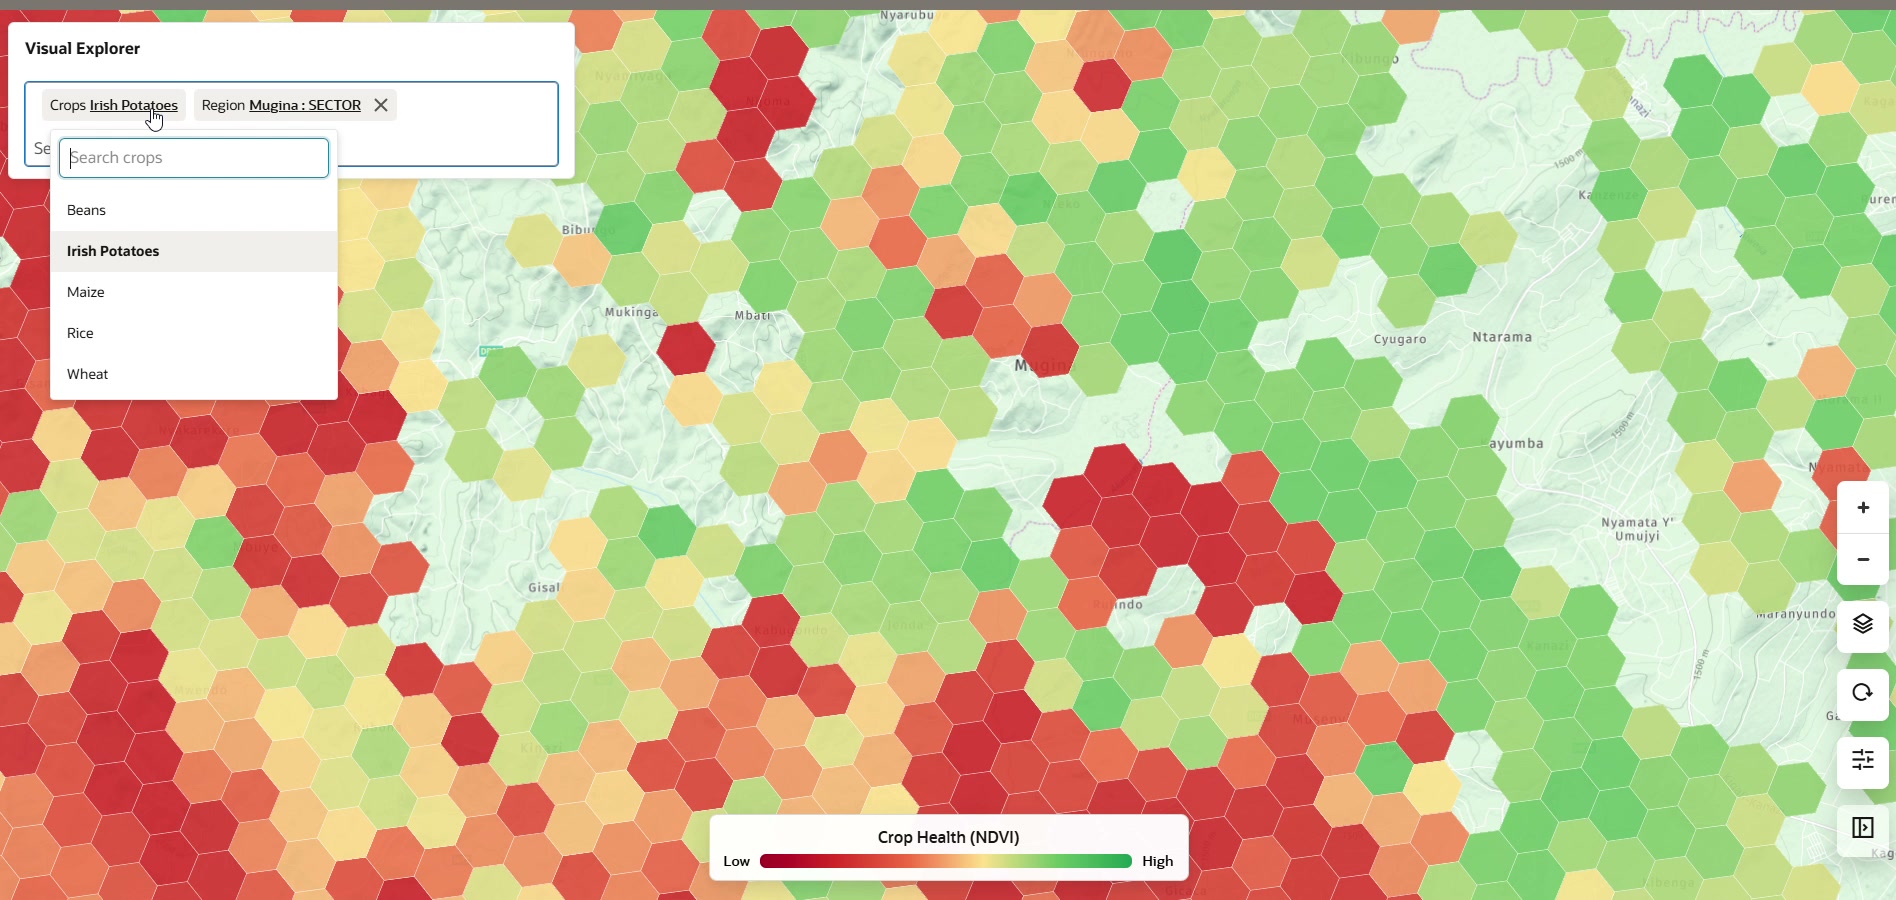
Use the crop control to select an available crop. Use the region search to focus the map on a country, province, district, or another configured administrative region. The available crops and regions are determined by your environment.
Navigate and Inspect Detail
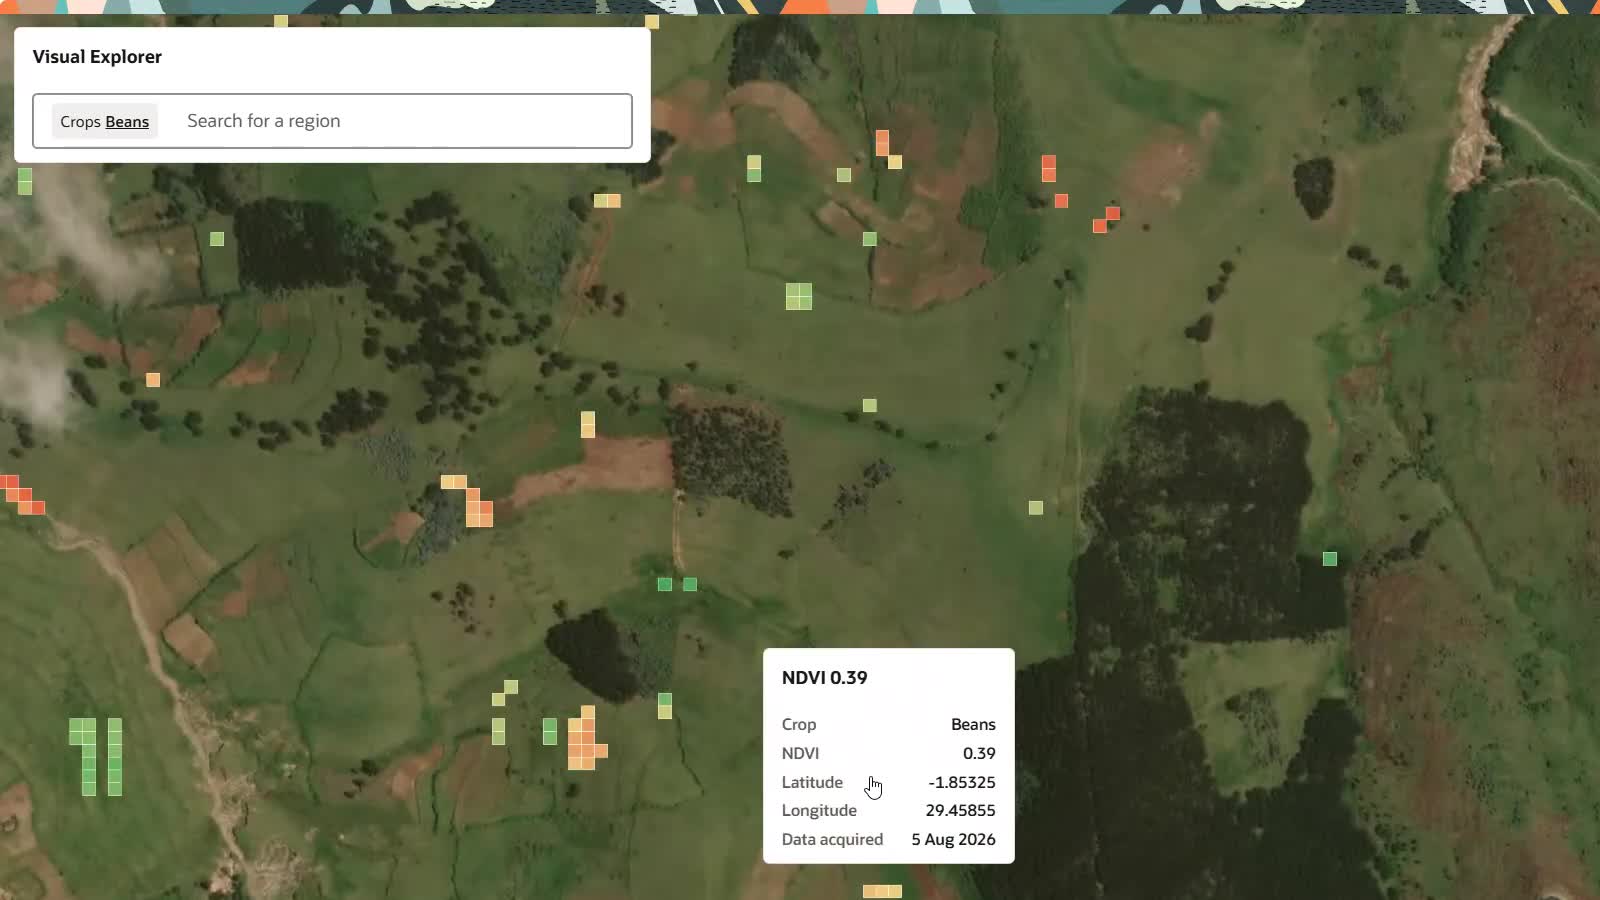
Use the map controls to zoom, pan, recenter, and adjust the visible view. Visual Explorer changes the detail it presents as you zoom. At broader levels, the map summarizes patterns using regional or hexagonal areas. At closer levels, it shows more localized satellite-derived detail.
Select or hover over a map feature to open its tooltip. The tooltip shows the available location, crop, detection date, and values for the selected layer. For Crop Health, this includes the NDVI value and related context.
Interpret Crop Production Colors
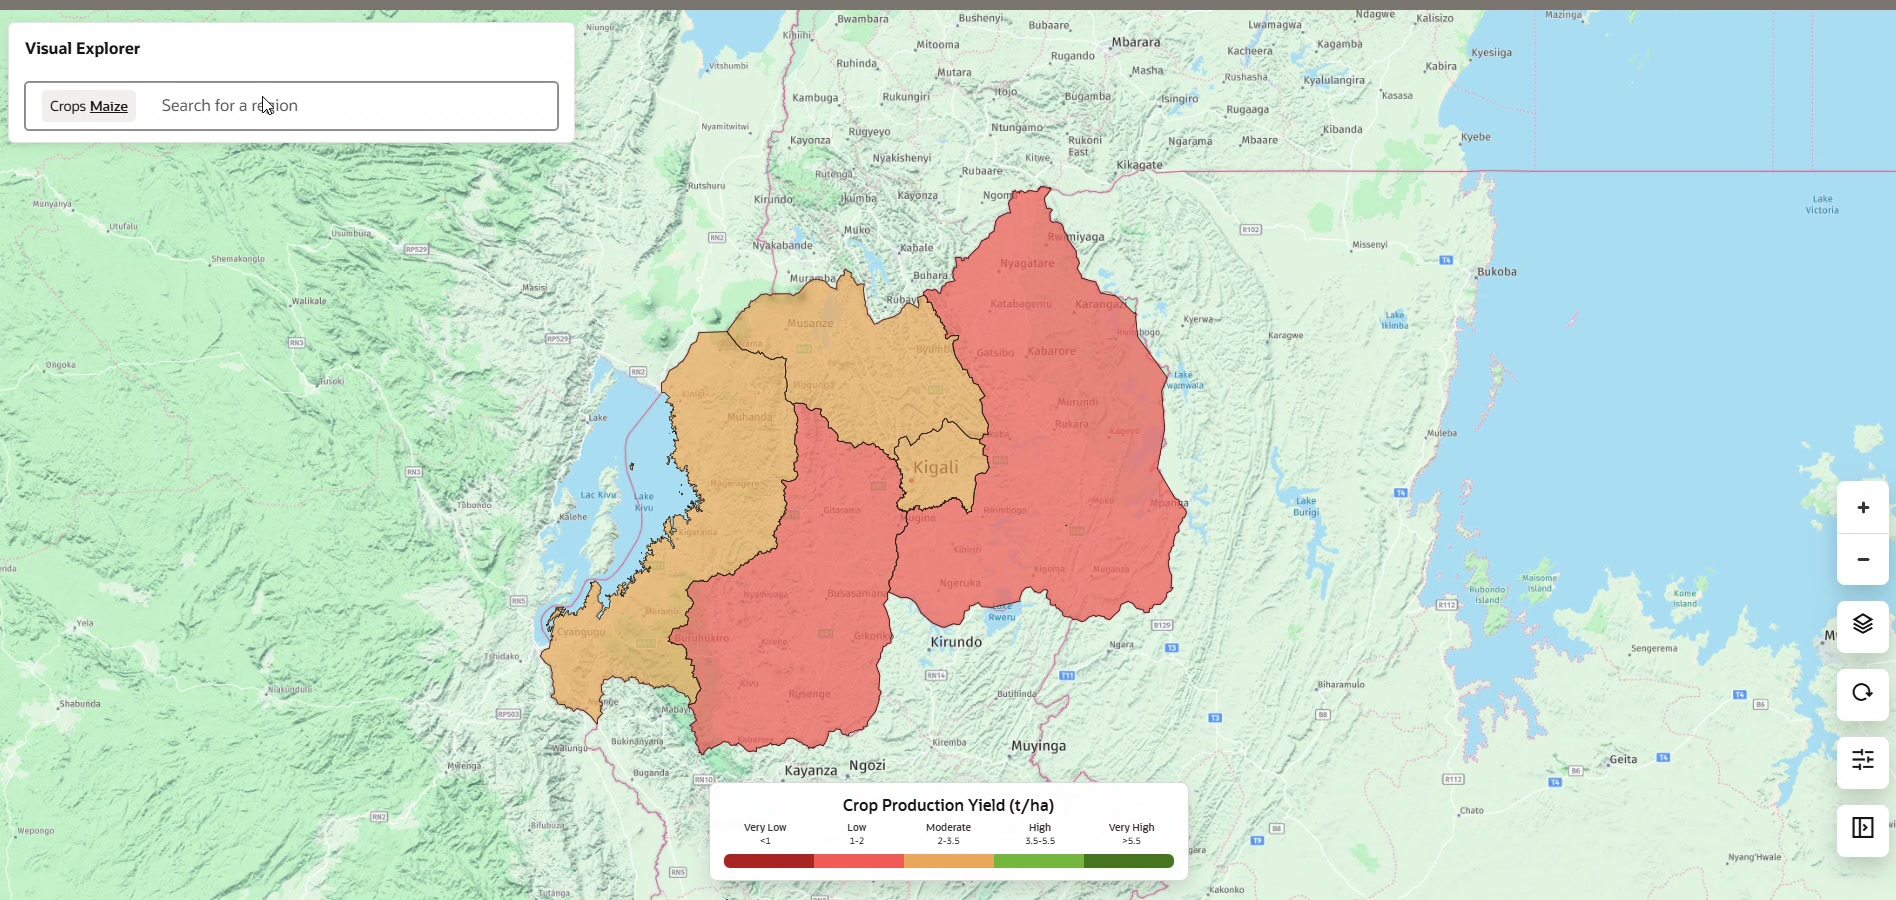
On the Crop Production layer, map colors help distinguish yield categories for the selected crop. The legend identifies the category associated with each color. Yield categories are configured for each crop and interpret forecast yield in the local context; they should not be compared as a universal scale across crops.
Select a region to review the values behind its displayed category.
Next: choose a workflow in Common Tasks.