Interpret Layers and Scale
Each Visual Explorer layer answers a different question and is shown only at the geographic detail where its information is meaningful. Select the layer that matches the question you are trying to answer, then confirm the crop, region, and date context before interpreting the map.
Choose the Right Layer
| Layer | Question it helps you explore | How to interpret it |
|---|---|---|
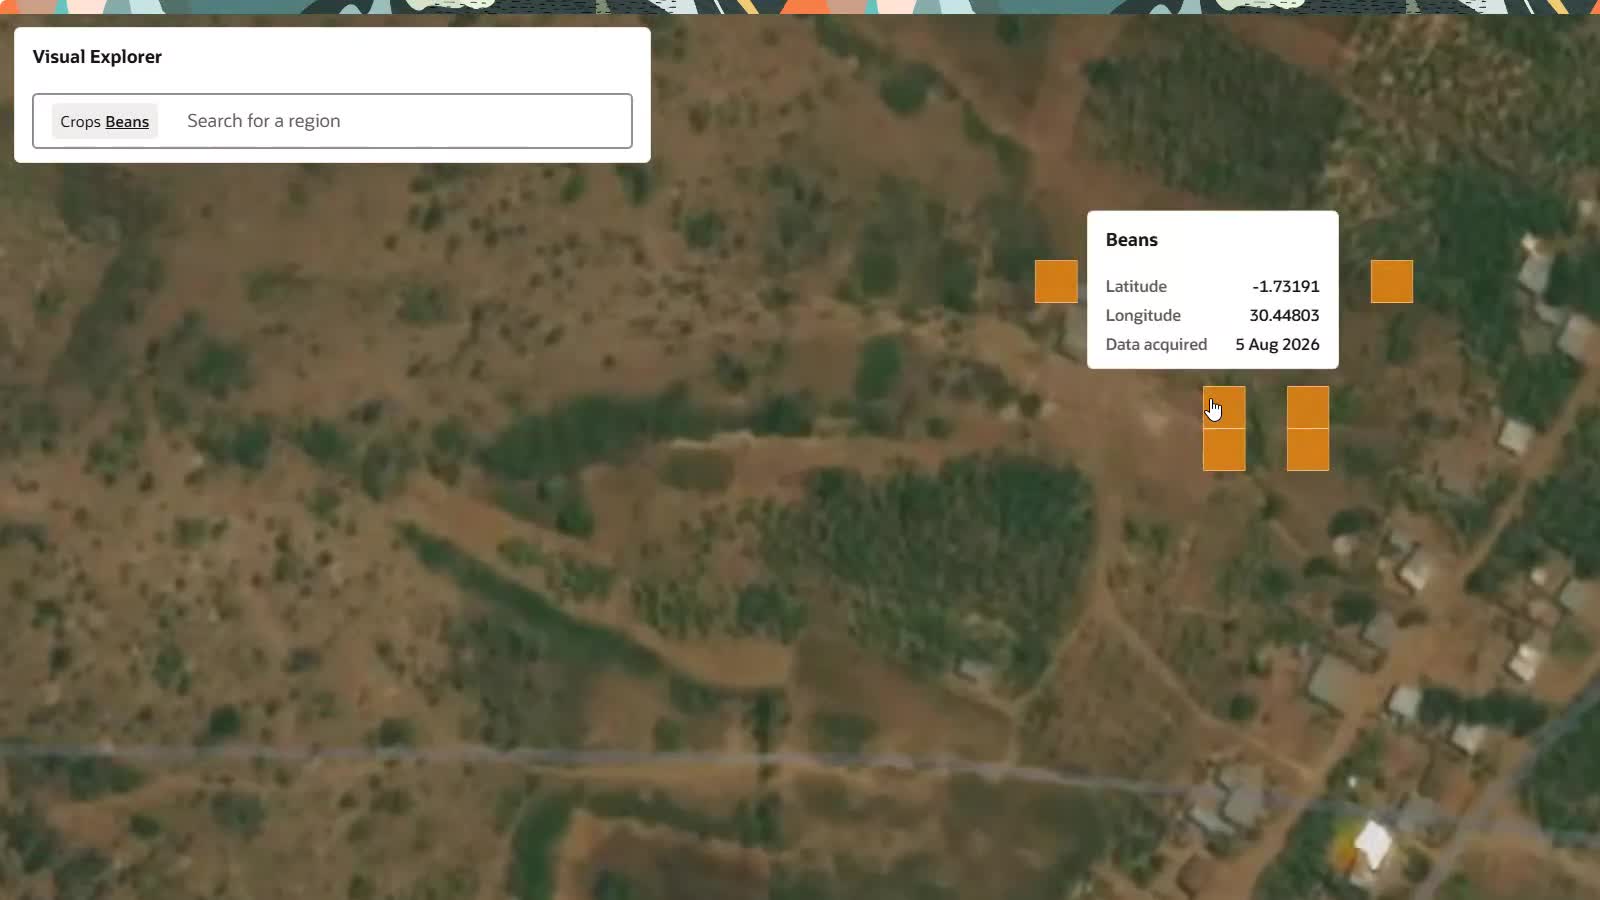
| Crop Detection | Where is the selected crop represented in the available data? | Explore detected areas at detailed map levels. A location without a selectable detected area is not, by itself, evidence that the crop is absent on the ground. |
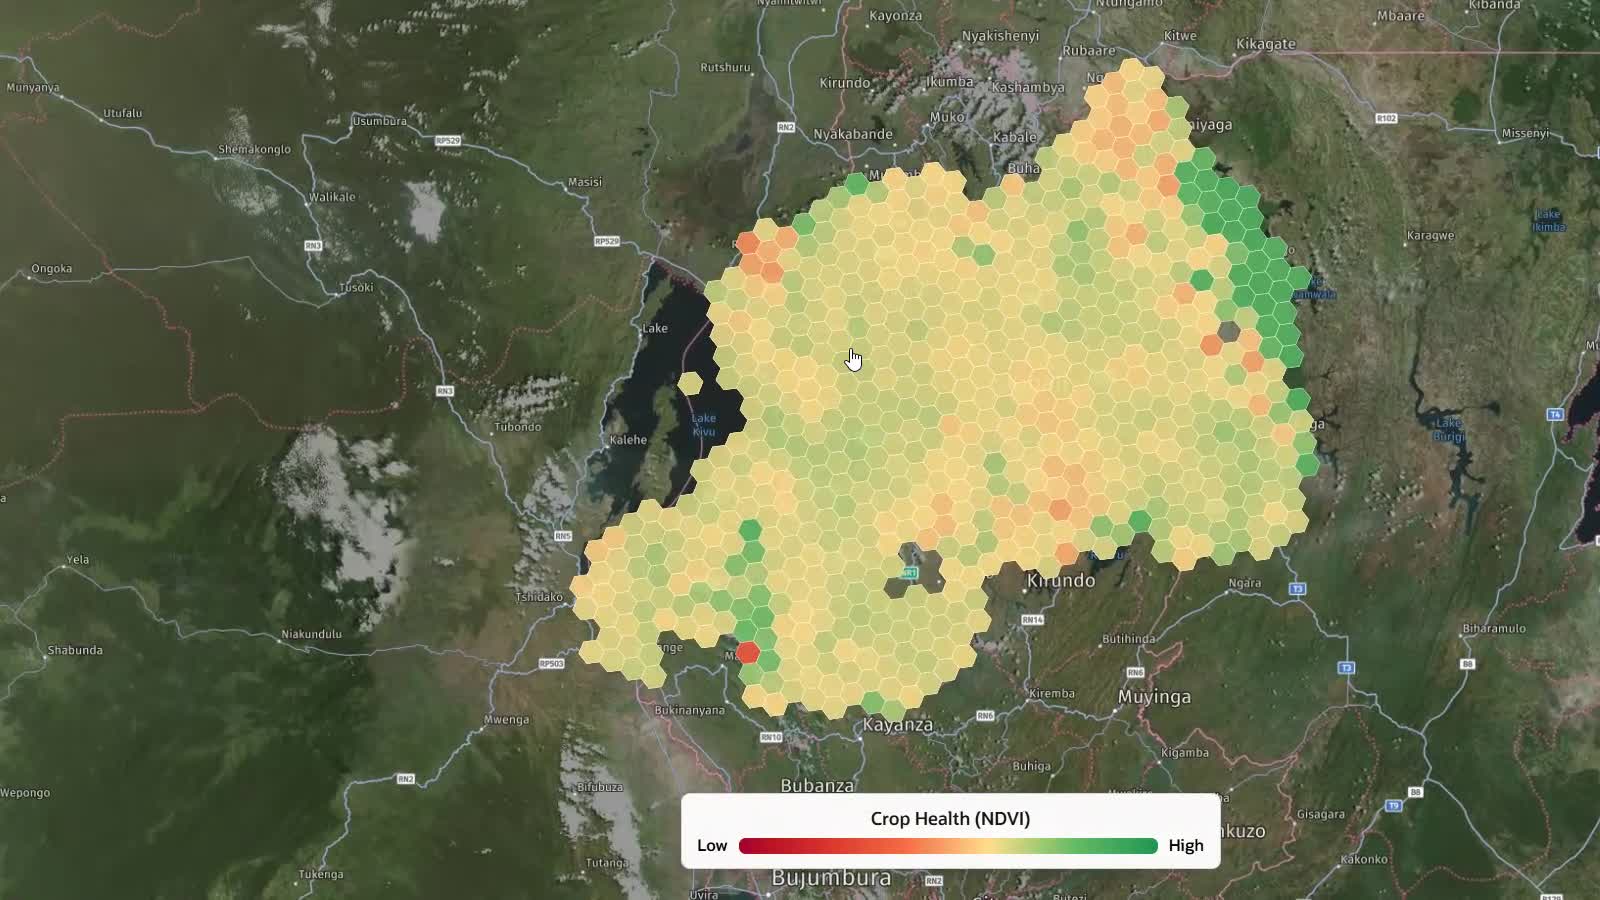
| Crop Health (NDVI) | Where does the selected crop show different vegetation-health patterns? | Compare areas using the same selected crop and date. Treat a value or classification as a signal for investigation, not a diagnosis of cause. |
| Crop Production | How does available crop-production information compare across administrative regions? | Use yield categories, forecasts, detected area, and sub-region views to compare regions in their reporting context. |
Read the Map at the Appropriate Detail
Crop Production is presented for administrative regions because its values are intended for regional comparison and reporting. Crop Detection and Crop Health are presented at more detailed map levels in the areas where the relevant information is available.
This distinction prevents the map from implying that all layers have the same level of precision or are available everywhere. If the selected layer no longer appears as you change map detail, navigate to a supported level or select a layer that is appropriate for your question.
At a broader level, Crop Health can help reveal a pattern across an area.
At a detailed level, Crop Detection can show the detected locations available for closer inspection.
Confirm Context Before Drawing a Conclusion
Before interpreting a map pattern or sharing it with others, confirm:
- the selected crop;
- the active layer;
- the selected region or map location;
- the displayed detection date; and
- the geographic detail represented by the layer.
For Crop Production, also confirm whether you are viewing a current forecast or historical production context. Historical values can have a different source, timing, and definition from a current forecast.
Treat Availability as Context
Available data can vary by crop, area, layer, and date. A missing layer, empty panel, or unavailable result can indicate that data is not available for the selected context. Review your selection first; contact your administrator if you expect data to be available and it is not displayed.