Activity Dashboard
The Activity Dashboard provides information about processes (known as tasks) that have been processed by the system. When a task is running, it creates a transaction, which is added to the Activity Dashboard data table. From the Activity Dashboard, you may view the task that created the transaction, the run that processed the task, the status of the transaction, and the transaction status.
The Activity Dashboard is commonly used as an initial query to see overview information and the status of processes that have run or are running. From this page, you can see the current status and navigate to further pages to see more information about the associated transaction, task, and run.
Fields and Buttons
The top section of the Activity Dashboard page allows you to search for tasks matching criteria in the fields:
- Number of Previous Runs: Sets the number of historical runs to display and include when calculating an average time for the run.
- Delay Margin (%): Sets a tolerance to designate an on-time run (labeled in green). The average time is calculated against the historical runs that the Number of Previous Runs specifies. The delay margin percentage is then added to the average in order to create the margin.
- Refresh Rate: The frequency (in seconds) to automatically update the results.
- Status: Search for transactions with a specific status.
- Get Data button: Initiate a search for data matching criteria set in the fields.
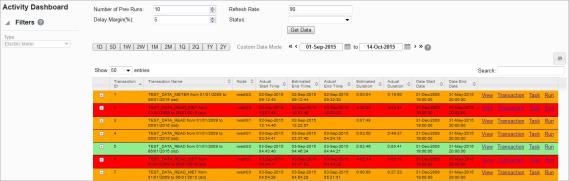
Search Results
Highlighted and color-coded rows in the search results show the status, or timeliness of the processing.
- Green: On-time; within the average time plus delay margin.
- Yellow: Slow; later than the average time plus delay margin.
- Red: Failed; this is commonly due to an error in the run.
Note: Row colors do not indicate completion. Completion is indicated by an entry within the Actual End Time column. Once complete, the Actual End Time column displays the date and time that the activity completed, so no entry in the Actual End Time column indicates that the activity is currently running.
Data Table
Data table column names and functions are as follows:
- Transaction ID: The transaction system-assigned, unique identifier.
- Transaction Name: The system-assigned name that combines the task lookup name with key information from the task. The transaction name is formed by concatenating the task lookup with the task start date, task end date, and the task run mode. For example, CORE_FACT_AUDIT from 08/19/2015 to 08/19/2015 (STD).
- Node: Indicates the server node that processed the transaction.
- Actual Start Time: The date and time when the transaction ran.
- Estimated End Time: The date and time when the transaction was expected to end.
- Actual End Time: The date and time when the transaction actually ended.
- Estimated Duration: The amount of time that the transaction was expected to take
- Actual Duration: The amount of time that the transaction actually took.
- Data Start Date: The earliest date and time of the data that was selected for the transaction.
- Data End Date: The latest date and time of the data that was selected for the transaction.
- Links:
- View: Opens the View Activity Dashboard dialog box, which displays the same data as provided in the data table row.
- Transaction: Navigates to the Manage Transactions page and displays the current context to provide further information.
- Task: Navigates to the Manage Tasks page and displays the current context to provide further information.
- Run: Navigates to the Manage Runs page and displays the current context to provide
further information.
Note: If the task was processed manually outside of a run, no run data will exist.