Data Dashboard
The Data Dashboard gives you detailed information about an entity. Use the Data Dashboard to perform a variety of entity-related tasks, such as creating and managing work orders, viewing several related data panels, creating notes, and analyzing other details.
Data Info Panel
The Data Info Panel appears on the right side of the page and includes three tabs, Info, Algorithms and Notes.
- Info: The Info tab gives you more information about an entity such as the address, account number, or any parent, sibling, or child points.
- Algorithm: The algorithm tab shows algorithms used for a selected point date range in the filter results pane. The data is informational only and can be used as a navigation tool.
- Notes: You can use the Note tab to make notes about the entity. For example, you can use it to indicate that a meter has malfunctioned and needs repair. There is a 2500 character limit for each note. You can view all notes created to the entity, but you can only edit and delete notes you create.
Work Orders
Work orders are used to communicate and resolve issues with an entity or group of entities.
Work Order User Groups
The following describes work order user groups:
- WorkOrder: Users in this group can submit or cancel a work order, mute or unmute meters, and add or remove feedback to and from a meter.
- WorkOrder Feedback: Users in this group can view work order details and a meter's mute status and add or remove feedback to and from a meter.
- WorkOrder View Only: Users in this group can view work order details, mute status, and feedback.
Details
Access additional details by clicking the Details button next to the date controls. This dialog box contains multiple tabs that display important information about an entity. These tabs include:
- Summary tab: Displays the same information
that is displayed on the Explorer page’s Selected Asset pane. If the filter type is meter related, a dynamic list of links which allows the
user to navigate to additional applications is displayed.
Note: Links vary by client configuration and only appear when the filter type is meter-related.
- Events: Lists each event that used the associated data point.
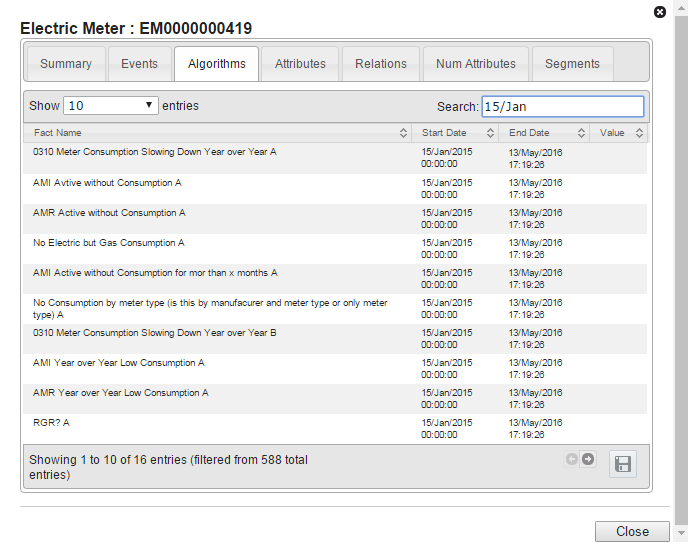
- Algorithms: Lists each time an algorithms returned the associated asset.
- Attributes: Lists additional information associated to this asset.
- Relations: Displays associations between points such as a line transformer and its associated meters. If you select a line transformer without any associated meters, you will see an error message stating that there are no associated meters.
- Num Attributes: Lists numeric but not calculated data.
- Segments: Groups relational facts such as, customer type (commercial, residential, and industrial).
Except for Summary, the tabs in this dialog box share similar features and data table columns.