Meter Subject Areas
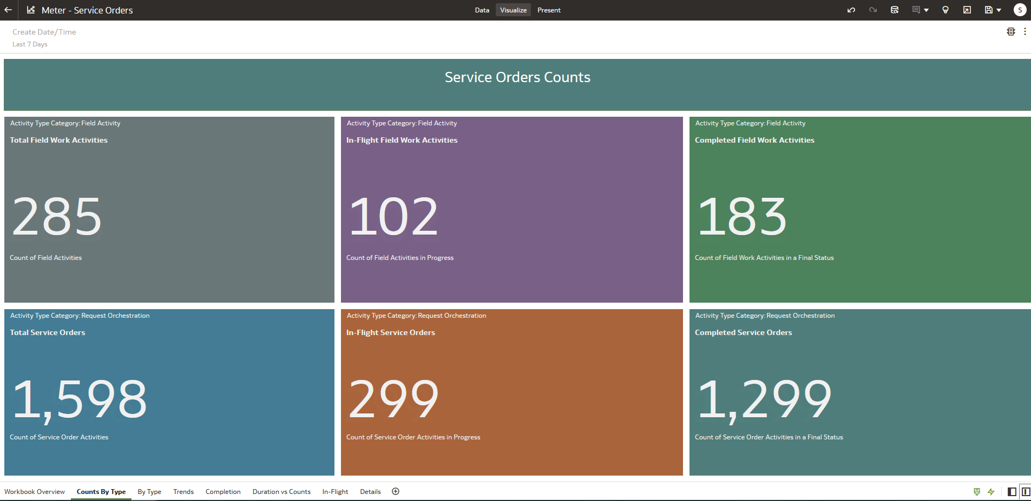
The meter subject areas are based on data objects available in the Oracle Utilities Meter Solution Cloud Service, such as device events and device commands. The image below is an example of how data could look in the Service Orders subject area.
On this page:
Meter - Activities
This subject area can be used to answer a variety of business questions related to device commands, service orders, and field work activities.
Device Commands: This section of Meter - Activities can be used to visualize Smart Grid Gateway commands issued. These analytics will examine smart meter (AMI) command counts and duration. Answer questions like these:
- Is there a particular time of day when the AMI network is over-saturated? Are we calling a lot of commands at this time? Could we move the time when these commands are called?
- How many AMI commands are being called?
- How many disconnects are being called? Are we disconnecting people during very cold or hot weather periods?
You can also use maps to review and analyze device command activities data (such as over-saturated AMI networks, total disconnections per month, and more) in high-level summaries and detailed street views. Answer questions like these:
- Are commands failing in a particular area?
- Where are the customers with pending commands?
Service Orders: This section of Meter - Activities can be used to visualize Service Order Management activities. These analytics will examine service orders issued, trends, duration, and problem orders. Each of these analytics will include counts, duration, and tools to create additional calculations. Answer questions like these:
- How many service orders are we doing?
- How long does it take to enable service for a customer?
- How many open service orders do we have?
You can also use maps to review and analyze service orders data in high-level summaries and detailed street views. Answer questions like these:
- Where are the customers with open service orders?
- Where are the water leak service investigative orders?
Field Work Activities: This section of Meter - Activities can be used to visualize field work tasks. These analytics will examine counts and duration, and included tools to create additional calculations. Answer questions like these:
- How much field work are we requesting?
- How many open field work orders do we have?
- How long does field work take by field task type?
You can also use maps to review and analyze field work data in high-level summaries and detailed street views. Answer questions such as: Where are the customers with outstanding field work?
Meter - Timeliness, Count, and Quality
The following subject areas enable an analysis of your AMI system's quality and timeliness.
- Meter – Aggregated Measurement Count
- Meter – Aggregated Measurement Quantity
- Meter – Aggregated Timeliness Count
- Meter – Aggregated Timeliness Quantity
Meter - Aggregated Measurement Count
This subject area can be used to review and analyze the quality of interval reads.
Answer questions like these:
- Which AMI system has the most estimated measurements?
- Which meter type has the most missing measurements?
Meter - Aggregated Measurement Quantity
This subject area can be used to review and analyze the quantity of interval reads based on quality. For example, the quantity of estimated or regular interval data.
Answer questions like these:
- What is the quantity of estimated measurements?
- What is the quantity of regular measurements?
Meter - Aggregated Timeliness Count
This subject area can be used to review and analyze AMI timeliness delivery of interval reads.
Answer questions like these:
- Which AMI system has the most late measurements?
- Which meter type has the most on-time measurements?
Meter - Aggregated Timeliness Quantity
This subject area can be used to review and analyze the quantity of interval reads based on timeliness. For example, the quantity on-time or the quantity late.
Answer questions like these:
- What is the quantity of late measurements?
- What is the quantity of on-time measurements quantities?
Meter - Customer Classification
This subject area can be used to review and analyze usage consumption by customer classification. This helps you analyze water, gas, or electricity usage consumption by various dimensions like profile class and usage subscription class and type. This data is useful for regulatory reporting, revenue analysis, rate design, and planning.
Prerequisite: Configure Consumption Analytics
Answer questions like these:
- What is total consumption by region and customer type?
- What is the total consumption for residential customers?
- How does usage break down by usage subscription class (electricity, gas, or water) and usage subscription type (commercial, industrial, or residential)?
Meter - Device Event
This subject area can be used to count, visualize, and analyze device events coming from smart meters. You can also look at meter read remarks from legacy meter systems.
Answer questions like these:
- How many device events am I getting?
- How are the device events trending?
- Which meters have critical events (low battery, outage, high temperature) that must be evaluated quickly?
- Which service points have the most theft events?
- Which service points have the most diagnostics events?
You can also display device events on a map to review and analyze event data such as power outages, diagnostics, thefts, leaks, and low batteries in high-level views or detailed street views. Answer questions like these:
- Which areas have leak events?
- Where are most theft events occurring?
- Which geographical areas are having the most device communication failures?
- Which geographical areas are having the most device diagnostic failures?
Meter - Distribution Nodes
This subject area can be used to review and analyze usage consumption by distribution node or region. It helps you analyze usage by various nodes like substation, feeder, and transformers (facilities). This data is useful for regulatory reporting, distribution analysis, planning, and grid analysis.
Prerequisite: Configure Consumption Analytics
Answer questions like these:
- What is the usage consumption by distribution node (such as substation, feeder, and transformer or facility)?
- Which are the top N loaded transformers for a particular region?
- What is the usage consumption by region (such as city or postal code)?
Meter - Install Event and Usage Subscription Service Point
These subject areas together provide a multidimensional analysis of an organization’s Meter Master Data counts within the Meter Solution Cloud Service, including devices, service points, and usage subscriptions. This data can reduce project times and improve efficiency by providing standard views to: verify data counts post conversion, track device installations during AMI rollouts, identify connected or disconnected devices and service points, and review and analyze active service points and any associated devices geographically.
Answer questions like these:
- How do I verify master data counts post conversion?
- How many devices or service points were installed or removed within the last seven days?
- How many devices were installed during an AMI rollout?
- How many connected or disconnected devices are there, and where are they located?
- How many connected or disconnected service points are, and where are they located?
Meter - Losses
The following subject areas enable a multidimensional analysis of your organization's meter losses. This helps you to identify possible losses, identify meters assigned to the wrong district meter or transformer, and identify where losses are happening (such as water leaks and electric revenue protection issues). It also helps work crews by providing the possible loss amounts and loss areas.
- Meter – Facilities
- Meter – Facility Usage
- Meter – Downstream Usage
- Meter – Downstream Service Points
Meter – Facilities
This subject area can be used to review and analyze individual service points mapped with facility.
Prerequisite: Configure Consumption Analytics
Answer questions like these:
-
Is a facility (transformer) installed in an optimal geographical location with respect to connected downstream service points, or is there another facility that is better located?
- Are there facilities with incorrect geo coordinates?
Meter – Facility Usage
This subject area can be used to review and analyze the relationship of usage between a facility and downstream service points.
Prerequisite: Configure Consumption Analytics
Answer questions like these:
- What is the usage by facility?
- (When combined with Meter – Downstream Usage) What is the difference between the usage of the facility and the sum of the usage of the connected service points?
Meter – Downstream Usage
This subject area can be used to review and analyze the total downstream usage along with the percentage downstream usage by date.
Prerequisite: Configure Consumption Analytics
Answer questions like these:
- What is the downstream usage by day and location?
- What is the average downstream usage?
- (When combined with Meter – Facility Usage) What is the difference between the usage of the facility and the sum of the usage of the connected service points?
Meter – Downstream Service Points
This subject area can be used to review and analyze a downstream service point’s physical location in a map, along with other details such as geographic latitude, longitude, address, and so on.
Prerequisite: Configure Consumption Analytics
Answer questions like these:
- What is the physical location (such as address and postal code) of a service point on a map?
- How many downstream service points are connected to a facility in a particular area or location?
Meter - Usage Exceptions
This subject area can be used to review and analyze usage exception data.
Answer questions like these:
- How many billing determinant exceptions per customer type are there?
- Which usage exceptions are holding up billing?
Meter - VEE Exceptions
This subject area can be used to review and analyze validation, edit, and estimation (VEE) data.
Answer questions like these:
- Which VEE rules generate the most exceptions?
- Which service points / accounts have the most VEE errors?