Get Started
Oracle Utilities Analytics Visualization is a suite of analytics applications that provides real-time access to data in the Oracle Utilities Customer Cloud Service (CCS), Oracle Utilities Meter Solution Cloud Service (MSCS), and Oracle Utilities Work and Asset Cloud Service (WACS). Oracle Utilities Analytics Visualization includes rich pre-built analytical subject areas, measures, key performance indicators, visualizations, and workbooks that allow you to derive strategic insights from your data through exploration, discovery, visualization, and analysis.
On this page:
Audience and Scope
This guide is intended for consumers and creators of visualizations and workbooks using Oracle Utilities Analytics Visualization. Consumers work with their favorite visualizations and workbooks delivered with the application or built by your organization. Creators understand the business needs of the consumers and create visualizations and workbooks that answers their business questions.
This guide also covers configuration tasks that must be performed by an administrator or implementer. See Administer the Service for more information.
Subject Areas
One of the key benefits of Oracle Utilities Analytics Visualization is that it comes with predefined subject areas that are specific to the utilities industry. Subject areas are the building blocks of your visualizations and workbooks. A workbook is built by choosing an appropriate subject area that has information that answers the business question you’re analyzing.
In more technical terms, a subject area is a data model that presents business data for analysis in a manner that reflects the structure of the business. Data models enable analysts to structure queries in the same intuitive fashion as they ask business questions. The data models of Oracle Utilities Analytics Visualization are simple and mask the complexity of the underlying data structure. For examples of questions that the Analytics Visualization subject areas can help you answer, see Subject Areas Out of the Box.
A subject area contains attributes, measures, and dimensions. See Terminology below for more information about these components.
Oracle Data Visualization
Analytics Visualization leverages Oracle Data Visualization, which is a component of Oracle Analytics Server. Oracle Data Visualization enables you to easily create visualizations and workbooks that reveal trends in your company’s data and help you answer questions and discover important insights about your business.
Creating visualizations and workbooks is easy in Data Visualization, because the application is designed so that your data analysis work is flexible and exploratory. Additionally, exploring data in Data Visualization is different than using pre-built analytics and dashboards, since Data Visualization allows you to experiment with your data by adding or removing columns, creating filters, or applying different visualizations to your data. You can understand your data from different perspectives and fully explore your data to find correlations, discover patterns, and see trends.
For more information, see Explore, Visualize, and Analyze Data.
Terminology
There are several terms in the Analytics Visualization documentation that might be unfamiliar to you as you learn about the application. Review the information below to gain a better understanding of these terms, how they relate to the product interface, and the concepts behind them.
Measures, Attributes, and Dimensions
There are three common components within Analytics Visualization subject areas: measures, attributes, and dimensions.
Measures and attributes are data elements that you use to build your visualizations. You can think of a measure as a "numerator" with a quantitative number that can be divided or filtered by an attribute. Conversely, an attribute is a "denominator" that can divide or filter a measure. Dimensions are simply categories or folders that contain attributes.
Example 1: Subject Area, Dimension Folder, and Attributes
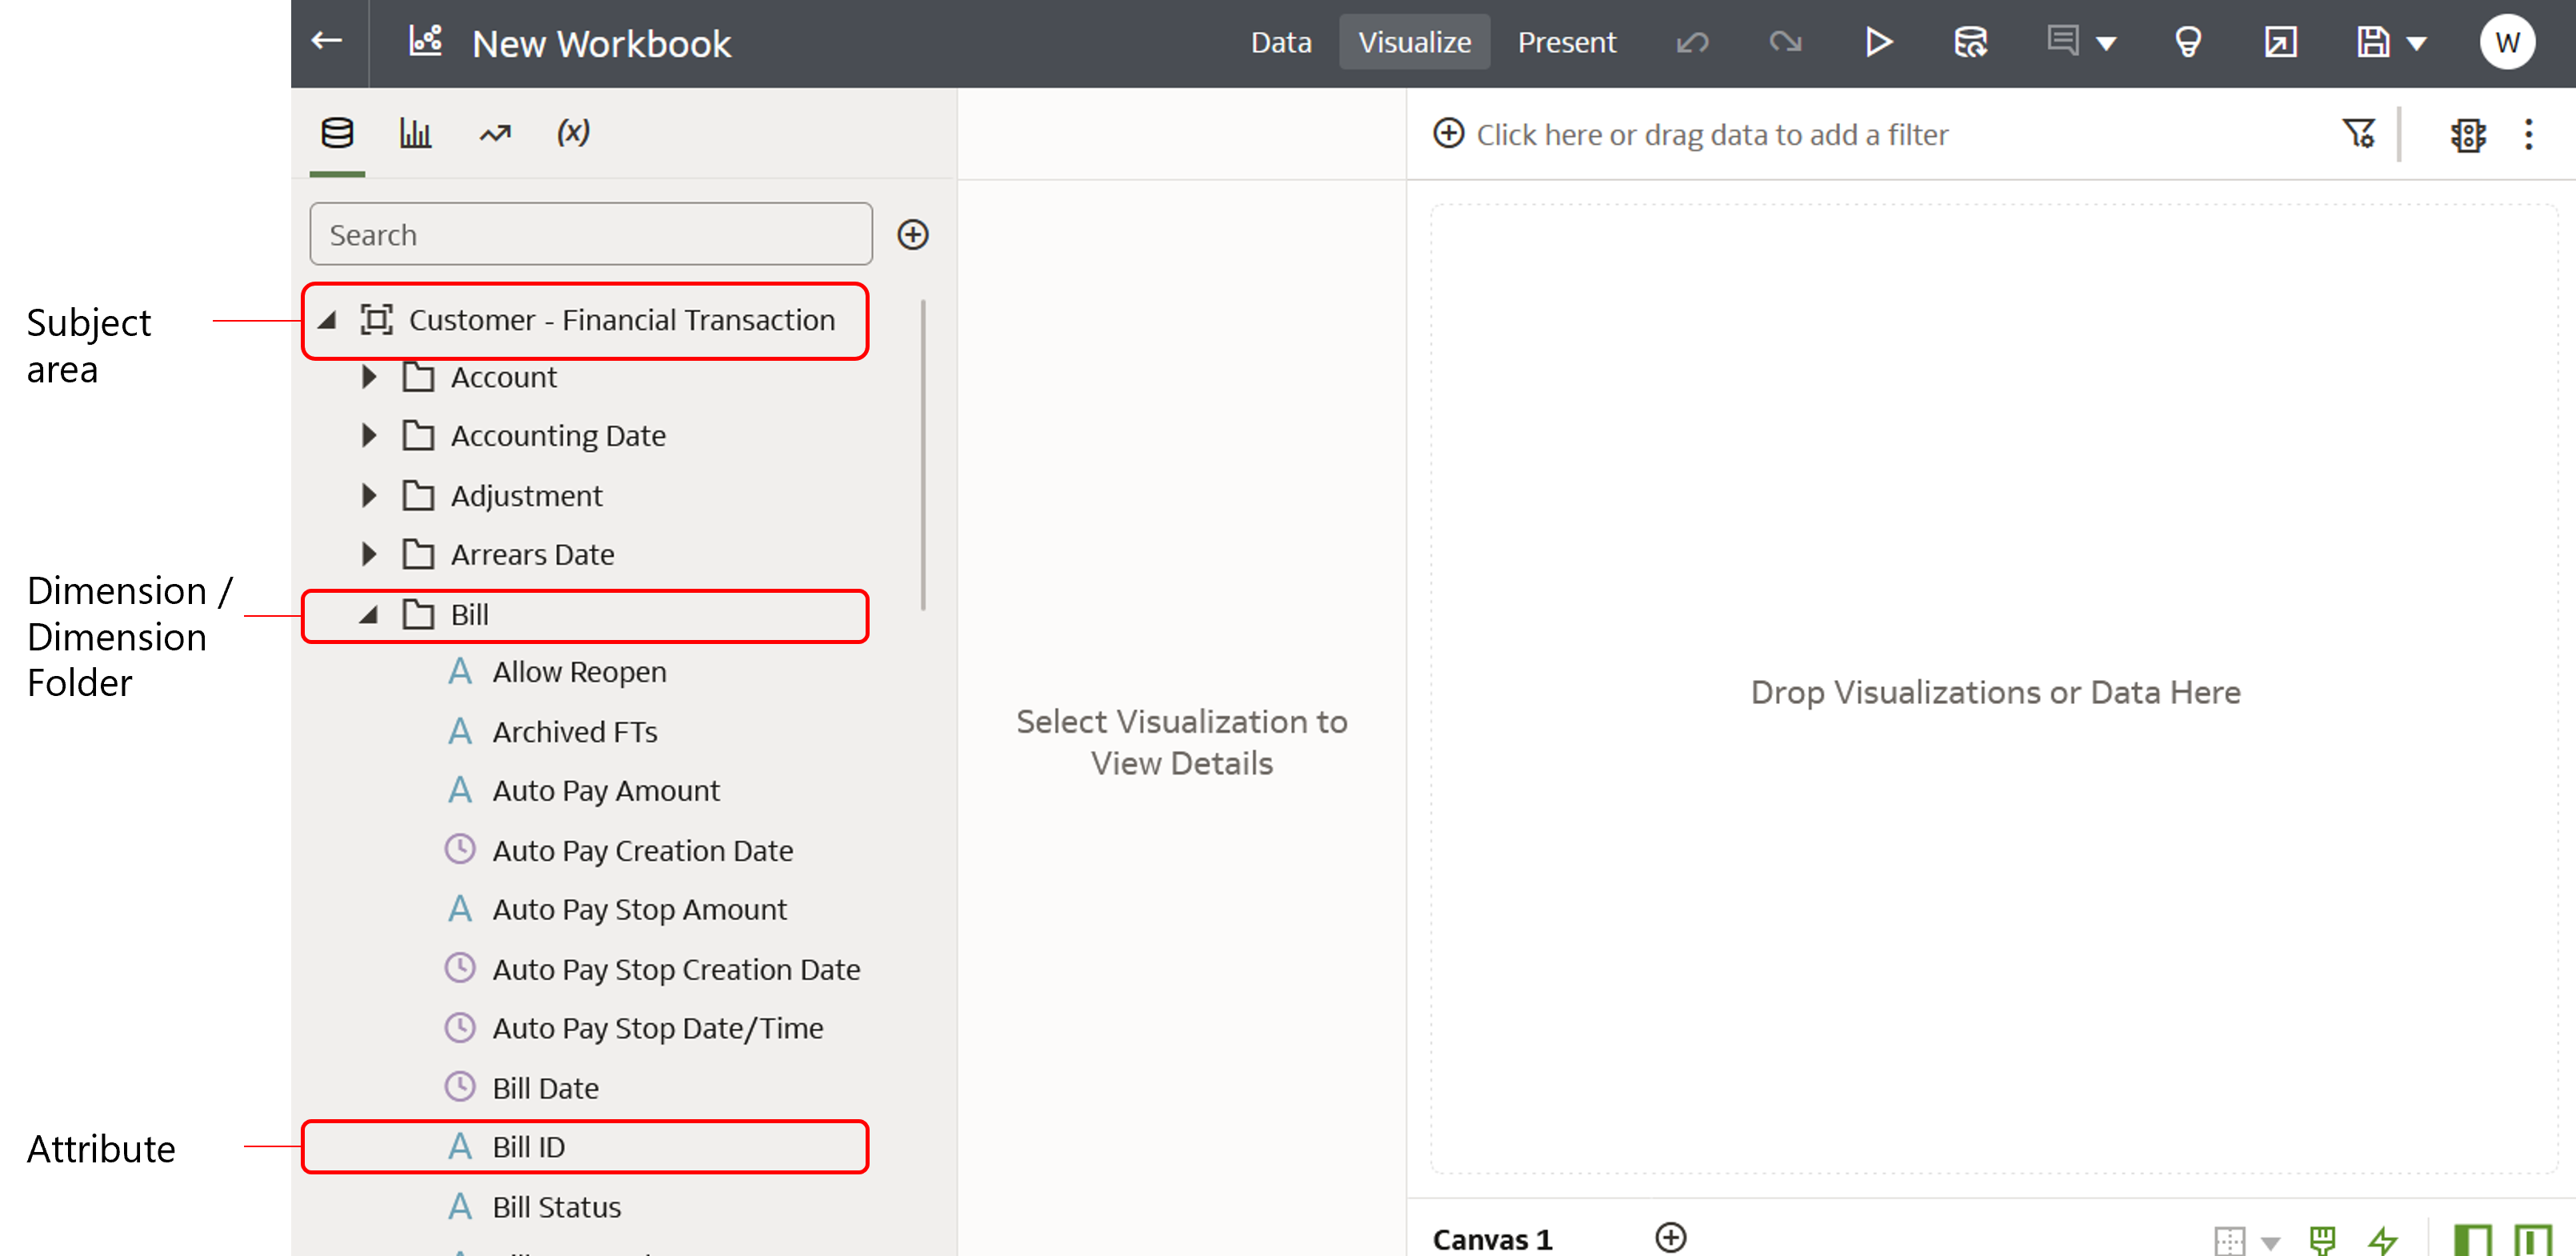
Subject areas are shown at the top of the data panel in a workbook. Dimension folders are preceded by a folder icon, and attributes are preceded by an icon of the letter A.
Example 2: Fact Folder and Measures
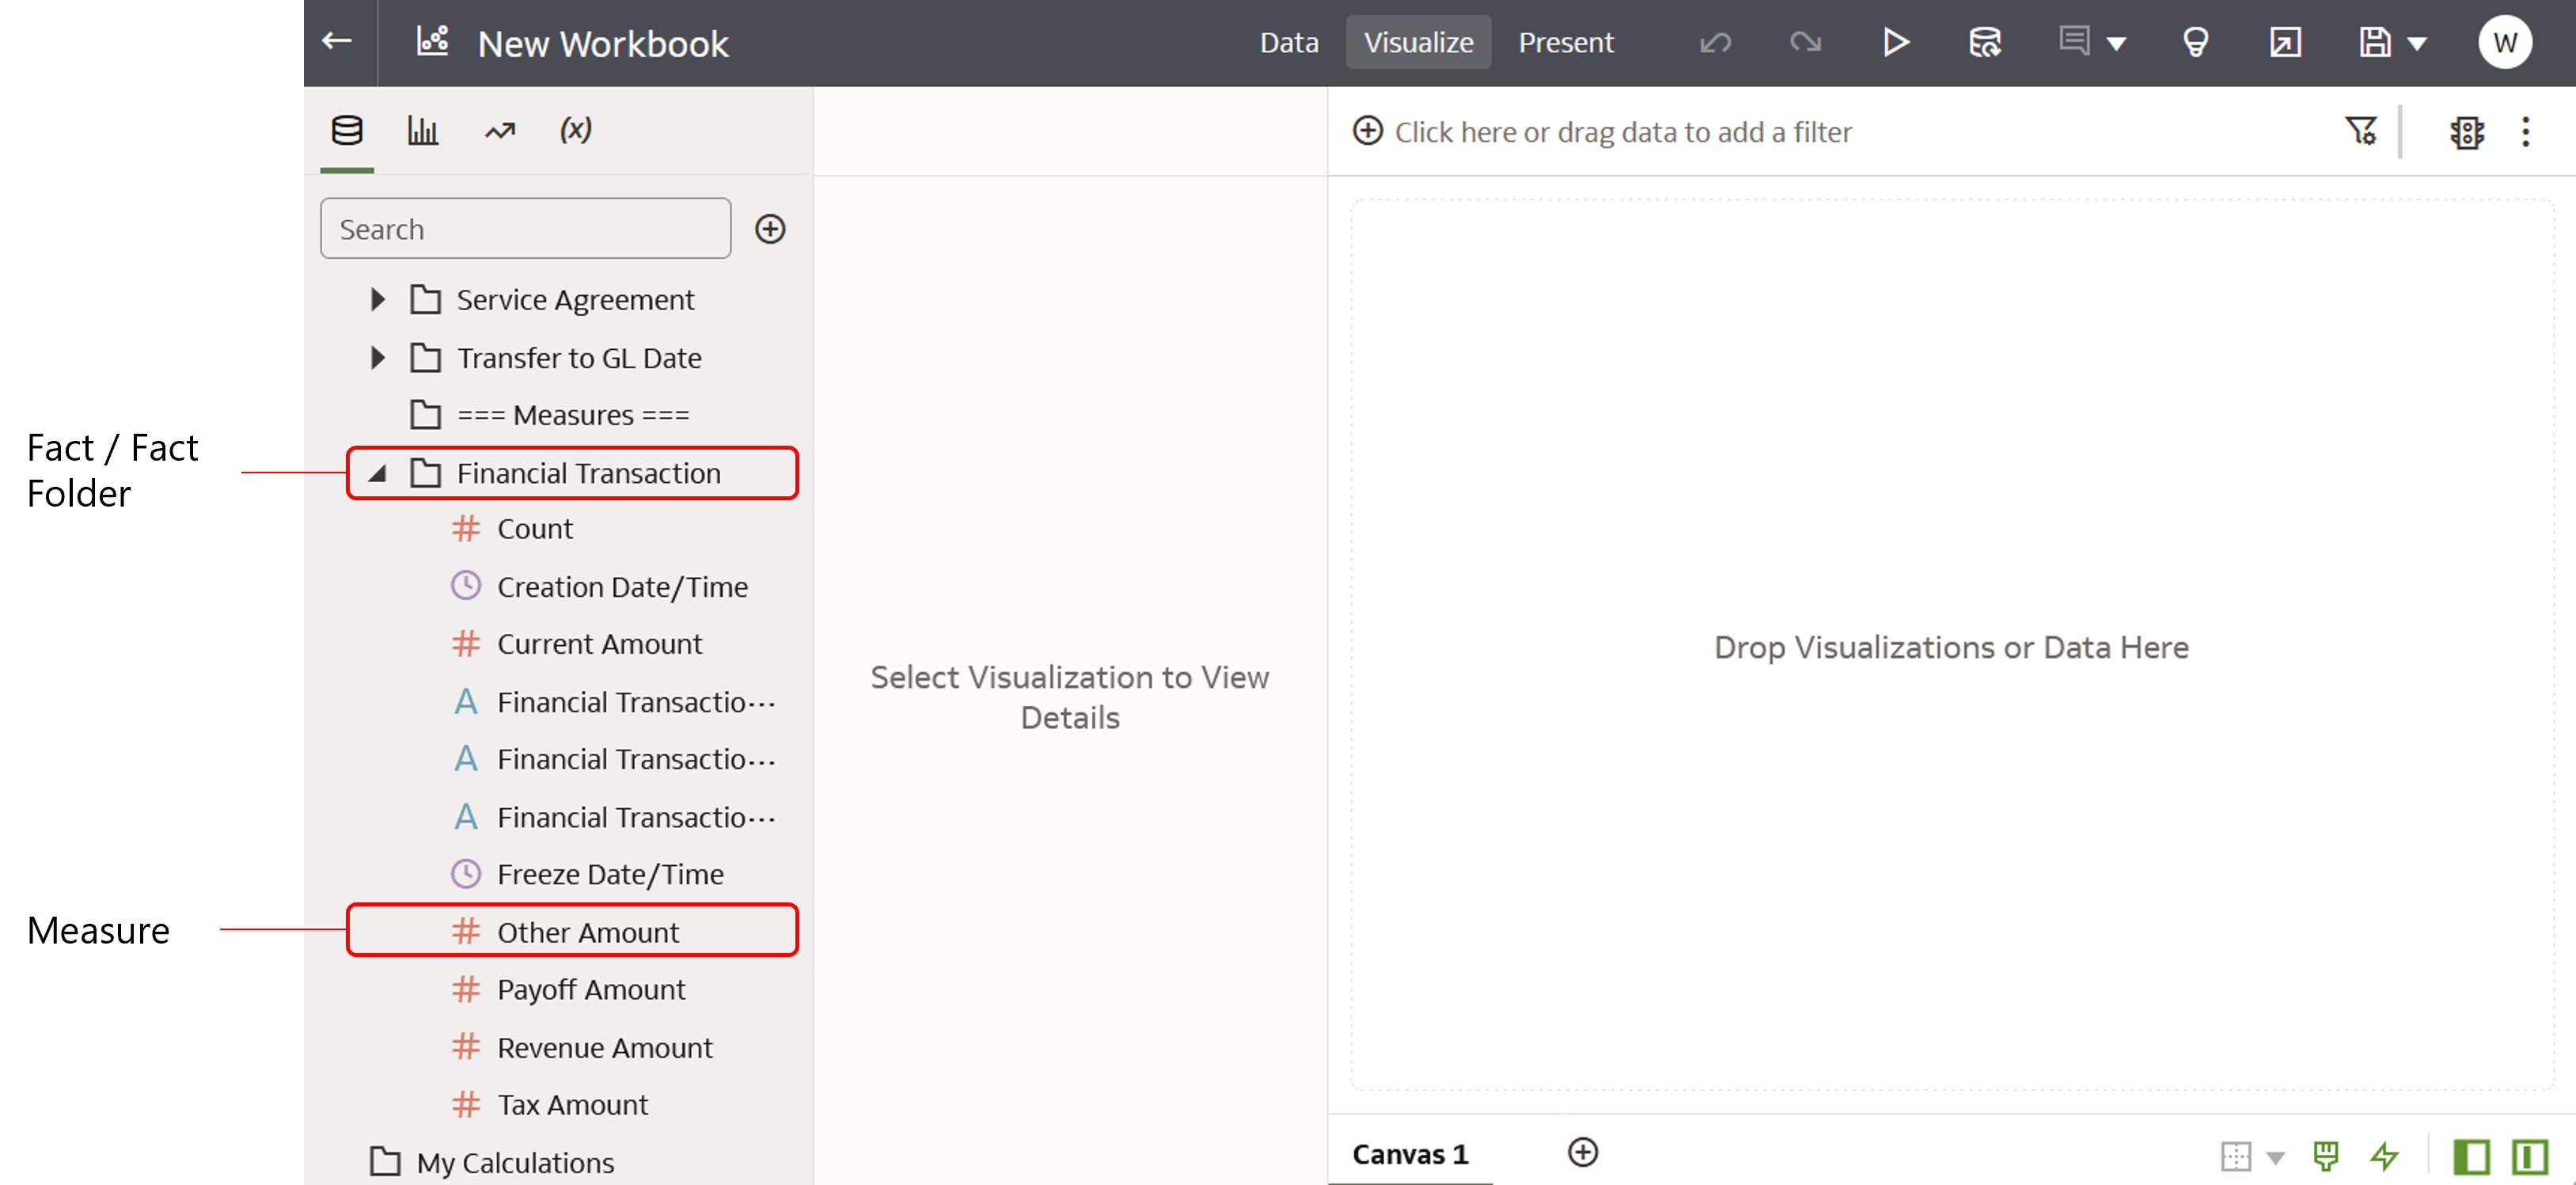
Fact folders appear after the === Measures === section in the data panel, and are preceded by a folder icon. Individual measures are preceded by an icon of the pound symbol (#).
Common Terms
Attribute: An attribute is a single data element within a dimension or dimension folder in a subject area. Often, an attribute describes a business entity. For example, in the Customer - Financial Transaction subject area, there is a dimension called Bill. Within this dimension, there are attributes such as Bill ID, Bill Status, Due Date, and other attributes. See the screenshot above for an example.
Calculation: A calculation is a predefined SQL query that can be dragged and dropped onto a canvas to create visualizations for key areas of your business operations.
Canvas: A canvas is a page within a workbook that contains one or more visualizations.
Data Actions: Data actions are navigation links configured in a canvas. Data actions can be used to navigate to another canvas in the current workbook, to a canvas in another workbook, or to your source Oracle Utilities enterprise software-as-a-service application by specifying the appropriate an URL. See Use Data Actions to Connect Canvases and Launch Enterprise Applications for more information.
Data actions can be configured on any data element. The contextual value can be passed to a source application (such as the Oracle Utilities Customer Cloud Service) or to internal canvases with various interactions and context-passing options. Once configured, data actions appear in the right-click menu in Analytics Visualization where the data element is used.
Configuring data actions is a task that must be performed by a user with authoring privileges. See Role Types for more information.
Data Panel: The Data Panel is a side menu that displays in Analytics Visualization. From the Data Panel, you can select data elements and visualization options when creating a canvas.
Dataset: A dataset defines the structure of usable data that can be leveraged in a workbook in Analytics Visualization. There are a few different types of datasets:
- Subject areas that are constructed within a logical model
- Datasets based on a direct connection to a source (such as a database)
- Datasets from an imported file (such as a spreadsheet)
Dimension / Dimension Folder: A dimension is a category or folder that contains individual attributes. Attributes are often used to describe business entities (like Customer, Account, Service Point, or Asset) and also to provide context to numeric data, such as being able to categorize count of To Do Entries by To Do Type.
Fact / Fact Folder: Facts contain measures that have aggregations built into their definitions.
Measure: A measure is an individual data element that is typically a calculated value, such as a dollar value (amount billed) or a quantity (number of failed assets). For example, you might want to determine the sum of dollars for a given product in a given market over a given time period.
Each measure has its own aggregation rule, such as SUM, AVG, MIN, or MAX. A business might want to compare the values of a measure and need a calculation to express the comparison.
Note: The word “measure” can be used synonymously with “metric”.
Workbook: A workbook is a grouping of canvases which can include data from one or more subject areas.
Subject Area: A subject area is a logical grouping of data that can be analyzed in a manner that reflects the structure of the business. See Subject Areas above for details.
Visualization: Visualizations are graphical displays that help you to analyze your data in a productive and meaningful way.
Visualization Type: A visualization type refers to the type of graphic you want to create in your canvas, such as a pie chart, bar chart, or tree map.
Naming Conventions
Oracle Utilities Analytics Visualization uses prefixes in the names of workbooks and subject areas to indicate the type of data used or exposed in it.
Asset: This prefix is used in subject areas and workbook names to indicate that they only include asset-specific data such as asset types, work orders, and activities. See Asset Subject Areas.
Customer: This prefix is used in subject areas and workbook names to indicate that they only include customer-specific data. Examples of customer-specific data include Accounts, Persons, Premises, and Service Agreements. See Customer Subject Areas.
Meter: This prefix is used in subject areas and workbook names to indicate that they only include data specific to meters. Some examples of meter data are: Service Points, Usage Subscriptions, Devices, Events, and Activities. See Meter Subject Areas.
Common: This prefix is used in subject areas and workbook names to indicate that they are shared across all services. Some examples of common data are: To Do and Batch. See Common Subject Areas.
View Subject Area Metadata in the Analytics Table
Your Oracle Utilities SaaS application (Customer Cloud Service, Work and Asset Cloud Service, or Meter Solution Cloud Service) includes an Analytics Table portal that holds the metadata and definitions of each fact, dimension, and measure of every subject area available in Analytics Visualization. This information can be useful to see and understand as you work in the application.
Note: Changes to the Analytics Table metadata (such as editing the structure of the dimension and facts, or adding a new measure) can be made, but they will not be reflected in Analytics Visualization. It is recommended that you do not modify the metadata and use it for reference only.
To access the Analytics Table portal:
Do one of the following:
- Sign into the source application and then click Admin Menu, select Analytics Configuration, and then select Analytics Table.
- Search for "Analytics Table" using the search bar at the top of the screen.
For more information about the structure and content of the portal, go to the documentation library of any of the Oracle Utilities enterprise SaaS applications. Once there, search for and select the Administrative User Guide link, and then go to the section ‘Defining Analytics Tables.'
- Customer Cloud Service Documentation Library
- Meter Solution Cloud Service Documentation Library
- Work and Asset Cloud Service Documentation Library
Base Data Visualization Workbooks
Oracle Utilities Analytics Visualization comes with a set of pre-built data visualization (DV) workbooks. See Base Data Visualization Workbooks for details.
Related Documentation
This section shows a list of guides that contain information related to the cloud services and product areas covered in this guide.