Demand Day Usage Module
The Demand Day Usage module educates customers about how much energy they use during peak hours on the day in which their demand hour occurred. The module encourages them to shift tasks to off-peak hours to lower their demand and save money.
This module includes the following components:
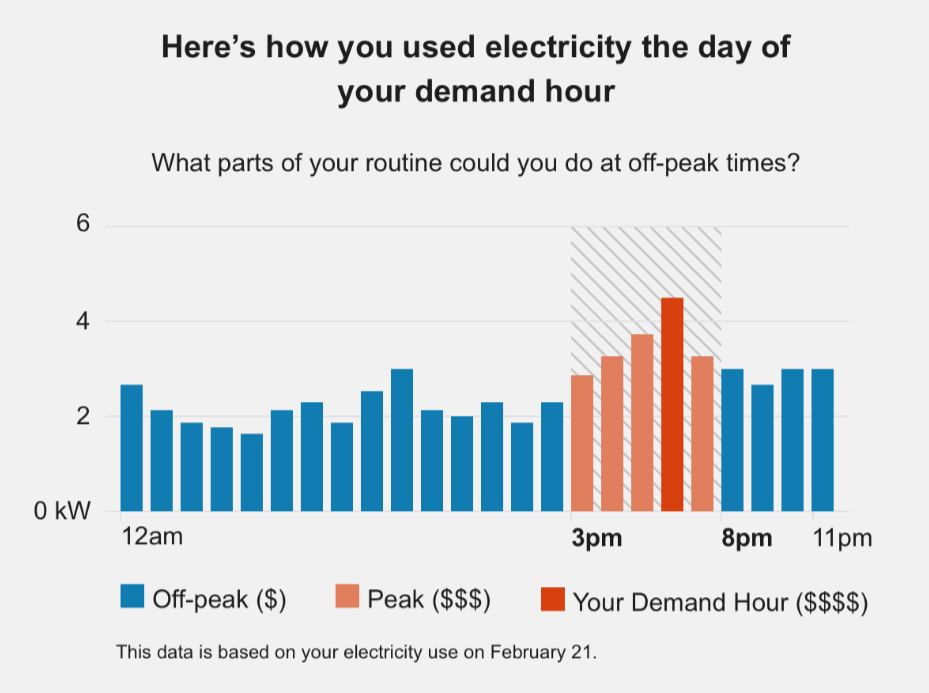
Heading and Introduction Statement: The Demand Day Usage module includes an introduction statement that tells the customer that the graph depicts how they used energy on the day during which their demand hour occurred. Below this statement is a question that asks them what parts of their routine they can do during off-peak hours, which encourages them to shift tasks to lower-cost times of the day.
Hourly Usage Bar Chart: The module includes a chart of the customer's hourly electricity demand during the day on which their demand hour occurred. The chart highlights peak hours and the specific demand hour, to draw attention to how the customer's average electricity usage during peak hours compares to their off-peak usage.
Date Range Statement: A statement below the chart identifies the dates the graph is based on. For example, "This data is based on your electricity use on February 21."
This image shows an example of the Demand Day Usage module: