How Businesses Use Energy
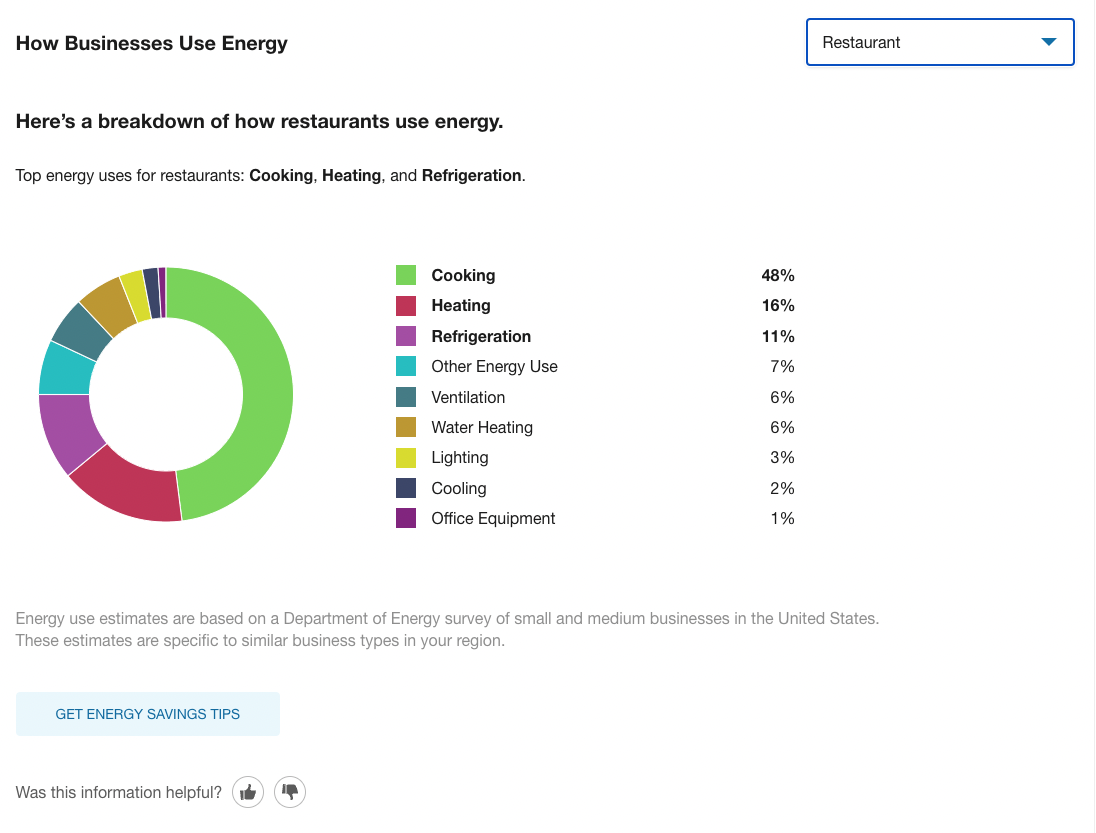
The How Businesses Use Energy feature allows business customers to see an estimated annual breakdown of energy use categories (such as heating, cooling, lighting, refrigeration, and so on) based on primary business type or activity (such as education, healthcare, retail, or restaurant). Use the information below to review the available configuration options.
On this page:
How Businesses Use Energy Example
The image below is an example of the How Businesses Use Energy feature.

Configuration Options
For each element listed in the table, indicate the desired configuration in the Input Value column. If you do not provide an input for optional configurations, the default will be used.
|
Configuration Option |
Input Value |
|---|---|
|
The Customer Feedback section below the widget can be disabled. Default: Enabled. |
Optional Choose one of the following:
|
User Experience Variations
The user experience may vary for customers and utilities depending on their service types (gas, electricity, dual fuel, and so on), available data, costs, locale, and other factors. For more information, see How Businesses Use Energy in the Business Customer Engagement Digital Self Service - Energy Management Overview Guide.