Efficiency Zone
The Efficiency Zone widget replaces the standard Neighbor Comparison for customers who receive the Efficiency Zone module in their print or email Home Energy Reports v3 experience. The widget includes a two-bar graph that compares customer and similar homes usage against an "Efficiency Zone" threshold, and displays insights that place the customer's usage in context. The Efficiency Zone represents the 20% of similar homes that used the least during that bill period. The customer's status within the zone can change with each report.
Note: The customer's web experience with the Efficiency Zone mirrors whatever is in their print or email report experience. For example, customers who receive the Efficiency Zone in their print or email report will also see an Efficiency Zone widget in the Digital Self Service - Energy Management web portal. Utilities have the option to replace the Efficiency Zone with the standard Neighbor Comparison.
On this page:
Requirements
Utility Requirements
| Required Cloud Service | Same as listed in the product-wide requirements. |
| Scale | No applicable scale requirements. |
Customer Requirements
|
Billing Frequency |
Monthly, bi-monthly, or quarterly. |
|
Data Delivery Frequency |
Monthly, bi-monthly, or quarterly. |
| Data Requirements |
Billing data is required. Additionally, some third-party data (geospatial data and parcel data, for example) is required to select other similar homes for the comparison. The feature will not display if it is unable to select the minimum number of neighbors. The minimum threshold may vary depending on your utility's setup and configuration. Contact your Delivery Team if you have any questions. |
|
Data History |
A single bill from the last bill period or previous to last bill period. |
|
Data Coverage |
Not applicable. Data at the bill level is used. |
|
Supported Fuels |
Electricity, gas, and dual fuel. |
User Experience
The Efficiency Zone experience re-frames the "efficient neighbors" concept in order to improve customer satisfaction without heavily compromising energy efficiency. To do this, the Efficiency Zone experience presents a bar graph that compares customer and similar homes' usage against an "efficiency zone", and provides insights that place the customer's usage in context.
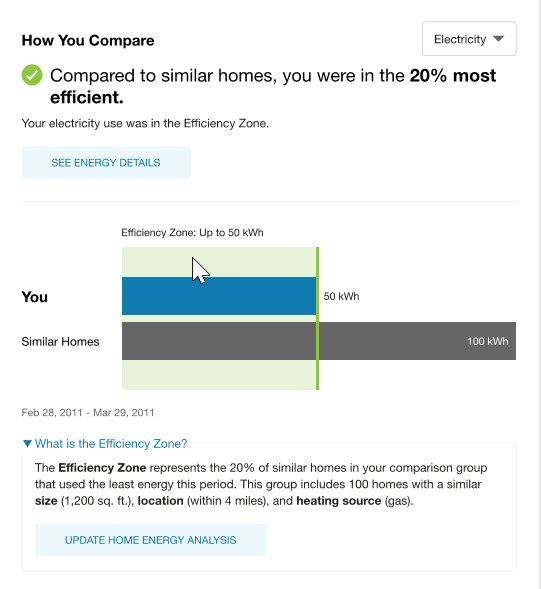
Heading: The heading uses the language of a social comparison to entice customers to learn more about their energy use.
Hero Insight Statement: The hero insight statement conveys the customer's energy efficiency status relative to one of two benchmarks: Efficiency Zone or Similar Homes. The icon that appears in the statement varies depending on the customer's state. If the customer is within the Efficiency Zone, a green check mark appears. If the customer is not within the Efficiency Zone, a gray exclamation icon appears.
Secondary Insight: The secondary insight states whether the customer's energy use was inside or outside of the Efficiency Zone.
Threshold Label: The threshold label appears above the graph to introduce the maximum Efficiency Zone threshold (for example, "Up to 500 kWh").
The Efficiency Zone threshold represents the average energy use of the 20th percentile of similar homes that used the least amount of energy in the last billing period. A green tinted rectangle and dark green vertical line indicate the range and upper boundary of the zone, enabling customers to quickly see their status in relation to it. The back-end logic used to calculate the Efficiency Zone is identical to the logic used to calculate "efficient neighbors" in the standard Neighbor Comparison.
Graph: The two-bar graph displays the customer's energy use ("You" bar) and how the customer compared to Similar Homes. The Similar Homes bar represents the average energy use of the customer's selected neighbors during the last bill period.
Date Range: The date range displays the time period covered by the comparison. The comparison always covers the last completed billing period. The year accompanies both the start date and end date (for example, Dec 20, 2019 – Jan 20, 2020).
What Is the Efficiency Zone: When this link is clicked, information is displayed to describe the characteristics that match between the customer's home and the homes they are being compared against. It is similar to the Who Are My Neighbors section of the standard Neighbor Comparison.
Call to Action: At the bottom of the feature is a call-to-action button that prompts customers to update their Home Energy Analysis, provide the latest details about their home, and make the efficiency zone more accurate. Note, however, that the efficiency zone is not automatically updated in real time based on a customer's updates. Moreover, the call-to-action does not change if the user has already visited the Home Energy Analysis.