Data Browser
The Data Browser is an interactive tool that allows customers to visualize and explore their energy use trends and costs, and make comparisons to useful benchmarks, such as weather and similar homes. Use the images and tables below to review the available configuration options.
On this page:
Energy Costs View
The image below is an example of the Energy Costs view and its primary configuration options.

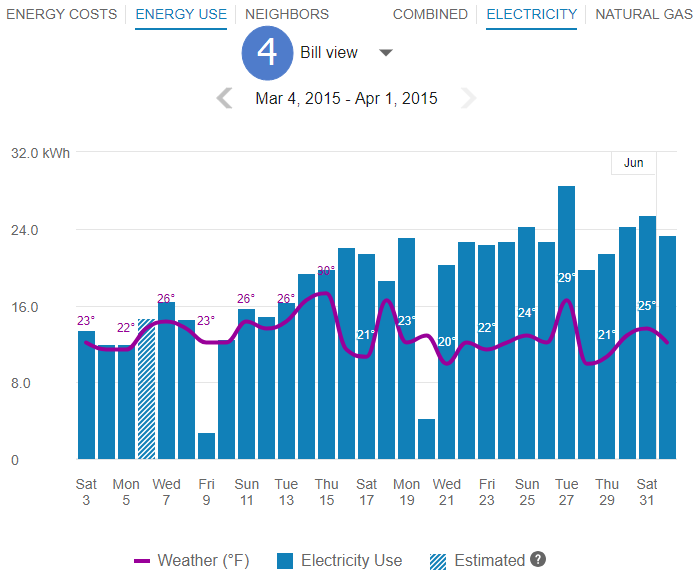
Energy Use View
The image below is an example of the Energy Use view and its primary configuration options.
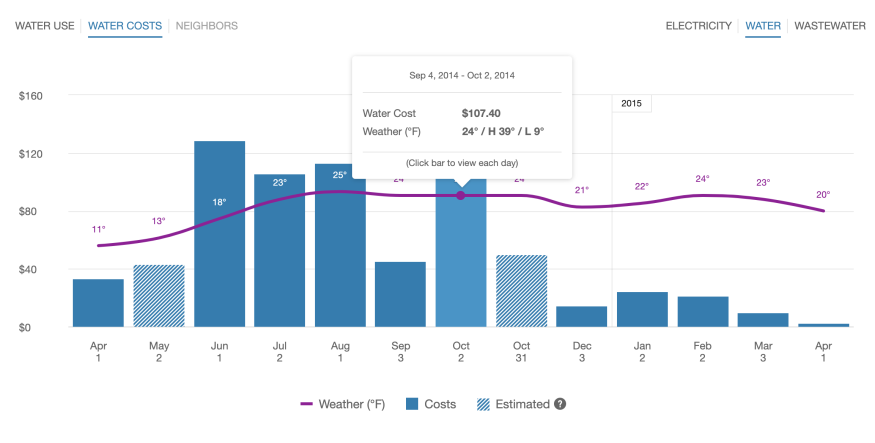
Water or Wastewater Costs View
Water or Wastewater Use View

Demand View

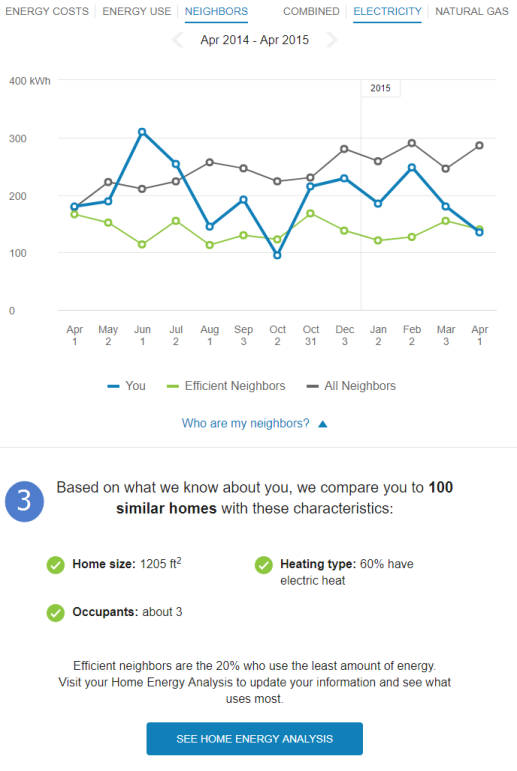
Neighbors View
The image below is an example of the Neighbors view and its primary configuration options.
Configuration Options
For each element listed in the table, indicate the desired configuration in the Input Value column. If you do not provide an input for optional configurations, the default will be used.
|
Configuration Option |
Input Value |
|---|---|
|
Graph / View Display and Order (not depicted) Utilities can choose which graphs or views to display, and the order in which to display them. Default: The following views are displayed in the order listed as long as there is sufficient data: Energy Costs, Energy Use, and Neighbors. |
Required Choose one of the following: Use the default. Work with your Delivery Team to choose the views to display and the order. |
|
Tooltip Explanation Link for Estimated Reads (not depicted) Utilities can provide a URL to include as an explanation link for estimated reads. Default: No link provided. |
Optional Choose one of the following: Use the default. Provide a URL. |
|
1. Default Fuel or Resource Type Selected Utilities can choose which fuel or resource type to be selected by default. Default: Display electric data as default. |
Optional Choose one of the following: Display electric data as the default. Display gas data as the default. Display combined fuel (electric and gas) as the default. Display water as the default. Display wastewater as the default. |
|
2. Combined Fuel View For dual fuel customers with electricity and gas service, a combined fuel view combines the energy use for gas and electricity into a single "units" value. When combined fuel view is enabled, applicable tooltips also display combined totals. Combined view also includes billing insights for a customer's energy costs. Default: Hide the combined fuel view. |
Optional Choose one of the following: Use the default. Display combined fuel view. |
|
3. Dynamic or Static Number of Neighbors Language Determines the language used to describe the number of neighbors that the customer is being compared to. A static estimate may be used. Default: Language describing number of neighbors is calculated dynamically. |
Optional Choose one of the following: Use the default. Use the following number as the static estimate. |
|
3. "Neighbors" Terminology "Neighbors" terminology can be replaced by "Similar Homes" terminology. Default: Use "Neighbors" terminology. |
Optional Choose one of the following: Use the default option. Use "Similar Homes" terminology. |
|
4. Default Time View The Bill view can be displayed by default for customers with AMI data. Customers without AMI data can only use the Year view. Default: Display the Year view as the initial view. Customers with AMI data can then select to see the Bill view or Day view. |
Optional Choose one of the following: Display Year view as the default. Display Bill view as the default for customers with AMI data. |
|
5. Water and Wastewater Units of Measure Customers viewing their water or wastewater use are presented the values in an applicable unit of measure. This unit of measure is represented on the Y axis of the view as well as in any applicable tooltips. Default: kgal (kilogallons) |
Optional Choose one of the following: Use the default option. Provide the unit of measure for water and wastewater use. |
|
6. Demand View The Demand view visualizes demand (kW) and reactive power (kVAR) data for commercial and industrial customers. Default: Disable Demand View |
Optional Choose one of the following: Use the default option. Enable Demand View. |
|
Costs Footer or Disclaimer (not depicted) A brief message displayed below the views that display a customer's costs. Default: None |
Optional Choose one of the following: Use the default option. Display a footer or disclaimer. Provide a short message to include in the footer or disclaimer. |
|
Use Footer or Disclaimer (not depicted) A brief message displayed below the views that display a customer's use. Default: None |
Optional Choose one of the following: Use the default option. Display a footer or disclaimer. Provide a short message to include in the footer or disclaimer. |
|
Neighbors Footer or Disclaimer (not depicted) A brief message displayed below the Neighbors view. Default: None |
Optional Choose one of the following: Use the default option. Display a footer or disclaimer. Provide a short message to include in the footer or disclaimer. |
|
Demand Footer or Disclaimer (not depicted) A brief message displayed below the Demand view. Default: None |
Optional Choose one of the following: Use the default option. Display a footer or disclaimer. Provide a short message to include in the footer or disclaimer. |
|
Peak Time Rebates Annotation (not depicted) Peak event days and hours are highlighted with icons and tooltips. The tooltips display details regarding the credits the customer earned by participating in a peak event. Default: Disabled |
Optional Choose one of the following: Use the default. Enable Peak Time Rebate Annotation. |
|
Peak Time Rebates Annotation Learn More Link (not depicted) Utilities can provide a URL to include as a Learn More link for Peak Time Rebates annotations. Default: None |
Optional Choose one of the following: Use the default. Provide a URL. |
User Experience Variations
The user experience of this feature may vary for customers and utilities depending on their service types (gas, electricity, dual fuel, and so on), available data, costs, locale, and other factors.