Billing Insight
Billing Insight is designed to provide solar customers with a graphical view of their current electricity bill. Solar customers who navigate to the Electricity view in the Digital Self Service - Energy Management Data Browser for the first time will see the Solar Welcome Experience. Upon subsequent visits, the customer will see the monthly Billing Insight, where they can also view previous bills.
Design
This section discusses the design for Net Metering Monthly Billing customers.
Bill View
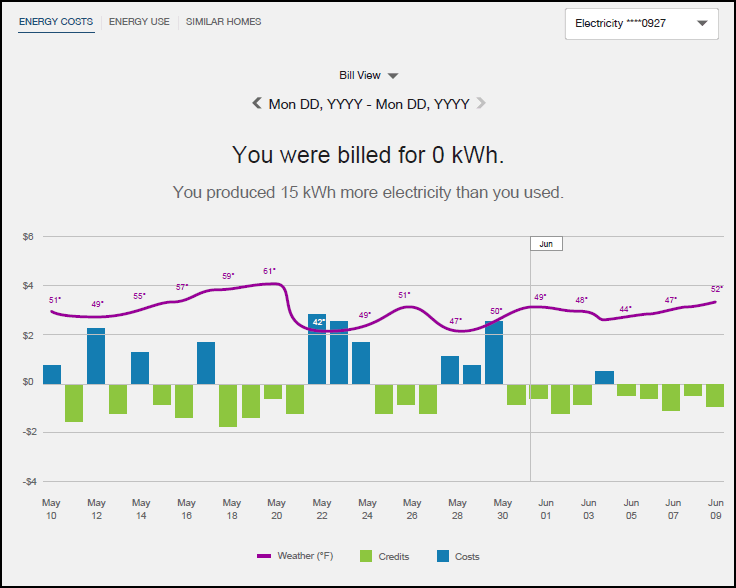
The Bill View section of the monthly Billing Insight shows solar customers their costs and credits for the billing cycle.
The following image is an example of the Bill View.
Figure 2-5 Bill View
Most Recent Bill
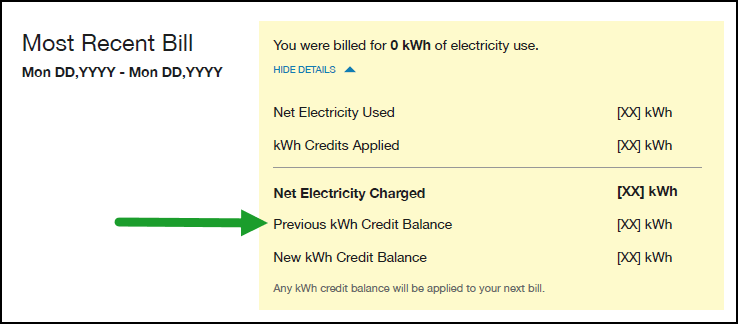
The Most Recent Bill section appears below the Bill View section. By default, the Details link is not expanded.
The following image is an example of the Most Recent Bill view with the Details link expanded.
Figure 2-6 Most Recent Bill
Configuration Options
For each element listed in the table, indicate the desired configuration in the Input Value column. If you do not provide an input for optional configurations, the default will be used.
Table 2-2 Configuration Options
| Configuration Option | Input Value |
|---|---|
|
kWh Credit Statement Use this option to tell customers how the utility handles any kWh credits that they receive during the billing period. This option appears at the bottom of the Most Recent Bill section. Defaults:
|
Required Choose one of the following:
|
|
Extra Bullet in Green Box Insight Use this option to specify whether to include an additional suggestion in the Green Box Insight, which appears below the graph for net billing customers. If you include the additional suggestion, it appears below the two default suggestions, and reads:
|
Required Choose one of the following:
|
User Experience Variations
This section describes user experience variations for solar customers.
Net Metering Annual Billing Insight
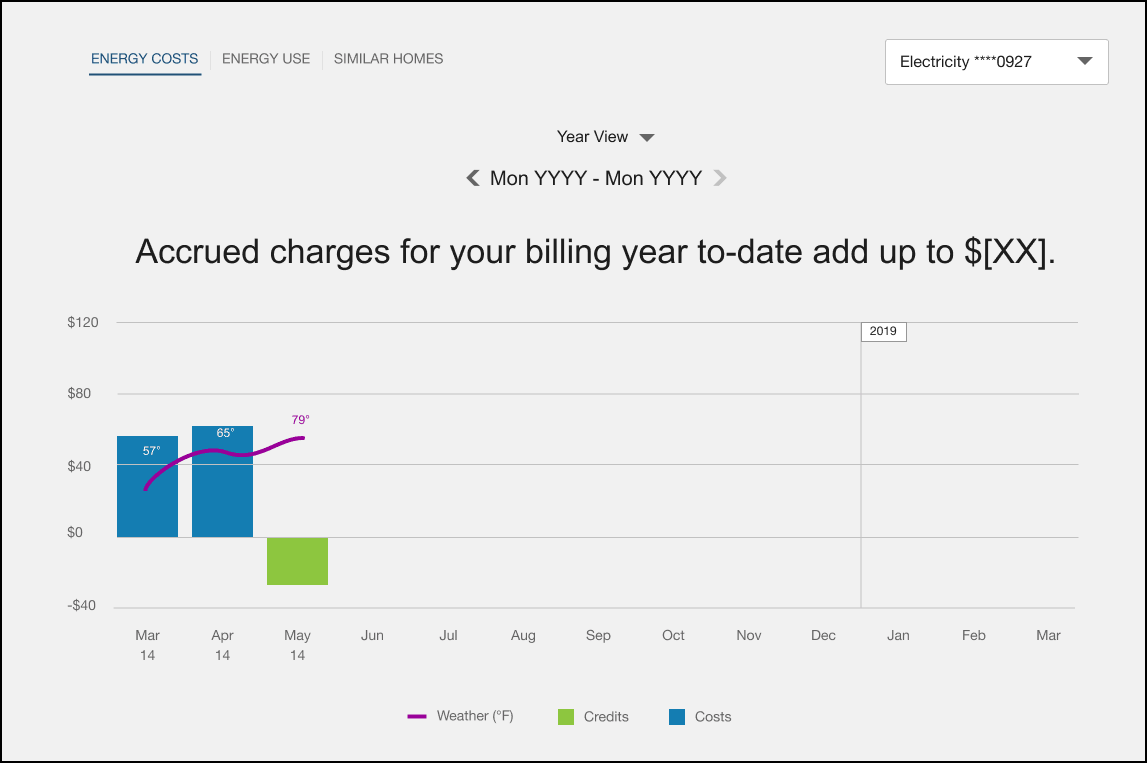
Net Metering annual billing customers are not billed, nor do they make monthly payments for net electricity usage. Instead, charges accrue during the annual billing period, and customers may receive a larger bill at the end of that period. The annual Billing Insight is designed to provide a graphical view of the customer's current electricity bill. Solar customers who navigate to the Electricity view in the Data Browser for the first time will see the Solar Welcome Experience. Upon subsequent visits, within the customer’s Data Browser chart, the customer will see the annual Billing Insight, which displays information about billing cycle dates, year-to-date accrued charges, and the Current Billing Year.
The annual Billing Insight includes the following components:
- Date Range: The dates associated with the current annual billing period.
- Billing Statement: This statement tells the customer what their accrued year-to-date charges are in the current billing period.
- Monthly Billing Graph: This graph displays the net energy costs or usage (depending on the view) that the customer incurred each month during the billing period. Credits are displayed as negative amounts in green, while costs are displayed as positive amounts in blue. A weather insight is also displayed on the chart to help customers understand the correlation between weather and their net energy costs and usage.
The following image is an example of the annual Billing Insight monthly billing graph.
Figure 2-7 Billing Insight
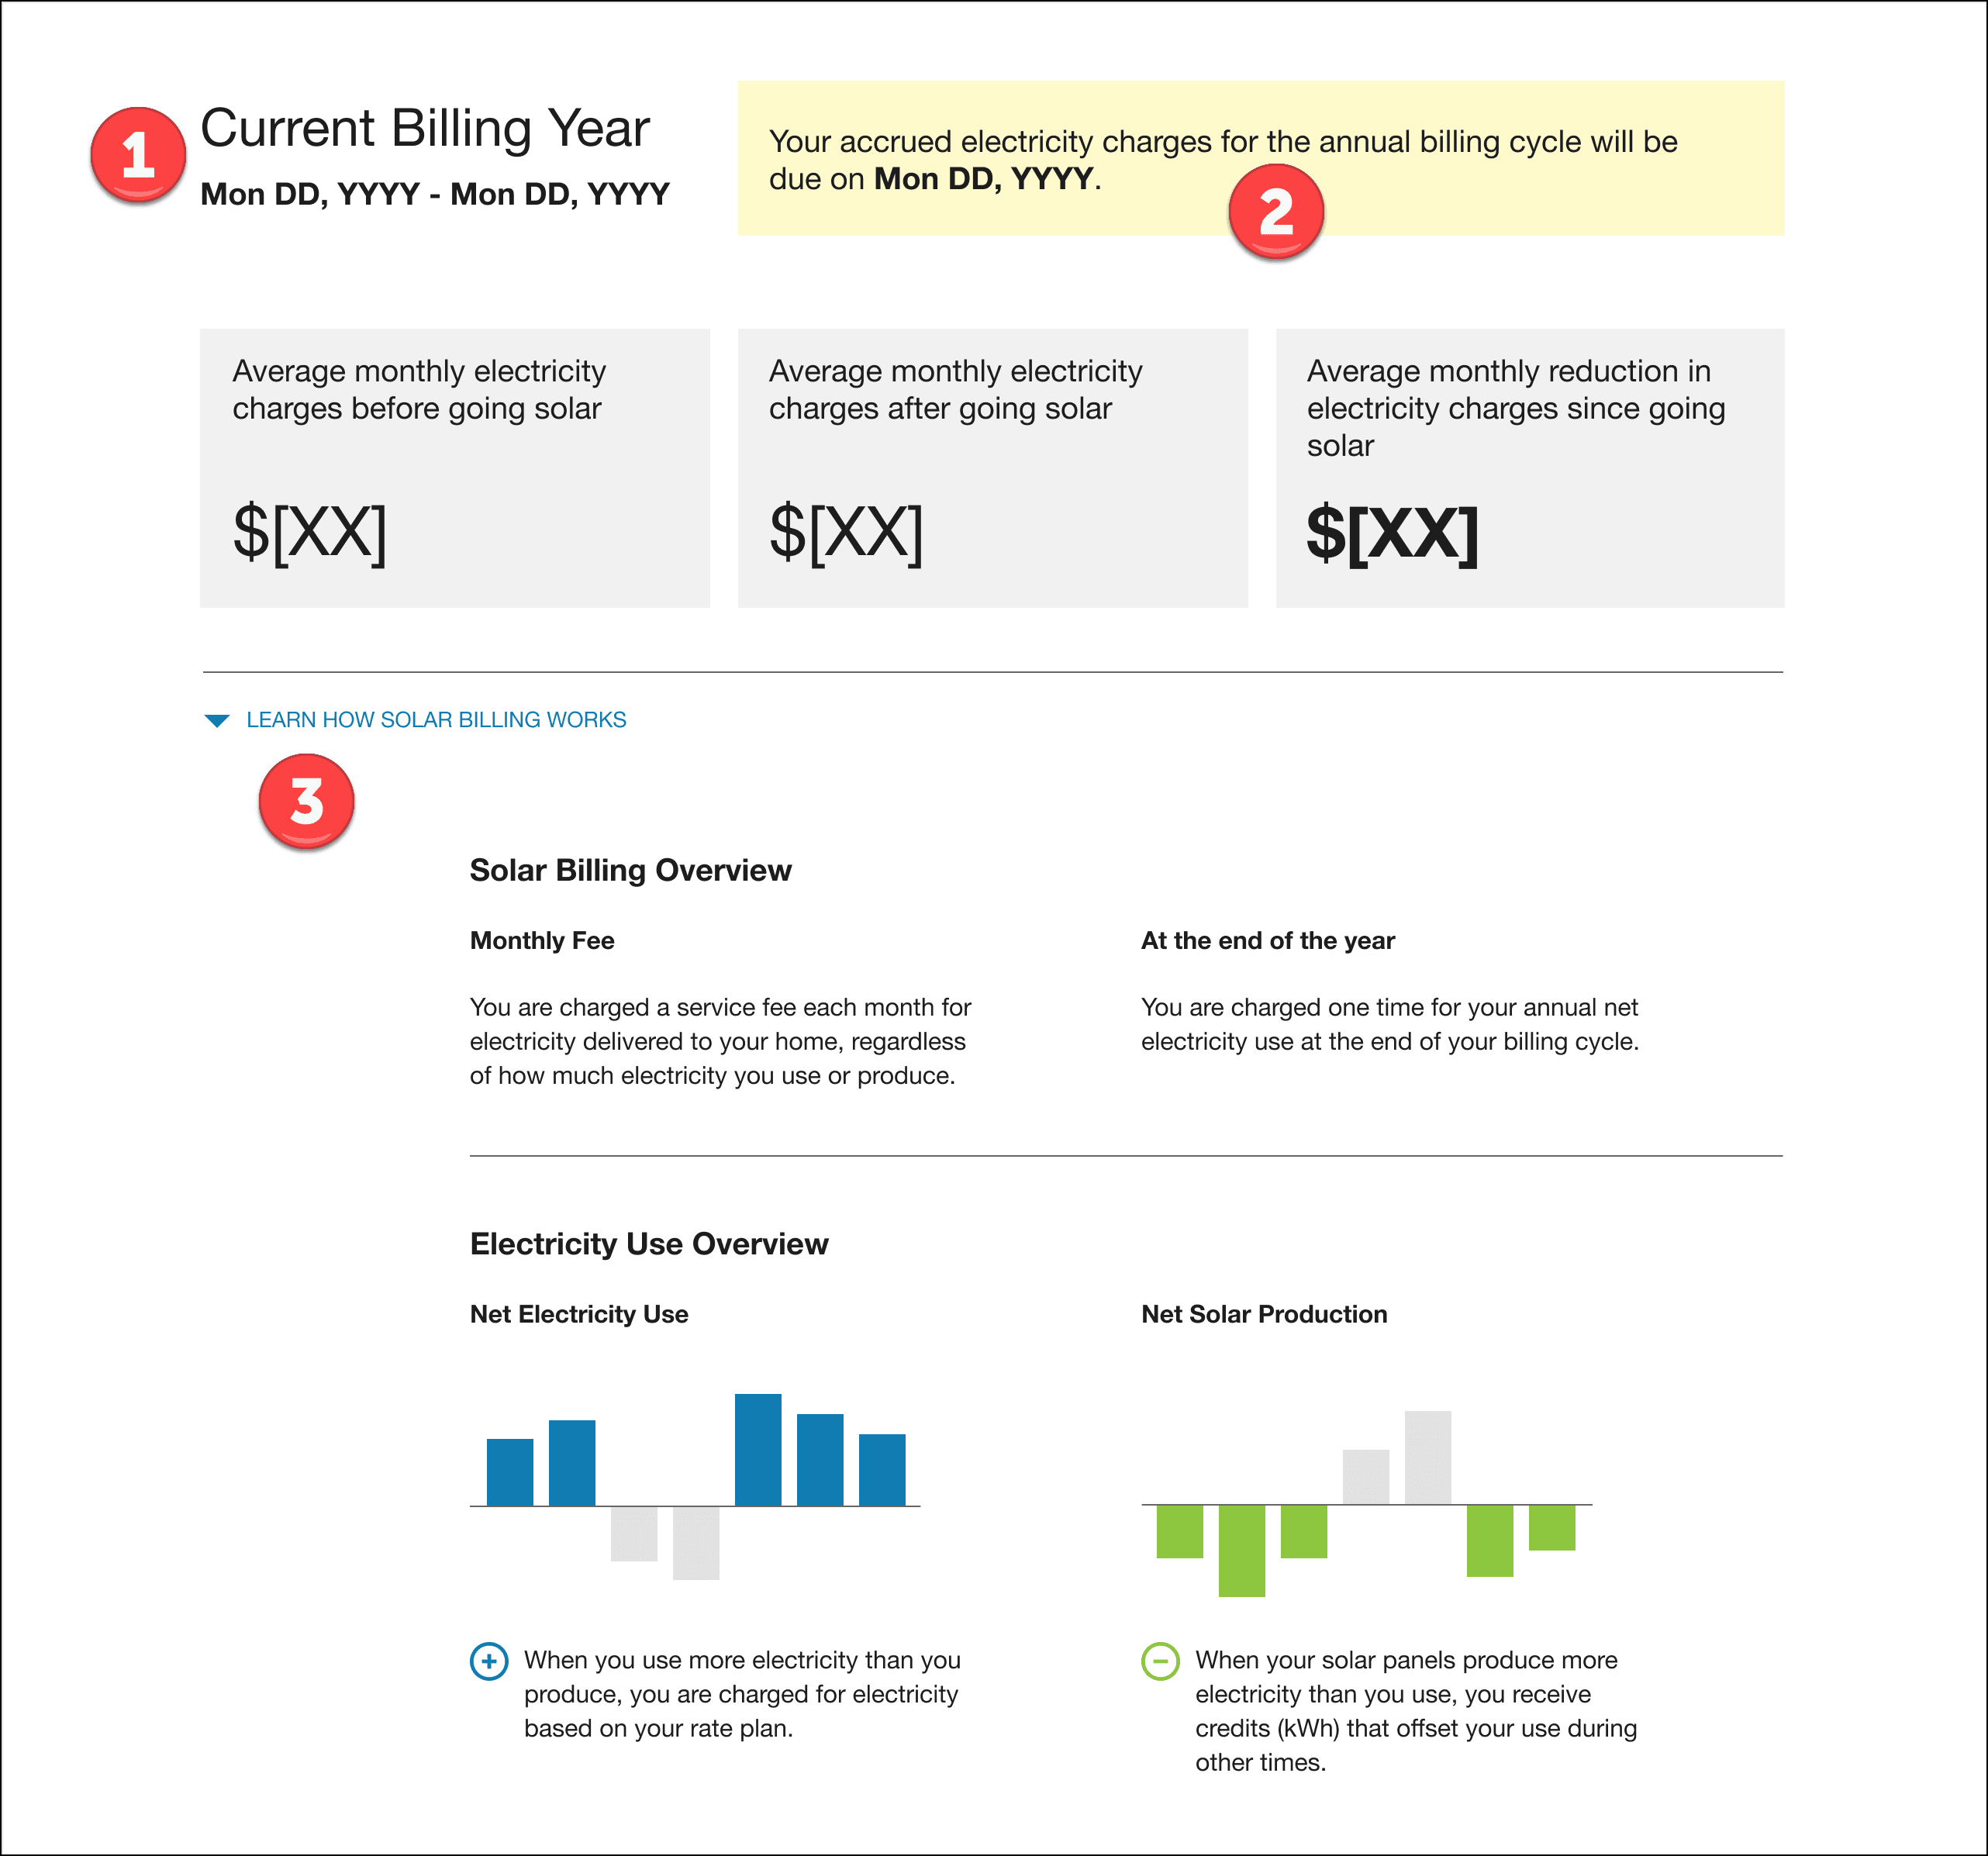
The Current Billing Year section appears below the monthly billing graph and includes:
- Current Billing Year: This replaces Most Recent Bill, which is what Net Metering monthly billing customers see.
- Billing Cycle Statement: Shows when the customer's accrued electricity charges for their annual billing cycle are due.
- Learn How Solar Billing Woks: Expandable link showing the customer a Solar Billing Overview and an Electricity Use Overview.
The following image is an example of the Current Billing Year section for annual billing customers.
Figure 2-8 Current Billing Year
Net Billing Customers
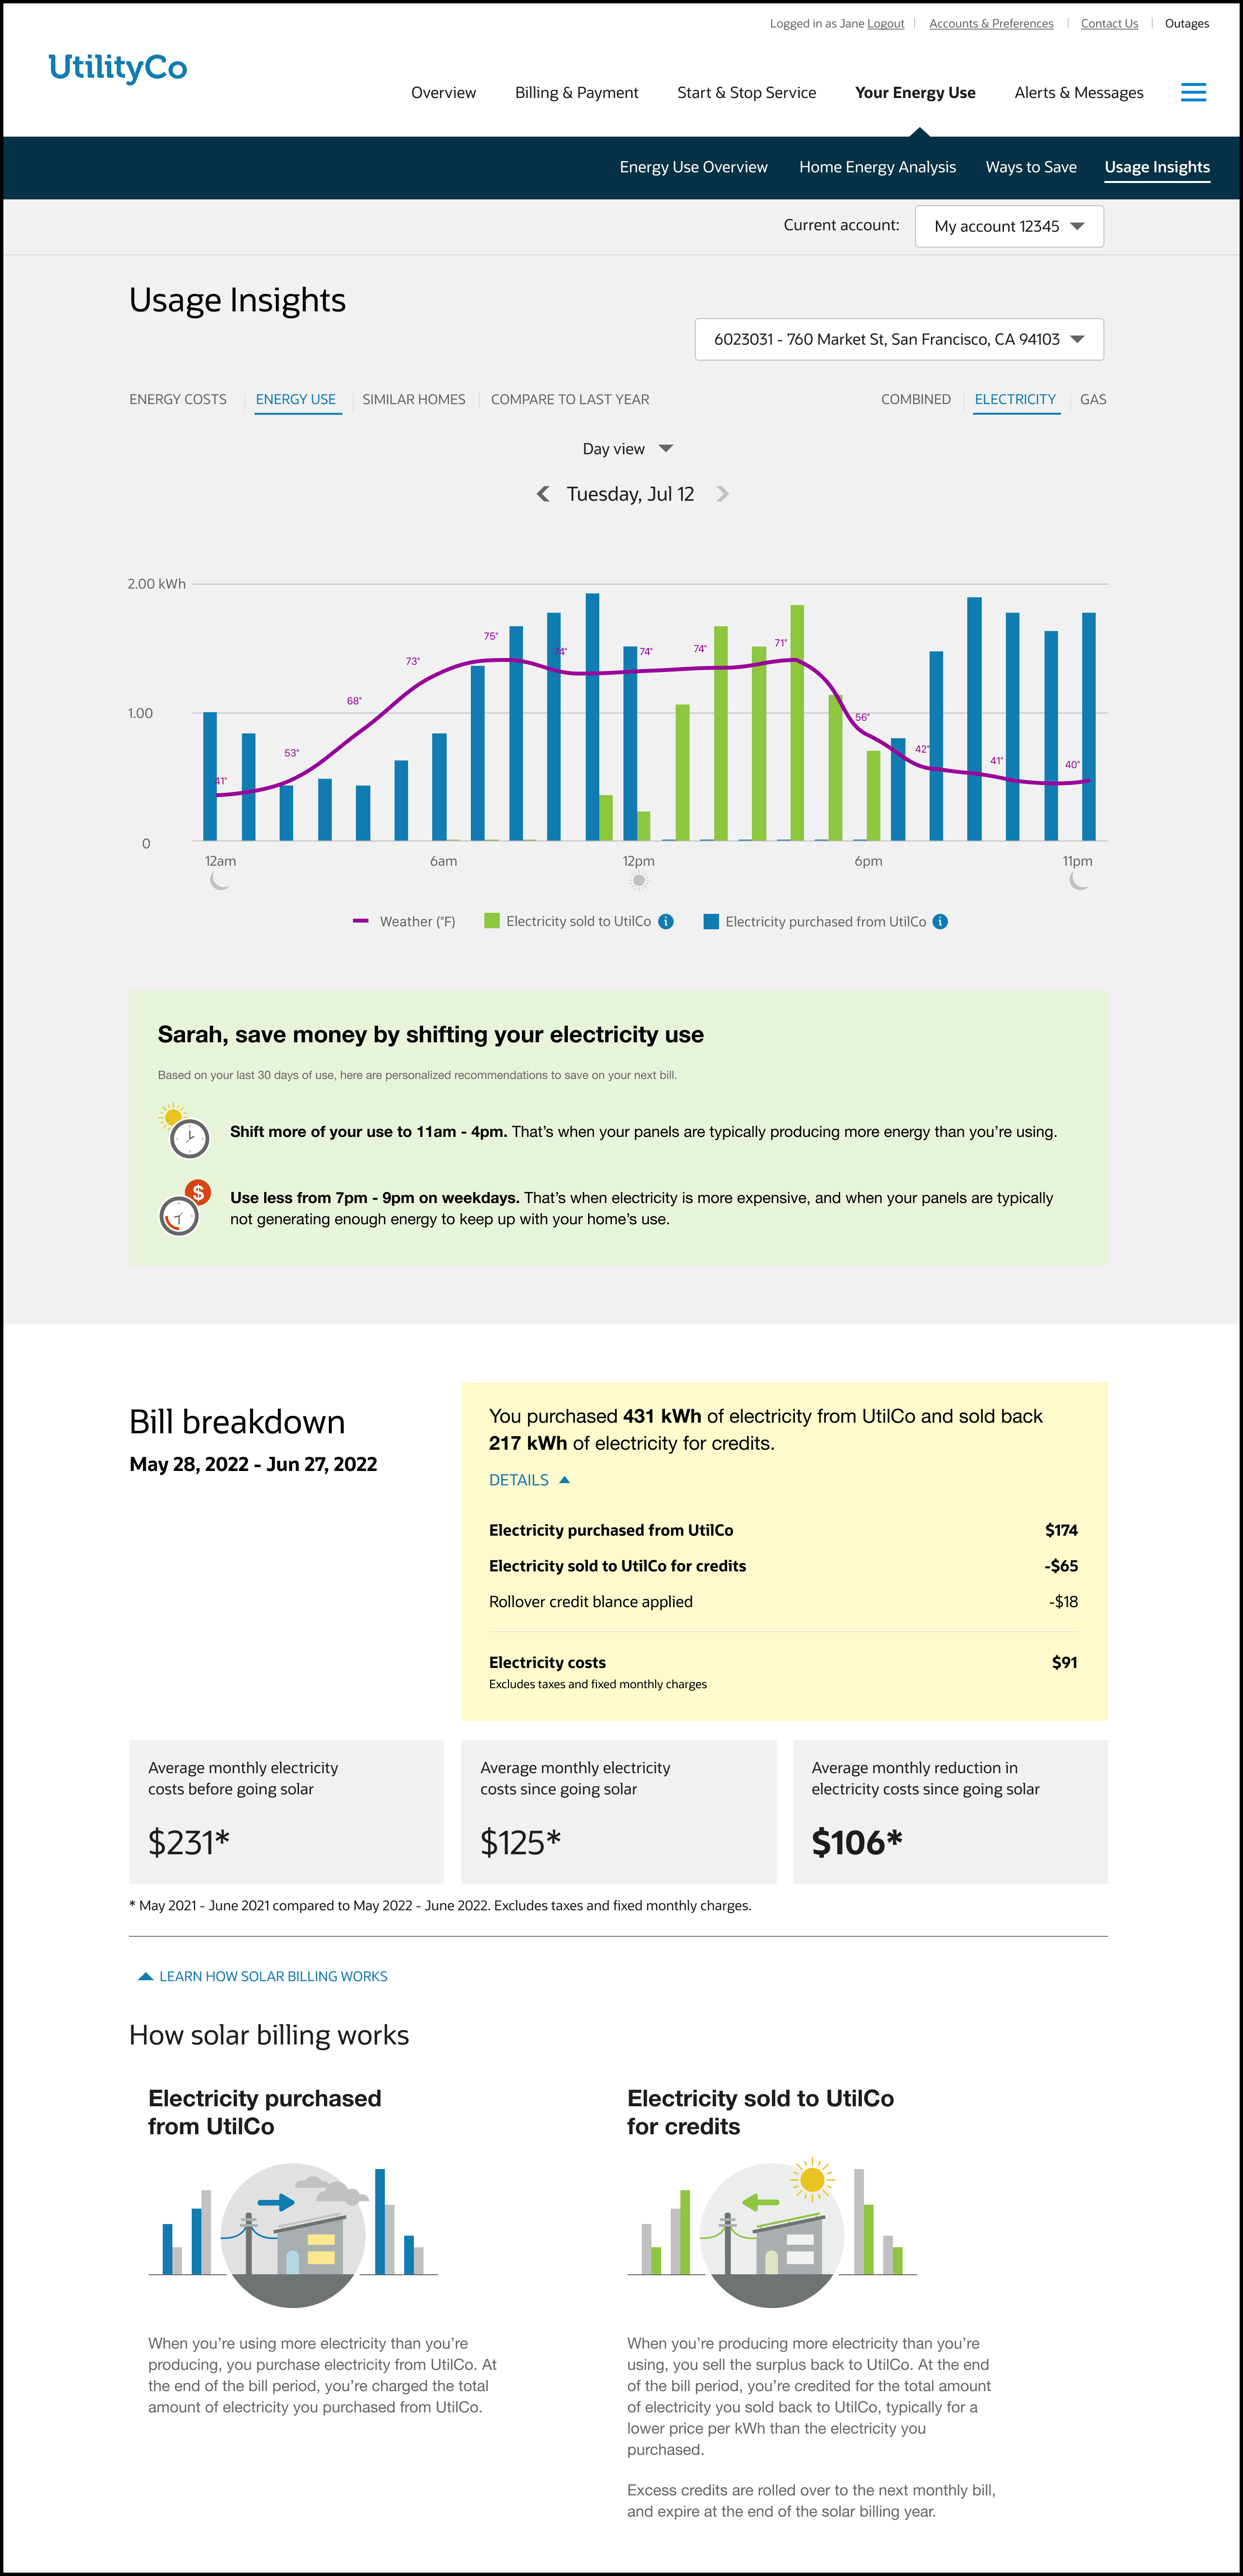
Net Billing customers will see their imported and exported energy from the Energy Use tab within the Data Browser. The Usage Insights will show the net bill amount for each month of the bill period instead of their usage charges and export credits. Net Billing customers will also see the Bill Breakdown section which shows the total amount of electricity they purchased and the total amount of electricity sold back to the utility.
The Usage Insight for Net Billing customers includes the following components:
- Data Browser Graph: This graph shows blue bars that represent the amount of electricity a customer imports, and green bars that represent the amount of electricity a customer exports.
- Green Box Insight: This insight gives customers recommendations for shifting energy use to save money. By default, the insight provides 2 suggestions, but it can be configured to include an additional suggestion to encourage customers to install a battery.
Bill Breakdown includes the following components:
- Details: This link will expand to show users the following in dollar amounts:
- Electricity purchased from the utility.
- Electricity sold to the utility for credits.
- Rollover credit balance applied (if any).
- Total electricity costs.
- Learn How Solar Billing Works: This link will expand to show customers the definitions of purchasing electricity and selling electricity.
The following image is an example of the Usage Insights and Bill Breakdown.
Figure 2-9 Usage Insights and Bill Breakdown
No Modeled Rates
When the utility does not have modeled rates, the customer experience varies as follows for monthly billing true up customers:
- The Bill View and Day View of the Energy Cost chart are unavailable. Users are shown an error message when they attempt to access these views.
- On the Energy Usage chart:
- The Most Recent Bill yellow credit box appears on all available resolutions.
- The Bill Insight appears on Bill View if the bill resolution is available. See the No AMI Data variation for additional information.
The experience varies as follows for annual billing true up customers:
- There is no Bill View or Day View for Energy Costs.
No AMI Data Available
When the utility does not provide AMI Data, the user experience varies as follows for monthly billing true up customers:
- Bill View and Day View are hidden for customers without AMI data. As a result, the Bill View Insight "You were billed for 0 kWh" does not appear for these customers.
- The Most Recent Bill yellow credit box appears on all other resolutions.
- The negative green bars appear if they have negative use or costs.
The experience varies as follows for annual billing true up customers:
- There is no Bill View or Day View for either energy costs or energy usage. Because the above-the-chart insight for annual billing customers is shown in Year View, this insight remains.
Mobile Format
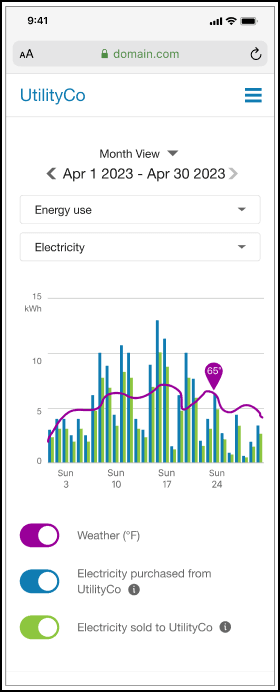
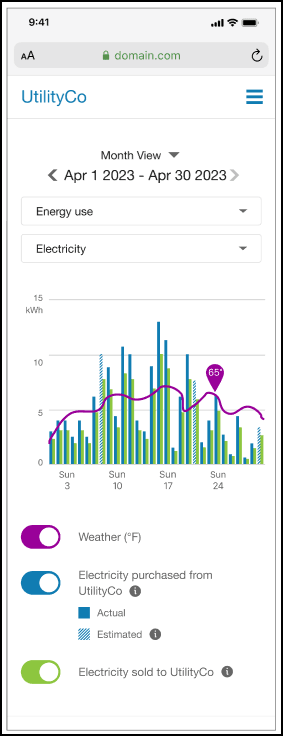
When viewing the Energy Use tab in the Data Browser on a mobile device, additional options are available below the chart that enable the user to hide or display the following options:
- Weather: Use this option to display the weather line on the chart. This option is set to OFF by default.
- Electricity purchased from the utility: Use this option to display the amount of electricity that was purchased from the utility in kWh. If the customer has both actual and estimated purchase data, both are displayed on the chart, and a legend appears below the option. This option:
- Is set to ON by default
- Is available only for net billing customers
- Electricity sold to the utility: Use this option to display the amount of electricity sold to the utility in kWh. This option:
- Is set to ON by default
- Is available only for net billing customers
This illustration shows an example of the Energy Use tab in mobile format with no estimated reads:
Figure 2-10 Energy Use on Mobile
This illustration shows an example of the Energy Use tab in mobile format with estimated reads:
Figure 2-11 Energy Use Mobile with Estimated Reads
Buy All/Sell All
For customers on a Buy All/Sell All solar tariff, the Most Recent Bill section is replaced by the Bill Breakdown section, and includes:
- Date Range: The dates included in the billing period
- Energy Statement: The statement tells the user how much electricity they used and how much they produced. For example, "You used 940 kWh of electricity and produced 1,187 kWh of electricity."
- Details: Clicking the Details option displays the following:
- Electricity purchased from <UtilCo>
- Electricity sold to <UtilCo> for credits
- Rollover credit balance applied
- Electricity costs