Compare to Last Year View
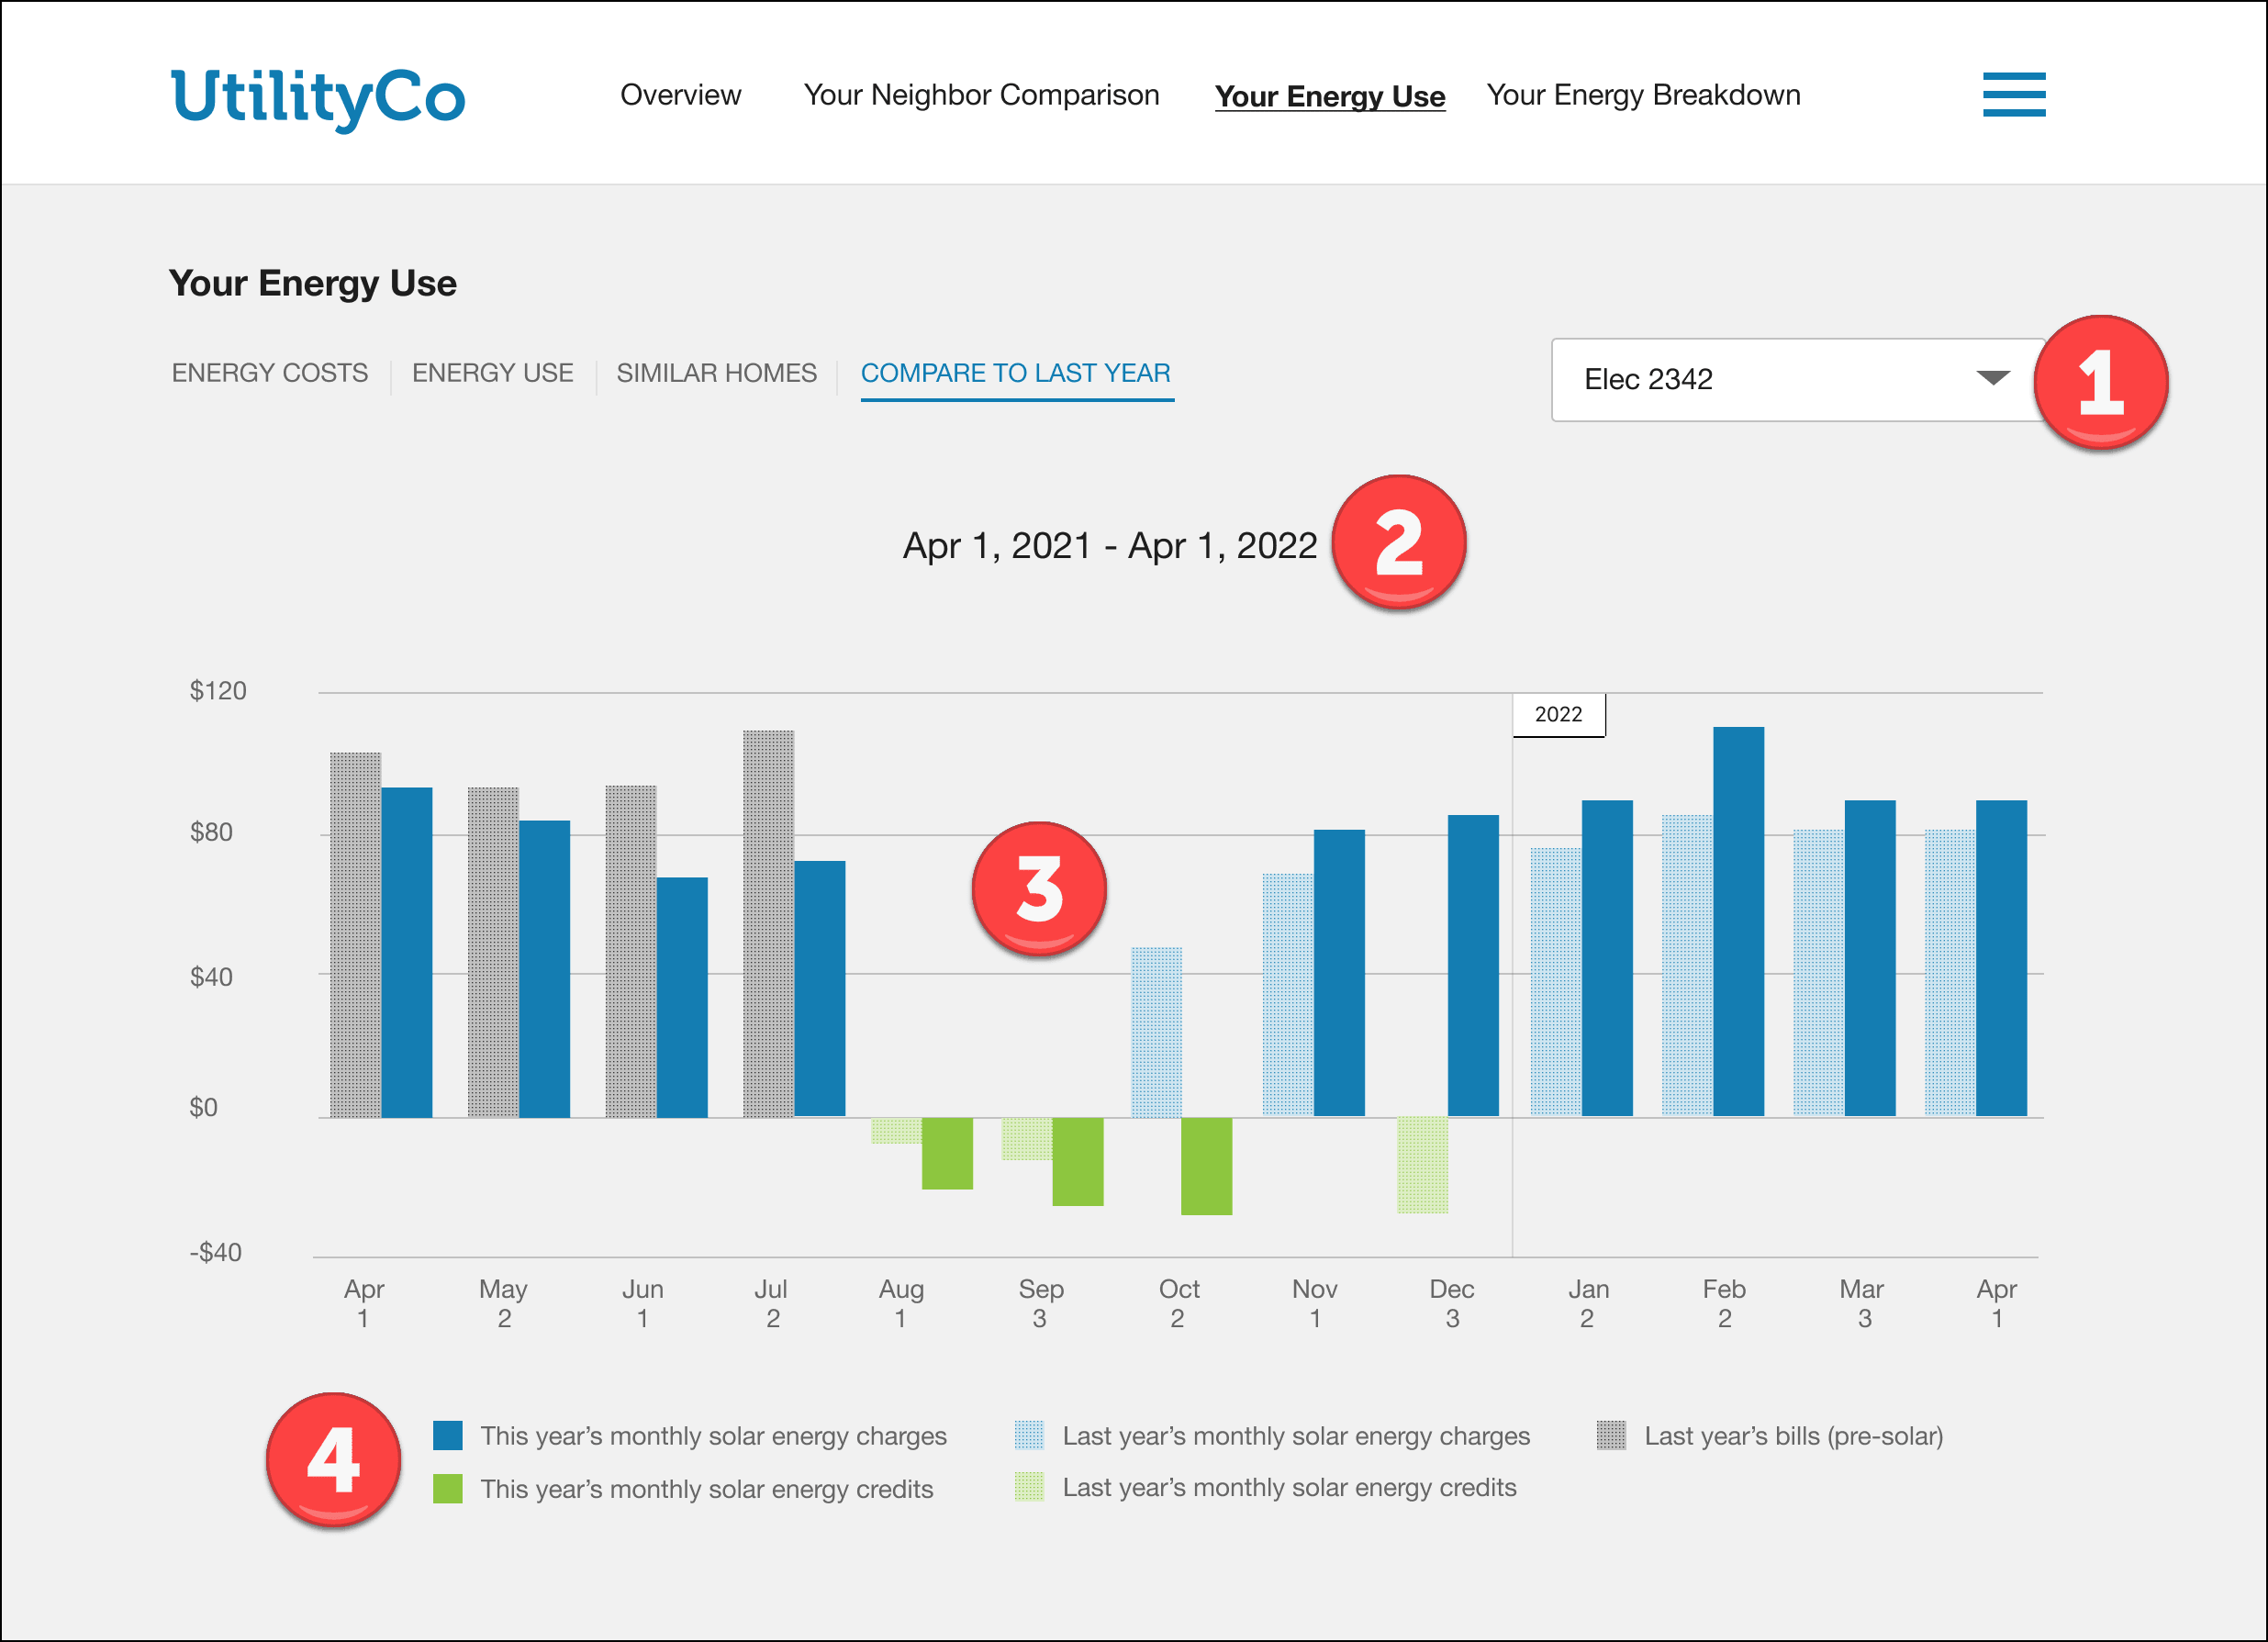
The Compare to Last Year view gives customers a graphical overview of their monthly costs for the current year and the previous year. This view is only available to solar customers, and the utility must have Digital Self-Service Energy Management Cloud Service and Distributed Energy Resources Customer Engagement Cloud Service for their solar customers to see it.
User Experience
The following image is an example of the Compare to Last Year view.
Figure 3-12 Compare to Last Year

The Compare to Last Year view includes the following components:
- (1) Account Selector: If a customer has multiple accounts, this drop-down list allows them to select the account they want to view. If a customer selects a non-solar account from the drop-down while in the Compare to Last Year view, they will be taken to their default view (Energy Costs or Energy Use view).
- (2) Date Range: The dates above the chart represent the current 12 to 13-month period. The number of months depends on how many months are configured to be shown in Data Browser.
- Disclaimer Statement (not pictured): Customers may see one of the following disclaimers under the date range:
- No data from previous year is available: This message appears if the customer was not a customer last year.
- Partial data from previous year is available: This message appears when only partial data from the previous year is available.
- (3) Cost chart: This chart includes multiple bars that help customers compare their solar cost for this year to their solar costs from last year. The bar colors on the chart represent the following:
- Blue: Solar charges for this year.
- Pixelated Blue: Solar charges from last year.
- Green: Solar credits for this year.
- Pixelated Green: Solar credits from last year.
- Gray: The customer's pre-solar bills from this year.
- Pixelated Gray: The customer's pre-solar bills from last year.
- Tooltips (not pictured): When you hover your cursor over a bar on the chart, a tooltip appears. Tooltips provide additional information about the selected bar, including the month, day, and the year the bar represents compared to the same time last year. For example, Jun 1, 2021 versus Jun 1, 2022. The tooltip also displays the cost and usage for that time period in dollar amounts and kilowatt hours. Customers may also see one of the following messages on the tooltip:
- The bill was estimated: See Energy Tool Tips in the Digital Self Service Overview for more information about bill estimates.
- No data from previous year is available: This message appears if the customer was not a customer last year.
- Partial data from previous year is available: This message appears when only partial data from the previous year is available.
- (4) Legend: The legend appears below the chart and describes what each bar color represents.
User Experience Variations
This section discusses how the experience can vary.
Tooltip Variations
Solar customers using the Compare to Last Year view may see one or more of the following message variations on the tooltip when hovering their cursor over a bar on the chart.
- The bill was estimated: See DSS EM Data Browser for more information about bill estimates.
- No data from X is available: This message appears when only partial data from the previous year is available.
- No data from previous year is available: This message appears if the customer was not a customer last year.
Variations by Solar Tariff Type
| Solar Tariff Type | Variation |
|---|---|
| Net Metering |
Monthly Billing Customers: Net Metering customers with monthly billing will see the last 12 to 13 bill periods compared to the bill periods one year prior to each billing period. Annual Billing Customers: Net Metering customers with annual billing will see that the X-axis and This Year's Bills will match the X-axis and This Year's Bills displayed in the Energy Cost Year view. Therefore, a customer who is only six months into their billing year will only see six months of bills from this year and all bills from the prior year. |
| Net Billing | Net Billing customers will see the last 12 to 13 bill periods compared to the bill periods one year prior to each billing period |