Solar Welcome Experience
Solar customers who navigate to the Electricity view in the Digital Self Service - Energy Management Data Browser for the first time after their solar panels become operational, are shown the Solar Welcome Experience. This feature details solar information in a simplified format that customers can easily understand. Customers will see a Solar Billing Overview and an Energy or Electricity Use Overview that shows them how to properly read positive and negative consumption data, and how to interpret complex solar bills.
On subsequent visits to the Electricity view, the Solar Welcome Experience is not displayed, but is accessible by clicking Learn How Solar Billing Works at the bottom of the page.
User Experience
This section discusses the user experience for the Solar Billing Overview and the Energy/Electricity Use Overview.
Solar Billing Overview
The Solar Billing Overview section of the Solar Welcome Experience explains how solar bills are calculated and provides solar customers with information about what they can expect to pay for electricity. The experience varies for Net Metering monthly and annual customers, and Net Billing customers.
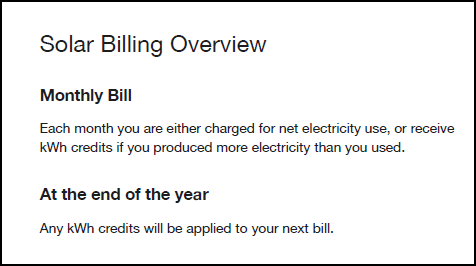
The Solar Billing Overview section of the Solar Welcome Experience for Net Metering monthly billing customers includes the following components:
- Monthly Bill Statement: This statement tells the customer that each month they are charged for electricity they use or receive credits if they produce more electricity than they use.
- At the End of the Year Statement: This statement explains what happens to any remaining solar credits at the end of the year.
The follow image is an example of the Solar Billing Overview for Net Metering monthly billing customers.
Figure 3-1 Solar Billing Overview

Energy/Electricity Use Overview
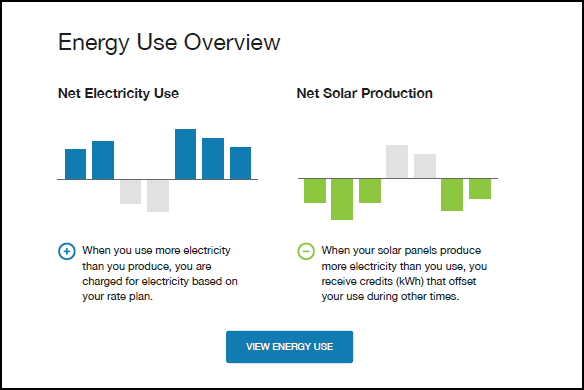
The Energy Use Overview section shows the customer the differences between Net Energy Use and Net Solar Production. The Energy Use Overview includes the following components:
- Net Electricity Use Graph: This bar graph shows an example of how net electricity usage is displayed for solar customers.
- Net Electricity Use Insight Statement: The statement below the graph explains how the graph displays positive and negative net energy usage.
- Net Solar Production Graph: This bar graph shows an example of how net solar production is displayed for solar customers.
- Net Solar Production Insight Statement: The statement below the graph explains how the graph displays net solar production.
- View Energy Use Button: For monthly customers, this button opens the monthly Billing Insight, and for annual billing customers, it opens the annual Billing Insight.
The following image is an example of the Energy Use Overview for Net Metering customers.
Figure 3-2 Energy Use Overview

User Experience Variations
This section discusses how the experience can vary.
Solar Billing Overview for Net Metering Annual Billing Customers
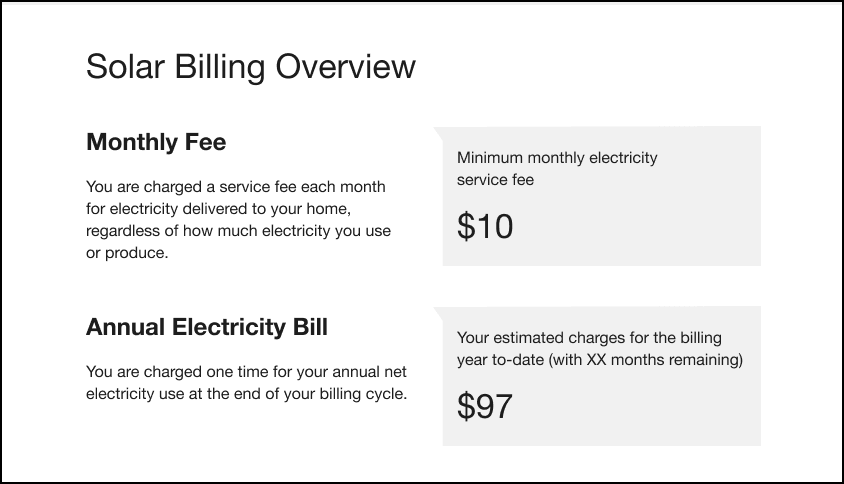
The Solar Billing Overview section of the Solar Welcome Experience for Net Metering annual billing customers includes the following components:
- Monthly Fee Statement: This statement explains how an annual solar customer's monthly solar fees are calculated.
- Monthly Fee Box: This box appears next to the Monthly Fee statement and shows customers their expected minimum service fee.
- Annual Electricity Bill Statement: This statement explains how the annual billing cycle works.
- Estimated Annual Charges Box: This box appears next to the Annual Electricity Bill statement and shows customers the remaining number of months and their estimated charges to-date in the current billing cycle.
The following image is an example of the Solar Billing Overview for Net Metering annual billing customers.
Figure 3-3 Solar Billing Overview for Net Metering Annual Billing Customers

Solar Billing Overview for Net Billing Customers
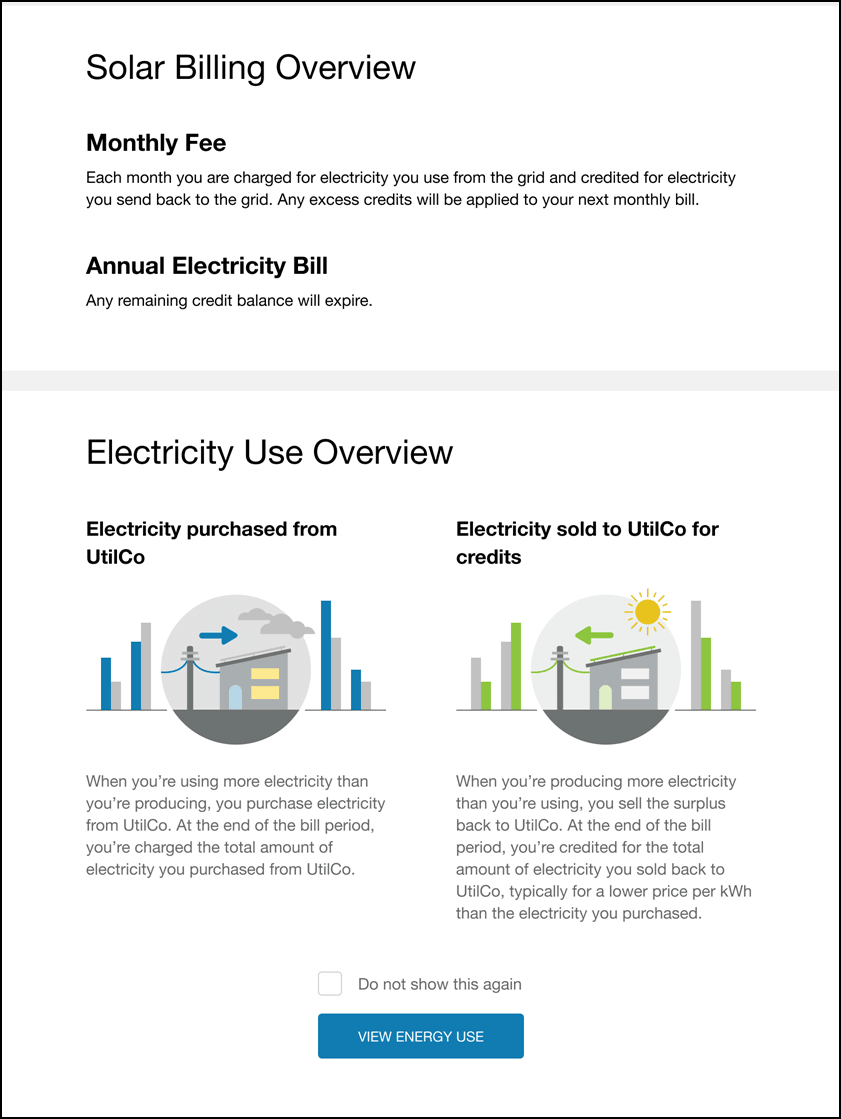
Net Billing customers will see a Monthly Fee statement and an Annual Electricity Bill statement.
- Monthly Fee Statement: This statement explains that Net Billing customers are charged based on the amount of electricity they use and send back to the grid.
- Annual Electricity Bill: This statement explains what happens to the remaining credit balance.
Electricity Use Overview for Net Billing Customers
Net Billing customers will see an Electricity Use Overview instead of an Energy Use Overview.
- Electricity Purchase Statement: This statement describes what happens when customers are using more than they are producing.
- Electricity Sold Statement: This statement describes what happens when customers are producing more than they are using.
- Do Not Show This Again Checkbox: When a customer selects this box, the Welcome Experience will not show when they open Data Browser. If this box is left unchecked, this pop-up will only appear when the customer has not visited the page in at least 90 days.
- View Energy Use Button: This button closes the pop-up box and shows the Data Browser.
The following image is an example of the Solar Billing Overview and the Electricity Use Overview for Net Billing customers.
Figure 3-4 Solar Billing Overview and Electricity Overview for Net Billing Customers

Welcome Experience After Initial Access (Net Metering and Net Billing Customers)
After a customer accesses the Welcome Experience the first time, they can get to the information again by clicking Learn How Solar Billing Works below the Data Browser chart. Clicking this option expands the Welcome Experience below the chart, but it is hidden for non-solar customers. For customers who use Green Button, the Welcome Experience is collapsed by default and located on the same line with the Green Button widget. When users click the option, the Green Button widget is hidden, and when the Green Button widget is expanded, the Welcome Experience is hidden.
Buy All/Sell All
For customers on a Buy All/Sell All solar tariff, the Solar Billing Overview varies as follows:
- Monthly Billing Statement: The statement is updated to read "Each month you are charged for electricity usage and credited for solar production. Any excess credits will be applied to your next monthly bill."
- End of Year Statement: The statement is updated to read "At the end of the year, any remaining credit balance will expire."
The Energy/Electricity Use Overview varies as follows:
- Net Electricity Use Title and Graph: The title is changed to "Electricity purchased from <Util Co.>" and the graph image is replaced by an image that shows a power strip on top of a graph.
- Net Electricity Use Insight Statement: The statement is replaced with a Buy All/Sell All statement, which reads "You are charged for the amount of energy that your home uses, regardless of whether it came from the grid or your solar panels. This is the same amount you would be paying if you didn't have solar panels."
- Net Solar Production Title and Graph: The title is changed to "Electricity sold to <Util Co.> for credits" and the graph image is replaced by an image of a solar panel and sun on top of a graph.
- Net Solar Production Insight Statement: The statement is replaced with a Buy All/Sell All statement, which reads "You are credited for the amount of energy that your solar panels produce, regardless of whether it is used by your home or sent back to the grid.