What Uses Most
The What Uses Most module educates customers about the top three energy uses in their home for the report period. One of the customer's top energy uses is highlighted at the top of the module and is followed by a related energy-saving tip. Highlighted energy uses must meet one of the following criteria:
- It is the customer’s highest energy use.
- It is the customer’s second-highest energy use.
- The energy use for that category is significantly above the regional average.
Appears in: Limited Income Report, Electric Vehicle Report
Note: While this module was designed for the limited-income customer experience, it can be used for other audience segments as well. Contact your Delivery Team to discuss the options.
On this page:
Requirements
Utility Requirements
|
Category |
Description |
|---|---|
|
Required Cloud Service |
Oracle Utilities Opower Energy Efficiency Cloud Service |
|
Scale |
Not applicable. |
Customer Requirements
|
Category |
Description |
|---|---|
|
Billing Frequency |
Monthly, bi-monthly, or quarterly. |
|
Data Delivery Frequency |
Monthly, bi-monthly, or quarterly. |
|
Data Requirements |
|
|
Data History |
A minimum of six bills is required for non-AMI customers. A minimum of 60 days of AMI reads for AMI customers. |
|
Data Coverage |
Not applicable. |
|
Supported Fuels |
Electricity-only, gas-only, dual fuel. |
User Experience
This section describes the user experience for the What Uses Most module. The module varies by usage factors. The image below is an example of the module for a customer with heating as the highest energy use in the billing period.
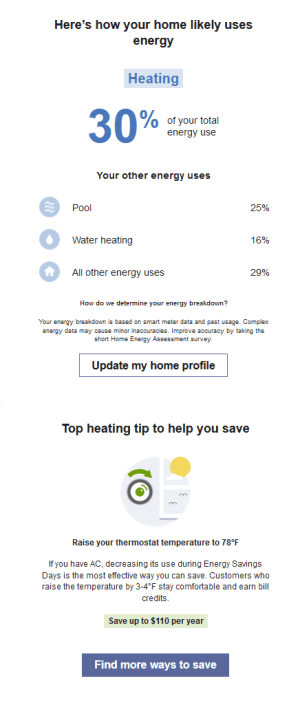
What Uses Most: The top portion of the module educates customers about the top four energy uses in their home for the report period. The value for each category is an estimate based on the customer's past energy use, weather patterns, and home characteristics.
-
Heading: The heading identifies the energy use state of the highlighted energy category and emphasizes that the top category is an estimate.
- Usage Categories: Usage categories are dynamic and vary based on the customer's past energy use, weather patterns, home characteristics, and available smart meter data. These usage categories help customers know where to focus and save.
- Highlighted Category: A rotating set of algorithms select the customer's top uses to highlight in each report. The highlight category appears in a blue box at the top of the module, followed by the percent of energy used by that category.
- Energy Breakdown Subheader: The subheading prepares the customer to learn about their other top energy uses.
- Usage Categories: An additional two energy use categories and their energy use percentages are listed. The categories are ordered from highest to lowest. A final "All other energy uses" category presents what percentage of the customer's energy use was made up of any remaining consumption. It is represented by a home icon.
-
Disaggregation Header and Explainer and Text: An explanatory note that clarifies that these categorizations are derived from data science model estimates, and reminds customers that they can improve their report accuracy by completing their Home Energy Analysis.
-
Update Home Profile Button: The button redirects customers to the Home Energy Analysis where they can provide more details about their home to improve their report accuracy.
Paired Tip: The What Uses Most disaggregation is immediately followed by an energy-saving tip related to the energy use highlighted in the module. For example, if a customer has indicated in the Home Energy Analysis that they use a heat pump for cooling, an associated heat pump tip and cooling tip are shown. This ensures that the tip information is tailored to the customer's uses in their home. See Paired Tips.
User Experience Variations
The user experience of the feature may vary for customers and utilities depending on their service types, available data, costs, locale, and other factors.
Highlighted Usage Category
The highlighted usage category heading varies depending on the highlighted category and module state (highest energy use, second highest energy use, most above regional average). The following table includes examples of the possible heading variations for heating as the highlighted category.
| Highlighted category | Module State - Highest energy use | Module State - Second highest energy use | Module State - Most above regional average |
|---|---|---|---|
| Heating | Here's how your home likely uses energy | Your heating was likely a top energy use | Your heating use was likely above the regional average |
Electric Vehicle Report
Electric Vehicle Charging is one of the possible energy use categories for electric vehicle customers.
If Electric Vehicle Charging is the customer's top energy category, a green leaf icon appears next to the top use category heading with a encouraging “smart, green choice” message below. The message is designed to positively reinforce the customer's decision, and ensure that they feel good about their environmentally friendly choices even when it may take up a significant portion of their energy use.
Heat Pump Usage
If the customer has reported using a heat pump for heating or cooling in the Home Energy Analysis, the module varies in the following ways:
Top Use Category: If a heat pump used for cooling or heating is the customer's top use category, the top usage category appears as "Heat Pump." A green leaf icon appears next to the top use category heading with a encouraging “smart, green choice” message below. The message is designed to positively reinforce the customer's decision, and ensure that they feel good about their environmentally friendly choices even when it may take up a significant portion of their energy use.
Usage Category: If a heat pump used for cooling or heating appears in the use category list the usage category for cooling or heating appears as "Heat Pump" in the usage category list along with a heat pump icon.
Calculations
Energy Use Categories
The energy use category calculation varies depending on whether or not the customer has a smart meter.
Customer does not have smart meter or reliable smart meter data is not available: The categories are calculated using a combination of weather data and the customer's historical usage data to get an idea of how energy is being used in their home over time, as well the Home Energy Analysis survey responses that are personalized to their home. With this information, our data science models can create an estimated breakdown of their usage by category or appliance so that you know where to focus and save.
Customer has a smart meter: We use data from your their smart meter, which records their energy use throughout the day, to detect certain appliance usage patterns and get an idea of how energy is being used in their home.
For example, it is common for a refrigerator to cycle on every 15-20 minutes to reach the desired temperature and then turn off. Our data science models can spot patterns like this from a refrigerator and other common appliances to determine which appliances are being used and when to help estimate per-appliance usage in the home. We then provide an estimated breakdown of their usage by appliance so that the customer knows where to focus and save.