Cooling Analysis Pie Chart
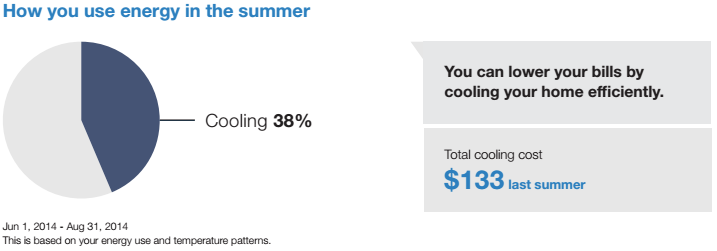
The Cooling Analysis Pie Chart displays the customer's estimated cooling usage last season as a percentage of their total energy consumption. Its purpose is to help customers better understand how they use energy during the cooling season. A brief message indicates their estimated cooling costs. If the customer used less than $10 in cooling last summer or does not have any costs associated with their usage reads from the previous summer, the total cooling cost will not be shown.

Pie Chart: The pie chart highlights the estimated proportion of the customer's total energy consumption that is attributed to cooling during the past summer. The definition of which months fall in the season are configured for each utility. The default threshold for the cooling percentage is 5%. The module will not display if this threshold is not met.
Insight: The pie chart is paired with an energy efficiency insight and a cost insight.
- Energy Efficiency Insight: All customers receive an energy efficiency insight, which says that they can lower their bills by cooling their home more efficiently.
- Cost Insight: If a customer's total estimated cooling costs are more than $10, they will also see the estimated amount of money they spent on cooling last summer. However, if this $10 threshold is not met, the cost insight from last summer will be hidden.
Comparison Information: This section appears below the bar chart and identifies the date range of the data. There is also a brief statement to indicate what data is used to generate the insights, and to assure customers that the information is fair and reliable.
Fuel: Electric-only and dual fuel
AMI Data Required: No
Data History:
- At least 12 bills in last 18 months or at least 6 bills with positive Cooling Degree Days and 6 bills with negative Heating Degree Days.
- Usage data from last summer
Billing Frequency: Monthly or bi-monthly