Explainer
The Explainer module tells the customer what data is used to calculate the Normative Comparison module and provides ways to improve or correct the data used in the module by completing or updating the Digital Self Service - Energy Management Home Energy Analysis. The module includes a brief explanation of how the comparison is calculated, as well as URL and QR code options to go from their paper report to the Home Energy Analysis. The goal of this module is to reduce negative customer sentiment by providing transparency around the similar home comparison and offering a simple and quick way for customers to update their information if it is not accurate.
Appears in: Progress Report, Limited Income Report, Time of Use Report, Solar Report, Electric Vehicle Report, Peak Focused Report
On this page:
Requirements
Utility Requirements
|
Category |
Description |
|---|---|
|
Required Cloud Service |
Oracle Utilities Opower Energy Efficiency Cloud Service |
|
Scale |
Not applicable. |
Customer Requirements
|
Category |
Description |
|---|---|
|
Billing Frequency |
Monthly, bi-monthly, or quarterly |
|
Data Delivery Frequency |
Daily, monthly, bi-monthly, or quarterly. |
|
Data Requirements |
A minimum of one historical bill. |
|
Data History |
A minimum of one historical bill. |
|
Data Coverage |
All billing and data delivery frequencies are supported. |
|
Supported Fuels |
|
Limitations
-
Module replacement: To ensure clear messaging, an additional promotion module should not be run in place of this module.
User Experience
This section describes the user experience for each report type.
Progress Report, Limited Income Report, Time of Use Report, and Peak Focused Report
This image is an example of the Explainer module's design for the Progress Report, Limited Income Report, Time of Use Report, and Peak Focused Report.
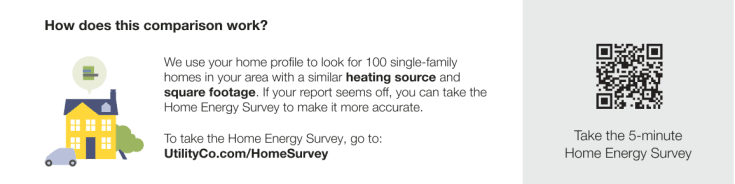
Header: The header is intended to either notify the customer that they can learn more about how their comparison is determined or notify them that their comparison is accurate as a result of their completing the Home Energy Analysis.
Body Text: The body text explains that the customer's home profile is used to identify similar homes of roughly the same square footage and with the same heating fuel type within a set distance. The number of homes, home type, location radius, and heating source information is all dynamic and varies by customer. The utility may choose to show less criteria, however, at least one must be included.
Call to Action: Customers are provided with two convenient ways to update the home profile:
Link: A link located below the body text that redirects the user to the Digital Self Service - Energy Management web portal, where they can sign in and complete the Home Energy Analysis.
QR Code: The QR code prompt encourages customers to take a five-minute home energy survey. Customers can scan their unique code with their phone and immediately transition from their paper report to either the authenticated or unauthenticated landing page, depending on which one is set up for the utility.
Solar Report
Solar Welcome Report
This image is an example of the Net Explainer module for a Solar Report of a customer with dual fuel and a positive comparison state.
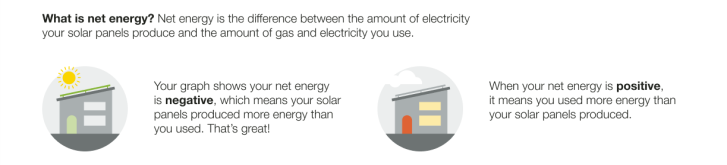
Header: The header defines net energy.
Explainer :The explainer reinforce the insights shown in the report's three-bar neighbor comparison. The text varies based on the customer's comparison state and fuel type.
Image: The left image matches the customer's current net negative or net positive state. The right image of the opposite opposite state. The image is designed to reinforce the explainer definition state. For example, a house with a red door is paired with the positive next energy positive explainer to indicate that more energy is used than the solar panels produced. An image of sun shining over a house with a green door and roof line is paired with the negative net energy explainer to reinforce that in a negative net energy state the solar panels produce more energy than the customer used.
Solar Progress Report
This image is an example of the Explainer module for the Solar Progress Report of a customer with an incomplete Home Energy Analysis.
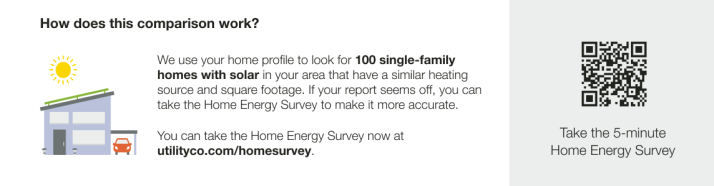
Body Text: The body text explains that the customer's home profile is used to identify similar solar homes of roughly the same square footage and with the same heating fuel type within a set distance. The number of homes, home type, location radius, and heating source information is all dynamic and varies by customer.
Image: The image reinforces that the customer's insights take into account their solar energy use.
Call to Action: Customers are provided with two convenient ways to update the home profile:
- Link: A link located below the body text that redirects the user to the Digital Self Service - Energy Management web portal, where they can sign in and complete the Home Energy Analysis.
- QR Code: The QR code prompt encourages customers to take a five-minute home energy survey. Customers can scan their unique code with their phone and immediately transition from their paper report to either the authenticated or unauthenticated landing page, depending on which one is set up for the utility.
Electric Vehicle Report
The Electric Vehicle Report explainer module is designed to help educate the customer about how their home energy use and home characteristics contribute to their comparison. The module header, body text, and call to action vary depending on whether or not the customer has completed their Home Energy Analysis.
This image is an example the module in the Electric Vehicle report of a customer who has not yet completed their Home Energy Analysis.
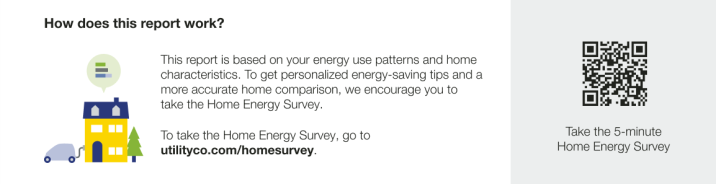
Header: The header notifies the customer that they can learn more about how their report works.
Body Text: The body text explains that the report uses the customer's energy use patterns and home characteristics to generate insights, and encourages them to complete the Home Energy Analysis for more a more accurate comparison.
Image: The image of an electric vehicle charging at home is used to visually reinforce that the customer's electric vehicle charging is taken into account in the report comparison and insights.
Call to Action: Customers are provided with two convenient ways to update the home profile:
- Link: A link located below the body text that redirects the user to the Digital Self Service - Energy Management web portal, where they can sign in and complete the Home Energy Analysis.
- QR Code: The QR code prompt encourages customers to take a five-minute home energy survey. Customers can scan their unique code with their phone and immediately transition from their paper report to either the authenticated or unauthenticated landing page, depending on which one is set up for the utility.