Heating Analysis Pie Chart
The Heating Analysis Pie Chart displays the customer's estimated heating-related energy consumption from last season as a percentage of their total energy consumption. It is paired with a brief message that indicates their estimated heating costs. The goal of this module is to help customers better understand how they use energy during the hearing season.
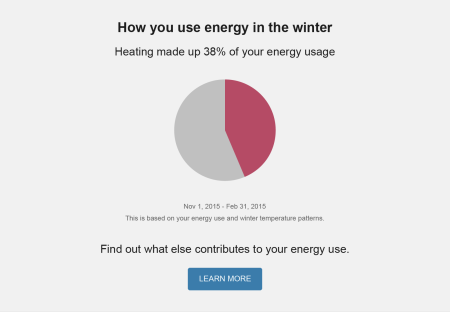
Title: The title focuses on heating-related energy use in the winter season.
Pie Chart: The pie chart highlights the estimated proportion of the customer's total energy consumption that is attributed to heating during the past winter.
Insight: The pie chart is paired with an insight that may consist of two parts: an energy efficiency insight and a cost insight.
Energy Efficiency Insight: All customers receive an energy efficiency insight, which say that they can lower their bills by heating their home more efficiently.
Cost Insight : If a customer's total estimated heating costs are more than $10, they will see an estimated amount of money they spent on heating last winter. This insight will not be displayed if the $10 threshold is not met.
Heating % Insight: The default threshold for the heating percentage is 10%. The module will not display if this threshold is not met.
Comparison Information: This section appears below the bar chart and identifies the date range of the data. There is also a brief statement to indicate that the data is based on the customer's energy use patterns, as well as local weather patterns.
Learn More / Call to Action: Customer can click Learn More to view their Home Energy Analysis in the Oracle Utilities web portal.
Requirements and Limitations
Fuel Type: Electric-only, gas-only, and dual fuel.
AMI Data Required: N/A.
Data History: At least 12 bills in the last 18 months or at least six bills
Billing Frequency: Monthly, bimonthly.