Neighbor Comparison
The Neighbor Comparison compares the customer (“You”) to two groups: “Efficient Neighbors” and “All Neighbors.” The results are displayed in a horizontal bar graph. A summary statement indicates how the customer compares to their efficient neighbors, and an evaluative statement is highlighted to indicate if the customer is doing "Good," "Great," or is "Using more than average" compared to their efficient neighbors. "Efficient Neighbors" are defined as the most efficient 20% of the customer's neighbors. The comparison is designed to motivate customers to save energy based on how they see themselves in relation to their neighbors.
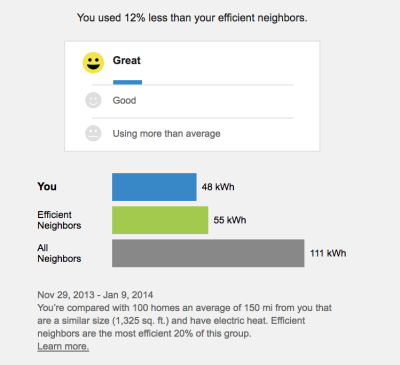
- Normative Message / Insight Statement: The normative message appears above the chart and provides an insight ("You used 18% more than your neighbors") about why the bar chart appears the way it does. Specifically, it displays a percentage for (a) how much more or less the customer used compared to their "efficient neighbors" or (b) how much more or less the customer used compared to "neighbors" (i.e., all neighbors, including efficient neighbors). The wording of the statement itself varies depending on several factors.
- How You're Doing: This graphic highlights whether the customer is doing "Great," "Good," or "Using more than average" compared to All Neighbors or Efficient Neighbors.
- Bar Chart: The bar chart displays how much energy each group in the comparison used. The energy units displayed in the chart are based on the customer's fuel type. For example, kWh is shown for single fuel electric customers, and therms or CCfs are used for single fuel gas customers. For duel fuel customers, the term "units" is used, since electricity and natural gas usage are combined into a single measurement.
- You: This bar indicates how the customer is doing.
- All Neighbors: This bar indicates how all the customer's neighbors are doing.
- Efficient Neighbors: This bar displays a usage value for the most efficient 20% of the customer's neighbors. The efficient neighbors value that appears in the module is not an average of the top 20% of neighbors. A threshold value—the 20th percentile neighbor—is used to determine the efficient neighbors value.
- Dynamic Neighbor Description: The dynamic neighbor description summarizes the characteristics of the neighbors that the customer is compared to. This information helps assure customers that the comparison is fair and accurate. The description may include one or more of the following:
- Number of neighbors: The number of other homes that the customer is compared to.
- Proximity: The geographic proximity of the neighbor's homes rounded to the nearest whole unit.
- Home Size: The average home square footage among neighbors.
- Heat Type: The heating type of the neighbors, such as gas or electric heating.
Requirements and Limitations
Fuel: Electric, gas, and dual fuel.
AMI Data Required: N/A.
Data History: A minimum of one historical bill.
Billing Frequency: Monthly, bi-monthly, quarterly.