Neighbor Trend
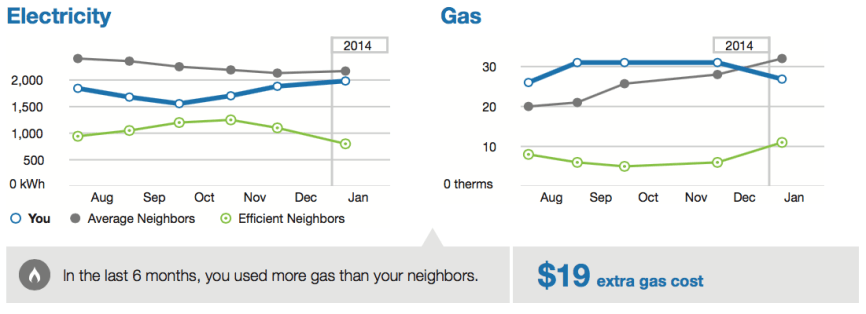
The Neighbor Trend compares the customer (“You”) to two groups: “Efficient Neighbors” and “Average Neighbors.” The module displays data from up to a maximum of six historical bills on a line graph, with one line each for “You,” “Efficient Neighbors,” and “Average Neighbors.” An evaluative statement compares the customer to one of the other neighbor groups for the period displayed in the chart. If the customer does not have any cost data for the period covered by the module, the normative message focuses on differences in usage instead of cost.

Line Chart: The line chart plots the customer's energy use data points and those of their neighbors on an x- and y-axis. The colors of the lines match the colors of the bars in the Neighbor Comparison module. The information is broken down into months instead of billing periods because customers are more accustomed to thinking of their usage in terms of calendar months. A maximum of six bills or 12 months of data is shown in the chart, regardless of frequency (monthly, bi-monthly, or quarterly).
Normative Message / Insight Statement: The normative message has a performance message and a percentage difference message.
- Performance Message: The performance message (for example, "In the last 6 months, you used less than your efficient neighbors") indicates whether the customer is using more or less electricity compared to their neighbors.
- Percentage Difference Message: The percentage difference message (for example, "X% less electricity" or "X% more electricity") indicates how much more or less electricity the customer used, depending on how well they are doing compared to the two neighbor groups.
Variations: For gas-only customers, the electricity unit “kWh” is replaced by “therms” for gas-only customers. For dual fuel customers, two line charts (one for electricity and one for gas) are displayed in the module side by side. The information displayed in these charts is similar to the information displayed for single fuel customers. The evaluative statement appears at the bottom of the module instead of to the right as in the single fuel modules.
Fuel: Electric-only, gas-only, and dual fuel
AMI Data Required: No
Data History: A minimum of three historical bills
Billing Frequency: Monthly, bi-monthly, or quarterly