Target Rank Graph
The Target Rank Graph module is designed to encourage consistently high users to improve their target ranking by showing customers how their energy use is ranked compared to 100 of their similar neighbors. The Target Rank Graph is comprised of a horizontal bar graph that charts the customer's energy use for the current billing period and shows how they rank compared to similar neighbors, a description of how the customer's neighbors were chosen for the comparison, and a View Home Energy Use button that customers can click to explore their energy use in the Oracle Utilities Opower Data Browser.
Note: This module is only available as part of the Target Rank Edition.
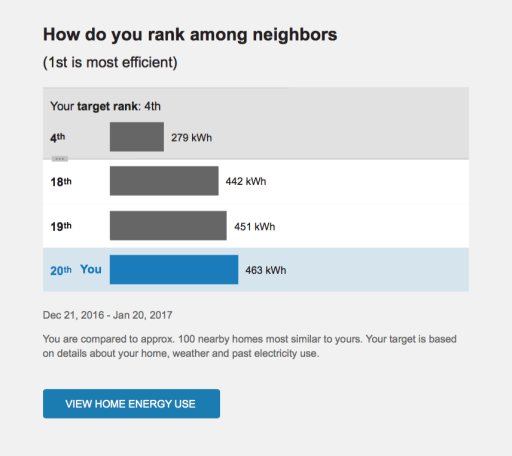
Heading: By default, the heading is "How do you rank among neighbors"
Graph: A horizontal bar graph charts the customer's energy use on the current billing period and shows how they rank compared to their similar neighbors.
Date Range: A date range below the graph displays the current billing period.
Neighbor Comparison Description: A neighbor comparison description appears below the graph. It describes how the customer's neighbors were chosen for comparison.
View Home Energy Use: Customers can click the button at the bottom of the module to explore their energy use in the Data Browser in their web portal account.
Limitations and Requirements
Fuel: Gas-only, electric-only.
AMI Data Required: N/A.
Data History: 12 months of historical billing data.
Billing Frequency: Monthly or bimonthly.