Data Browser
The Data Browser is an interactive tool that allows customers to visualize and explore their energy use trends and costs, and make comparisons to useful benchmarks, such as weather and similar homes. One or more views for Energy Costs, Energy Use, and Neighbors are available in the feature. If applicable, customers can also use menus to switch between multiple accounts or service points.
On this page:
Requirements
Utility Requirements
Customer Requirements
|
Category |
Description |
|---|---|
|
Billing Frequency |
Monthly, bi-monthly, and quarterly. |
|
Data Delivery Frequency |
Monthly, bi-monthly, and quarterly. |
|
Data Requirements |
Billing Data: Customers must have a minimum of one historical bill to view data in the Year view. Weather Data: Weather data is required for the weather line graph to display. If the Oracle Utilities Opower Premise Data Transfer specification is being used, then the AMI Data: The Digital Self Service - Energy Management AMI cloud service must be purchased for daily or subdaily energy use AMI data and insights to display. A minimum of one historical bill with at least one day of historical AMI data is required to view such data. Rates Data: Additional data requirements may apply for other "views" and features of Data Browser. See User Experience below for more details about each view. |
|
Data History |
A minimum of one historical bill is required for data to display in the Year view. For AMI customers, a minimum of one historical bill which includes at least one day of historical AMI data is required for the Bill view and Day view. |
|
Data Coverage |
Not applicable. By default, all graphs and views of the Data Browser display any data that is available, even if some reads are missing. |
|
Supported Fuels |
Electricity, gas, and dual fuel. Customers with two fuels can switch between electricity and natural gas views. A combined view, which combines electricity and natural gas use, can also be enabled. |
Limitations
- Taxes and Fees Limitation: The amounts shown for energy use typically do not include taxes or fees, so they will not match the customer's bill. However, with additional setup and configuration, the costs can be made to match a customer's bill.
- Responsive Display: Daily energy use can be displayed in 15 or 30-minute intervals for all customers with sub-hourly read data. When viewed on smaller screens such as for mobile devices, the responsive design displays hourly intervals to account for reduced screen space.
User Experience
The Data Browser is an interactive visualization tool that allows customers to analyze their energy use trends by fuel type, time period, and a series of other views. Customers can hover over or select a data point in the Data Browser to see a tooltip containing more information about it. The major views available are:
- Energy Costs View: The cost of energy usage over time, alongside factors such as a weather and solar power (if applicable).
- Energy Use View: The amount of energy usage over time, alongside factors such as a weather and solar power (if applicable).
- Neighbors View: The amount of energy use compared between the customer and their neighbors.
The image below is an example of the Energy Use view.
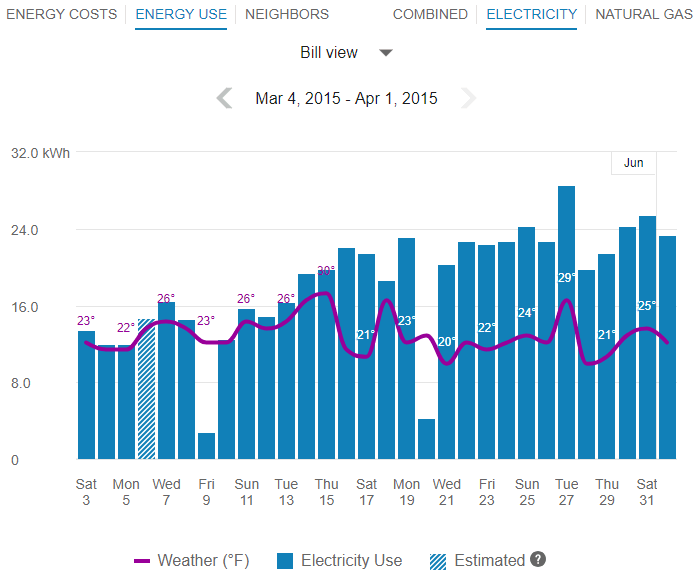
For more information on how the feature behaves and displays data, see General Display Rules below. Some insights may not be available depending on data availability and the customer's fuel type.
General Display Rules
The Data Browser follows some general rules regarding when and how to display data. These rules vary depending on the view.
Year View
Rules for the Year view include:
- For all major views (Energy Costs, Energy Use, and so on), the Year view will always display any available data, even if some data is missing. For example, if 12 out of 13 months are missing data, the Data Browser will still show data for the one month that is available.
- Energy use and cost data for a bill must be sent to Oracle Utilities Opower for the same billing period. For example, if a customer has quarterly bills, the utility cannot send monthly energy use data, and then later send the total cost of the customer's bill at the end of the quarter. Both the total usage and cost of the quarter must be sent together in order for it to display it in the Year view of the Data Browser.
- Data points are always shown for a full year plus one additional data point. This means that there are 13 data points for monthly billing, 7 data points for bi-monthly billing, and 5 data points for quarterly billing.
Bill View
Daily AMI data is required to display the Bill view. In general, the Bill view will display any available data, even if some data is missing. For example, if only four days of data are available, the Data Browser will still show data for those four days.
Day View
Subdaily AMI data is required to display the Day view. Data reads are shown by hour or by whatever time interval matches the customer's AMI meter. The supported intervals are 60-minute, 30-minute, and 15-minute.
For the Energy Costs and Energy Use graphs, the Day view will always display any available data, even if some data is missing. For example, if only five hours of data is available, data for those five hours will be shown. Since 24 hours in a day can be assumed, missing data is shown as gaps in the graph.
High and low temperatures are not displayed in the tooltips for the Day view. However, average hourly temperature data will be displayed if it is available.
X-Y Axis
The Data Browser displays data in the form of lines, bars, and data points along an X-Y axis. Customers can hover over a given data point for more information and see a tooltip containing standard details such as a date range, energy use amount, and other information depending on the view selected.
X-Axis
The labels on the X-axis of the graph represent an interval of time (months, days, or hours).
View | Display Rules |
|---|---|
Year view | The abbreviated month and final day for each bill is displayed. For example, if a customer is billed monthly on the 20th of every month, the label for September is Sep 20. This ensures that if more than one bill ends in a given month, each bill can be distinguished by the day information. Labels appear across the X-axis for every bill. Labels are hidden in a manner to ensure that labels do not overlap for reduced screen sizes. For example, labels can be displayed for every other bill when a browser window is reduced. |
Bill view | The abbreviated day of the week and numeric day for each daily read is displayed. Labels appear across the X-axis for every other day. Labels are hidden in a manner to ensure that labels do not overlap for reduced screen sizes. For example, labels can be displayed for every third bill when viewing area is reduced due to viewing the graph on a mobile device. |
Day view | Time of day intervals are displayed, such as 12am, 6am, 12pm, and so on. Labels appear across the X-axis for every six hours. Labels are hidden in a manner to ensure that labels do not overlap for reduced screen sizes. For example, labels can be displayed for every twelfth hour when viewing area is reduced due to viewing the graph on a mobile device. |
Y-Axis
The labels on the Y-axis of the graph represent an applicable unit of consumption, cost, or demand. The axis begins at 0 and displays increments up until an applicable maximum value that ensures all data can be shown.
Estimated Bills and Usage Reads
Utilities are sometimes unable to obtain billing reads or AMI usage reads for their customers, in which case such bills or reads may be estimated.
- Estimated Bills: An estimated bill is an approximate monetary amount that is calculated based on the energy that a customer has consumed in the past rather than the present billing period. Estimated billing reads are marked in the data file sent by the utility to Oracle Utilities Opower. Estimated bills are corrected the next time the customer's meter is read. Any extra costs they were charged will be adjusted in the following bill, ensuring that customers never pay for more energy than they actually used.
- Estimated AMI Reads: An estimated AMI read (that is, granular usage reads such as daily or subdaily reads) is an approximate usage amount that is calculated based on the energy that a customer that has consumed in the past rather than in the present billing period. Like estimated bills, estimated AMI reads are marked in the data file sent by the utility to Oracle Utilities Opower.
In the Data Browser, estimated bills or AMI reads are indicated by a tooltip message that displays when the customer hovers over an applicable data point. This message will appear if any bill or usage read shown in the Data Browser was estimated. For example, a single bill period could be estimated or a single day could contain three hourly reads which are estimated.

Note: Estimated bills and AMI reads are flagged separately in the data files sent by the utility to Oracle Utilities Opower. If a utility has not marked that a billing read was estimated, then no indication of an estimated bill will be displayed for any of the bill periods shown in the Year view of the Data Browser—even if one of the billing periods contains one or more daily estimated AMI reads.
Energy Tooltips
A tooltip is displayed when a customer interacts with a data point in the Data Browser. At minimum, the tooltip includes the time period covered and the amount of energy used by the customer. Other elements of a tooltip vary depending on which view of the Data Browser is selected and what data is available.


Time Period: The time period for the selected data point. The information shown varies slightly depending on the interval of time being viewed.
- Year View: The tooltip shows the month and date range of a bill period. Example: May 3, 2020 - June 1, 2020
- Bill View: The tooltip shows details about a day in a bill period. Example: Thurs, May 8, 2020
- Day View: The tooltip shows an hourly or sub-hourly interval in a bill period. Example: 9:00 - 10:00am
Energy Cost: The cost of energy for the selected fuel type and time period. Energy costs are shown on tooltips for the Energy Costs graph. Hyphens are displayed for any data that is missing. The cost amounts typically do not include taxes and fees, and so do not match a customer's bill. However, with additional setup and configuration, the costs can be made to match a customer's bill.
Energy Use: The energy used for the selected fuel type (kWh, therms, and so on) and time period. Hyphens are displayed for any data that is missing.
Energy Insight: In the Neighbors view, the energy tooltip provides insight into the customer's energy use for the applicable time period as compared to their neighbors. For example, the tooltip may show that a customer used more, less, or about the same as their neighbors.
Weather: The average temperature for the selected time period. Weather data is available in the Energy Costs and Energy Use views. High and low temperatures are also provided when using the Year view or Bill view.
Click Bar to View Each Day or Hour: For customers with AMI data, a message is displayed in tooltips in the year view and bill view, directing customers to more granular data. This message allows customers to quickly view data for the days in a bill period or the hours in a day.
Estimated Bills: Estimated bills are listed as estimates in a tooltip. When unusual circumstances prevent a utility from obtaining an actual billing read for a customer, it is sometimes necessary to calculate an estimate. See Estimated Bills and Usage Reads above for details.
Virtual Bills
A virtual bill shows a customer's daily energy use and energy costs up to the present day in the Data Browser, even though the bill period is not finished yet. This is accomplished by determining the maximum number of days to display along the horizontal axis in the Bill view. This feature requires AMI data.
A virtual bill is useful because it assumes an end date for an in-progress bill, and it therefore allows daily usage data to be displayed in the Data Browser before the bill period is finished. Because of virtual bills, customers can go to the Bill view and navigate past their most recent bill period to see their daily usage data up to the present day.
Solar Data
The Data Browser supports solar data by displaying a customer's net energy usage in a given interval of time on the horizontal axis. (This may also be referred to as net energy metering, or NEM.) For example, if a customer has solar power and generates more energy than they consume, the Data Browser will show the customer's energy use as a credit or as a negative value. This data can be configured to display in different ways for a utility. See the Energy Costs view and Energy Use view for details.
Weather Data
Any weather data displayed in the feature is based on the geolocation (latitude and longitude coordinates) of the customer. A weather service is used to select the closest weather station with weather data for the customer. This usually corresponds to the nearest airport station, usually within ~40 kilometers from the customer. Daily average temperatures are based on hourly temperatures.
Multiple Billing Accounts, Premises, Service Agreements, and Service Points
The experience with the Data Browser varies depending on how many billing accounts, premises, service agreements, and service points a customer has.
Note: The description below is meant to cover the most common scenario for utilities who send data to Oracle Utilities Opower using the core data transfer specifications. If you are not sure how you are sending data to Oracle Utilities Opower, contact your Delivery Team. There may be a different experience depending on several other factors, such as the use of the legacy billing data transfer specification, the specifics of your setup and configuration, and any data extract and transformation scenarios.
Multiple Billing Accounts
A customer may have one or more billing accounts, and each billing account may include one or more premises. In such cases, the utility typically has an account selector that allows customers to switch to a different billing account to view associated energy information.
Note: When a customer selects a billing account, the Data Browser refreshes and displays data for it. Data can only be displayed for one selected billing account at a time.
Multiple Premises
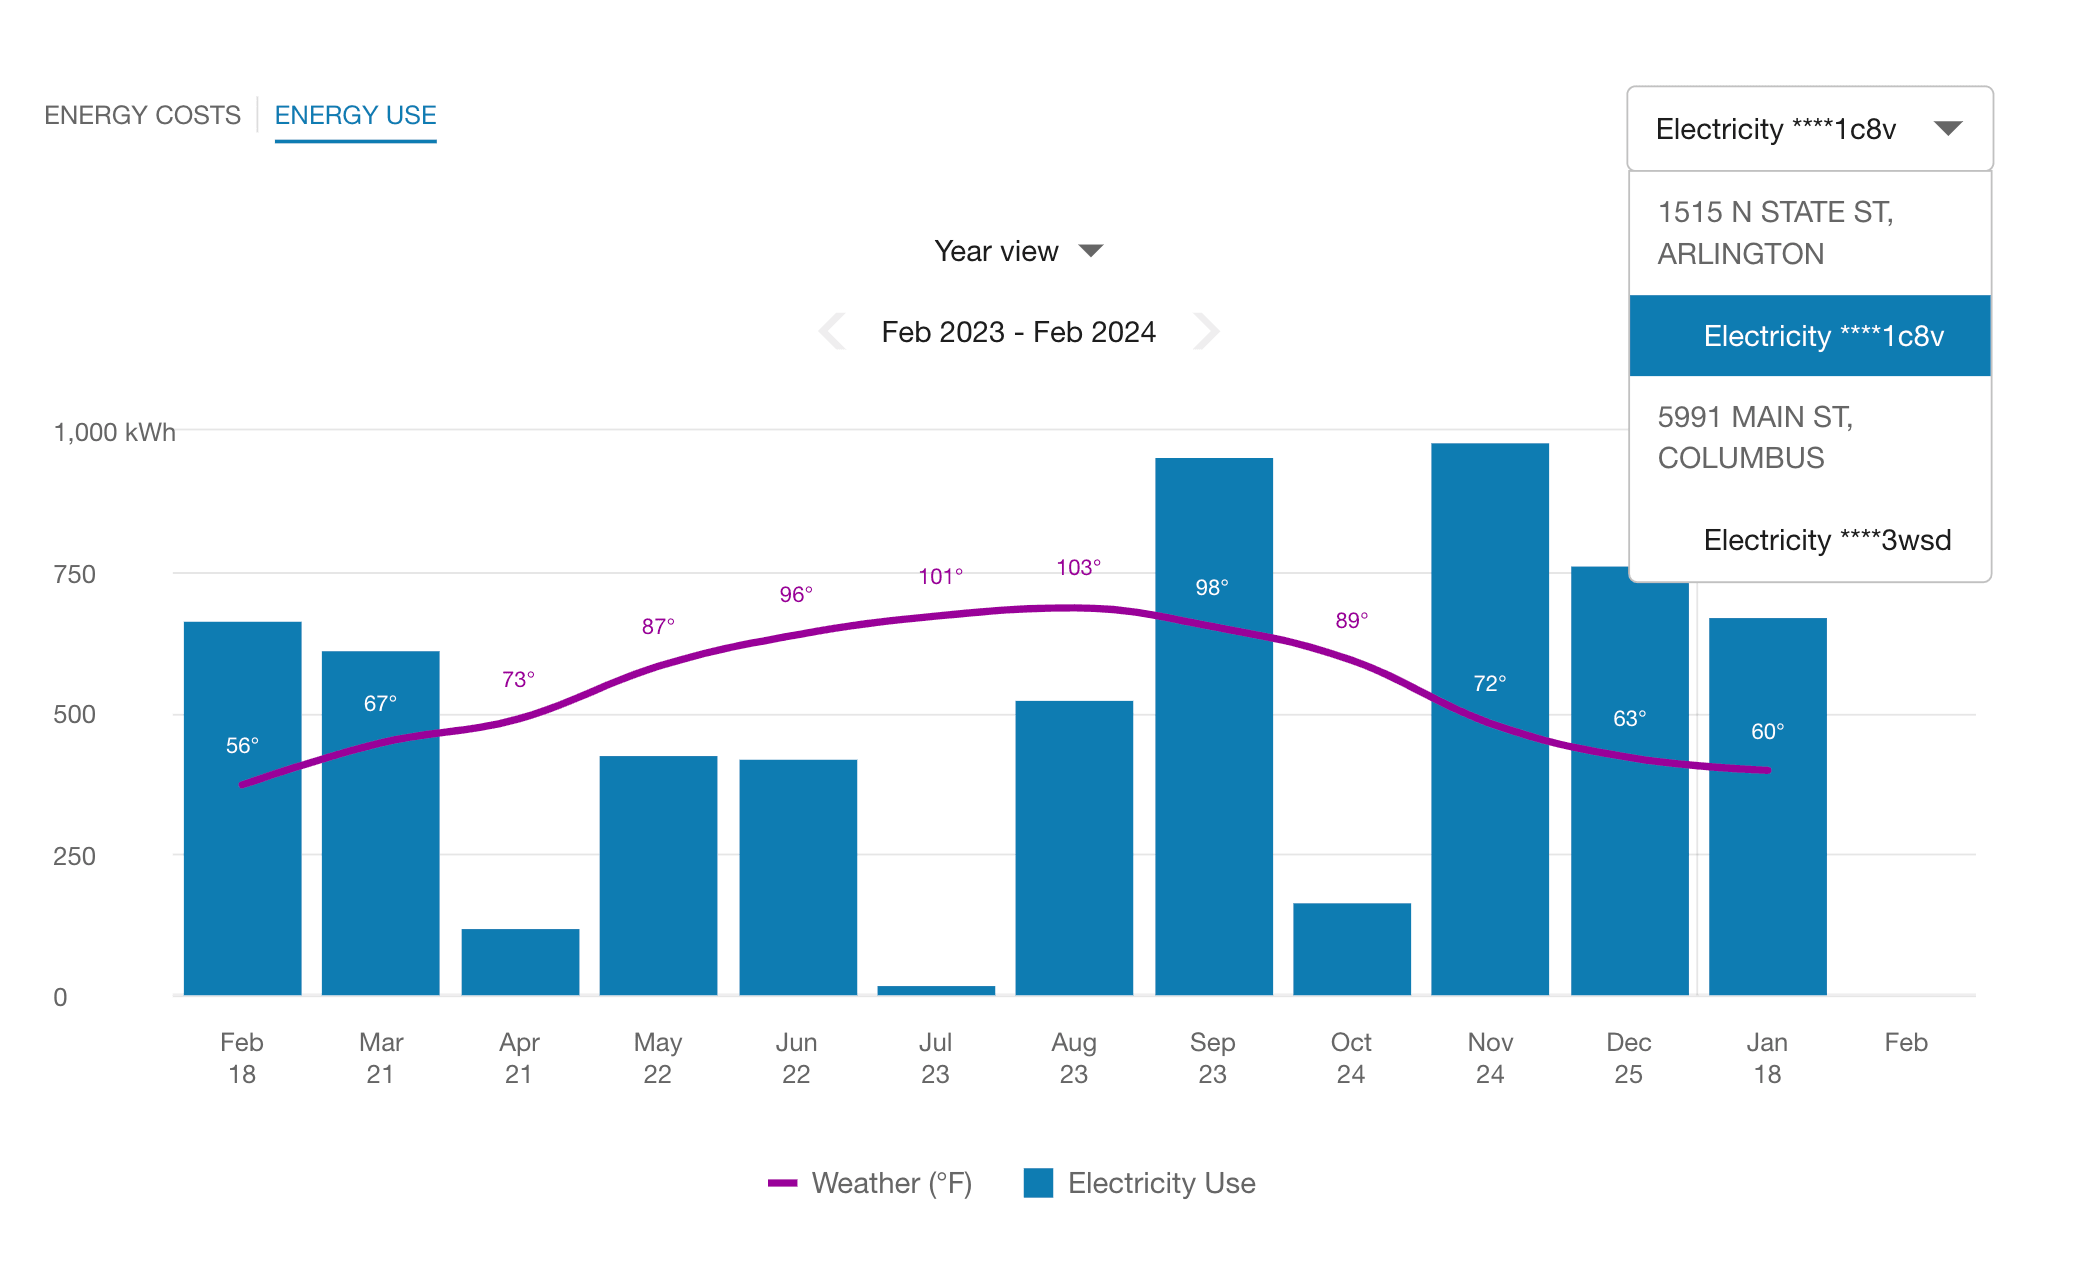
A premise is a location that receives energy service from the utility. If a customer has a billing account with multiple premises, then in the year view of the Data Browser, a menu displays a list of premises. The premises are represented as addresses. In the example below, each premise has one service agreement.
Premises will display in the bill and day views of the Data Browser as well, with service agreement or service point information grouped under them.
Multiple Service Agreements
A service agreement defines the type of service the premise receives, as well as the cost of that service. Even in the case of single-fuel utilities (for example, utilities that only provide electricity to customers), a customer could have multiple service agreements associated with a premise.
For example, a customer could have two or more electricity service points—one for a house and one for some other purpose like a shed or an electric vehicle—each of which could be under its own separate service agreement.
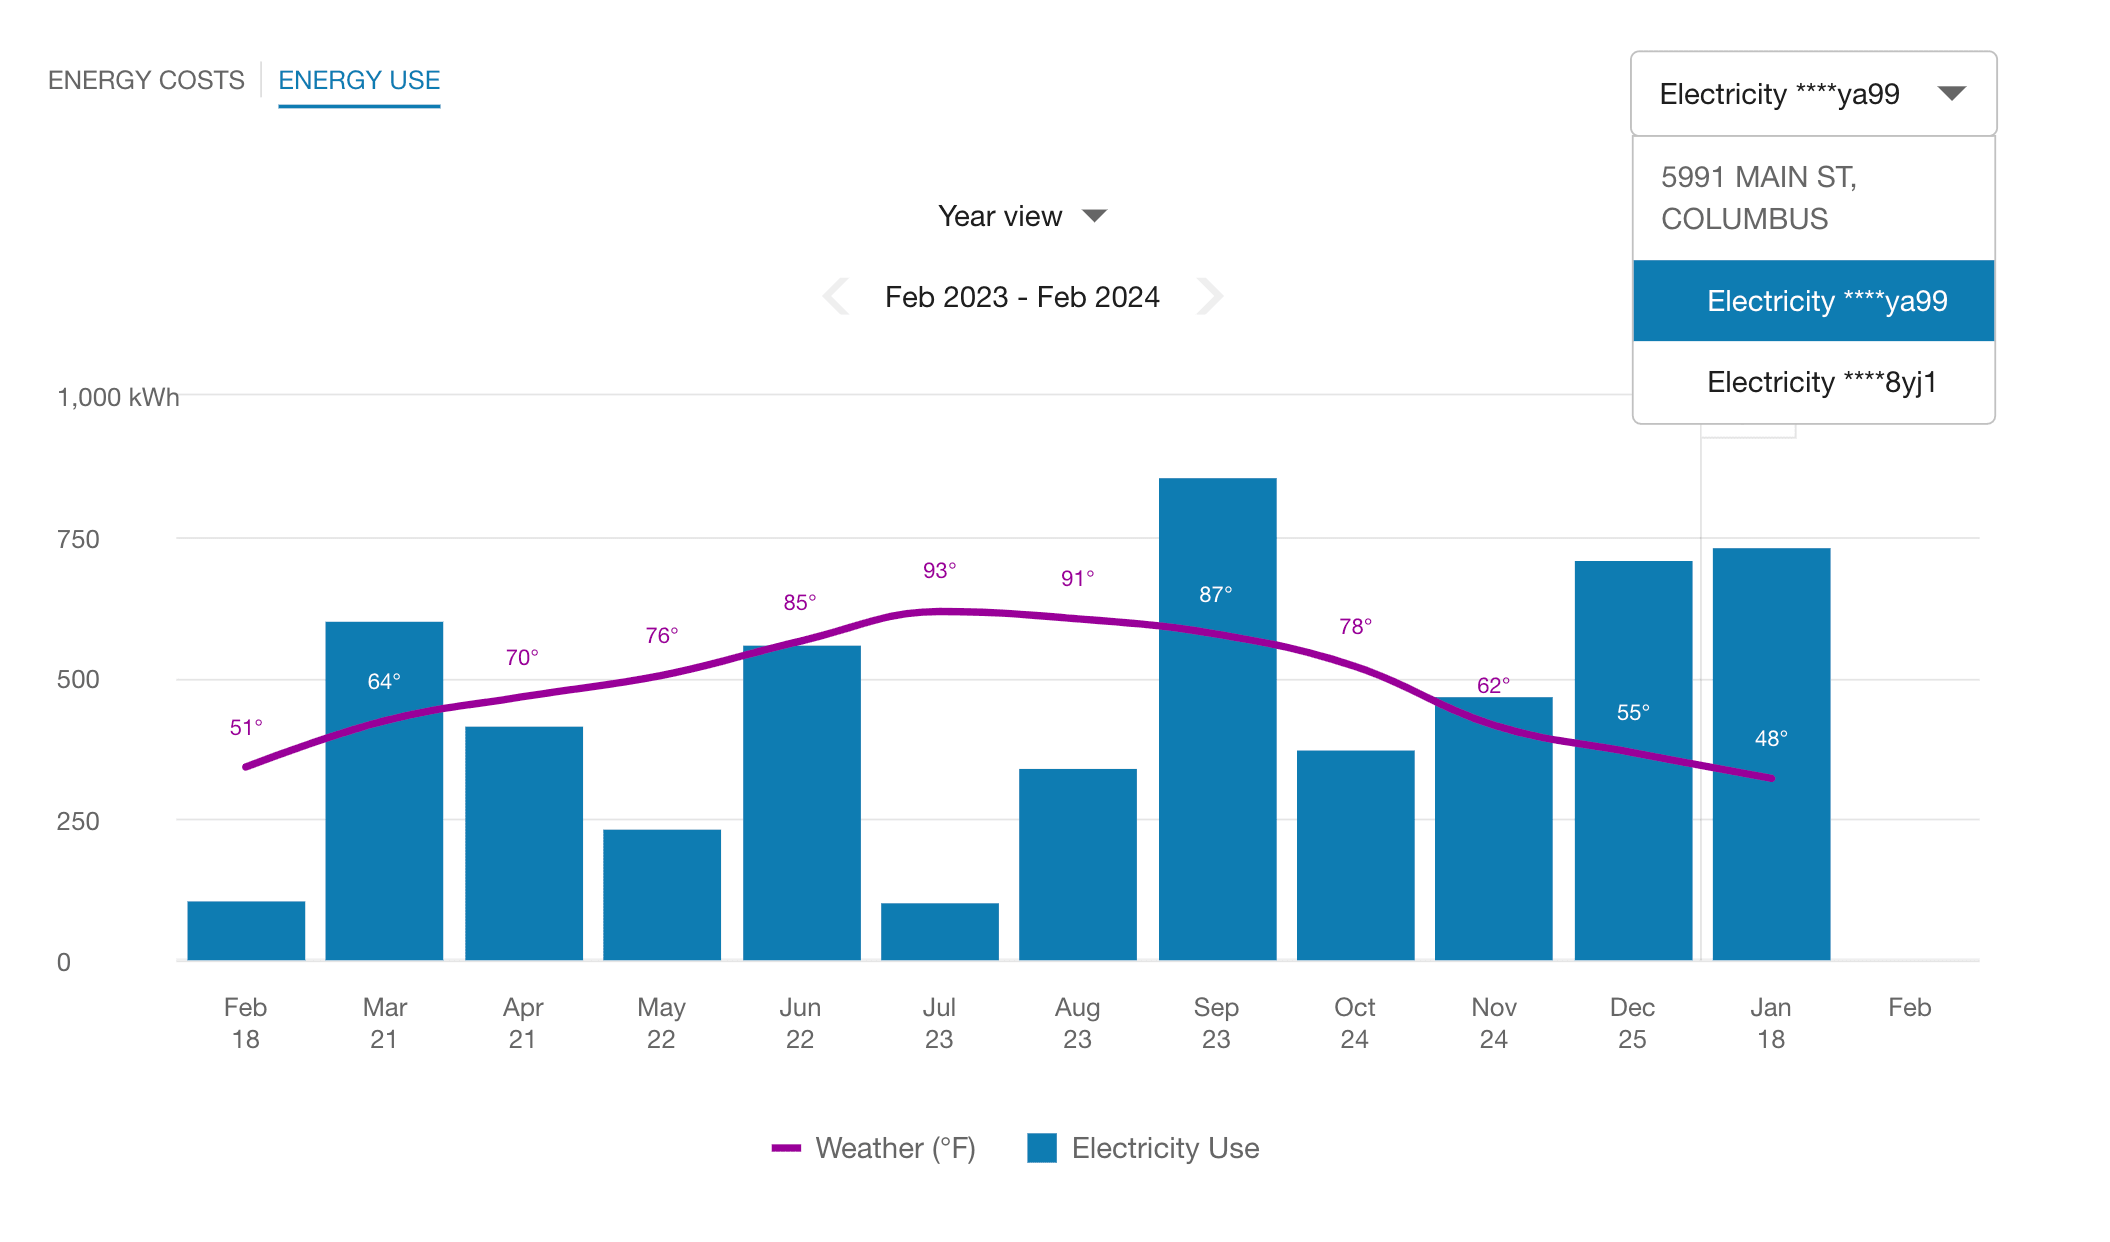
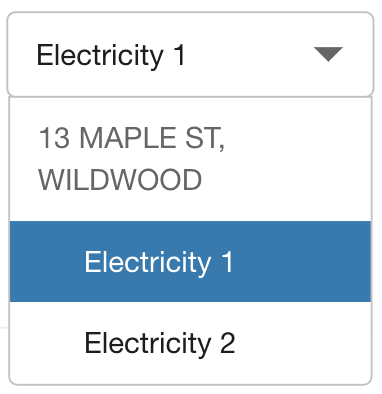
In such cases, in the year view of the Data Browser, a menu displays a list of service agreements grouped by premise. Customers can select a service agreement to see the usage associated with it. In the example below, the customer has a premise with multiple service agreements.
Multiple Service Points
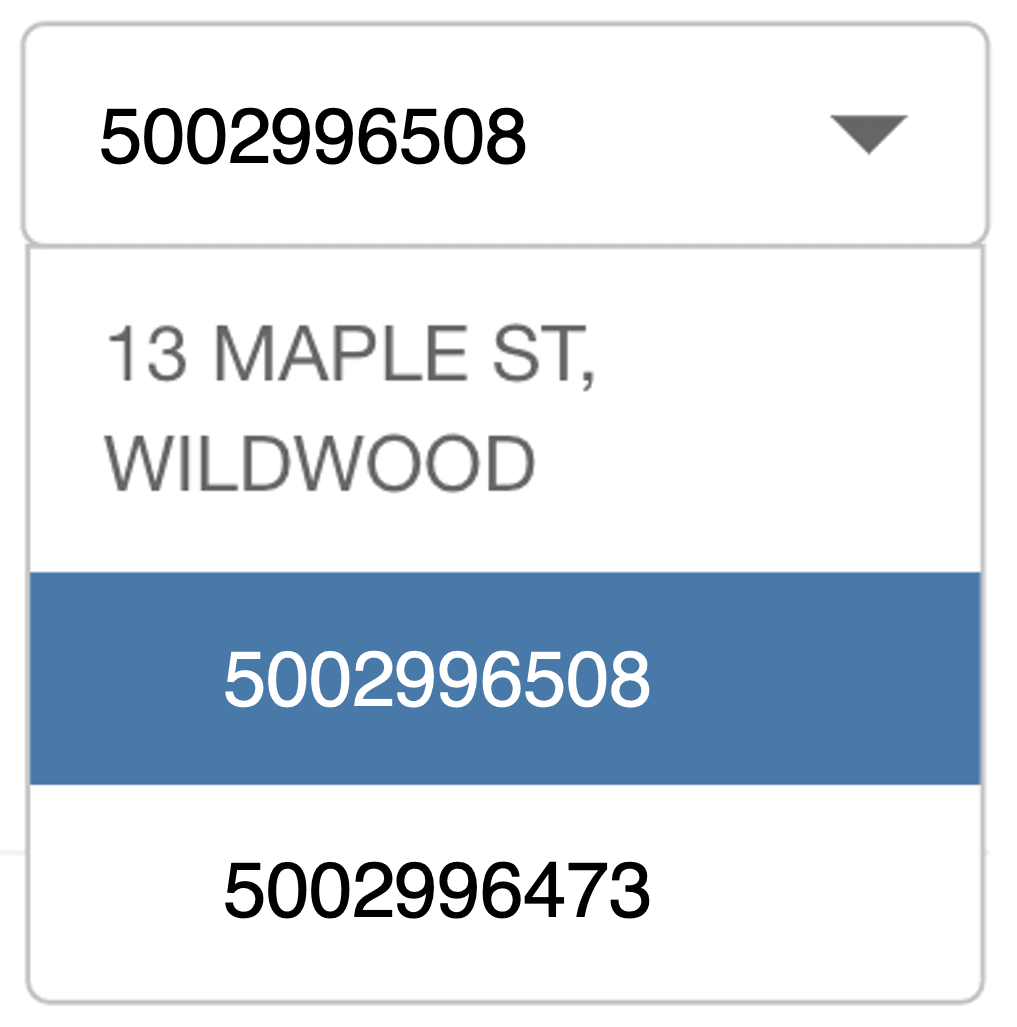
A service point is the physical channel through which gas or electricity flows into the home, unit, or building. If a customer has multiple service points within a premise, then in the bill or day view of the Data Browser, a menu displays a list of service points grouped by premise. Depending on your setup and configuration, either a simple number or service point ID is displayed. (The customer must navigate back to the year view in order to switch to a different premise.)
If a premise has multiple service agreements, each of which has one or more service points, then in the bill or day view of the Data Browser, a menu displays a list of service points grouped by service agreement. However, the service agreement value does not actually appear in the menu. The service point numbers or IDs display in the order in which the service agreements would be listed if they were shown.
For example, let's say there is a customer with the following premise and service agreements:
- Premise 1: 1234 Main Street
- Electric Service Agreement 1: 9876543210
- Electric Service Point 1: 11100097
- Electric Service Point 2: 11100013
- Electric Service Agreement 2: 3456789012
- Electric Service Point 3: 11100099
In this case, the menu would display all the service point IDs as follows:
- 1234 Main Street
- 11100097
- 11100013
- 11100099
The first two numbers, 1110097 and 1110013, are grouped together even though their associated service agreement is not shown.
Missing Data
As discussed above, all available data is displayed in the Data Browser even if there is missing data.
For the Year View and Day View, any missing bills, data reads, or weather data are displayed as missing data points on the graph. In the case of bar graphs, gaps will be shown for each interval of missing data. In the case of line graphs (such as the Neighbors View), a dotted line is displayed for the missing data point if the missing data is between other data points. If it is at the end, a gap will be shown with no line. The tooltips for these data points use hyphens in place of any missing data.
Customer Feedback
A customer feedback module can be displayed at the bottom of the Data Browser to collect input and inform ongoing improvements. See Customer Feedback for more information.