Efficiency Zone
The Efficiency Zone replaces the Neighbor Comparison in Digital Self Service - Energy Management for customers who receive the Efficiency Zone module in their Home Energy Report or Email Home Energy Report v3 experience. The Efficiency Zone module is designed to motivate customers to save energy based on how they see themselves in relation to similar homes. It reframes the Efficient Homes concept from the Neighbor Comparison to improve customer satisfaction without heavily compromising energy efficiency. The module is comprised of a bar graph that compares customer and similar homes usage against an Efficiency Zone, and insights that place the customer's usage in context. Usage below or up to the threshold is considered in the "efficiency zone." The Efficiency Zone threshold is the average use of the 20th percentile of similar homes during that bill period and will change with each report.
Note: If the utility opts to replace the Efficiency Zone module with the Neighbor Comparison module the Digital Self Service - Energy Management experience also includes the Neighbor Comparison.
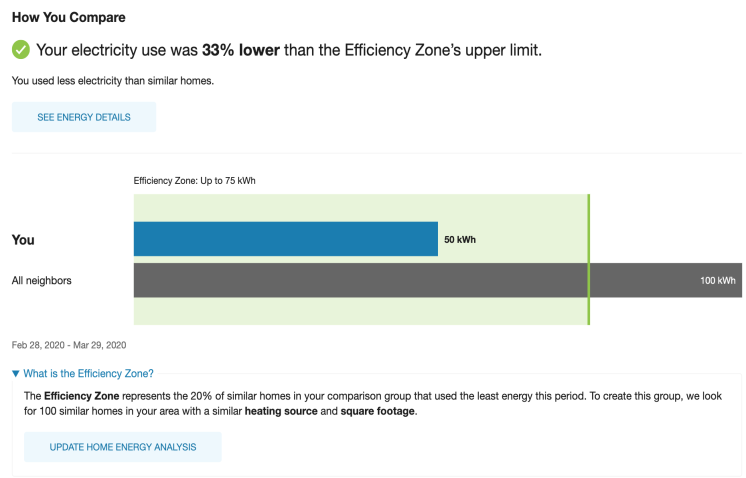
Heading: The heading invites the customer to explore their normative comparison and learn about their energy use in more detail.
Threshold: The label above the graph introduces the maximum Efficiency Zone threshold (for example, Up to 500 kWh). The threshold is the average use of the 20th percentile of similar homes during that bill period. A green tinted rectangle and darker vertical line indicate the range and upper boundary of the Efficiency Zone, enabling customers to quickly see whether they are in the zone. The threshold is recalculated and changes with each report.
Graph: The bar chart displays how much energy the customer (You) used in comparison with Similar Homes. The Similar Homes bar indicates the average use of the customer's neighbors.
Hero Insight Statement: The hero metric conveys the customer's status relative to the Efficiency Zone or to Similar Homes. The icon varies, depending on their state. If the customer is within the Efficiency Zone, a check mark icon before the insight is green. If the customer is not within the Efficiency Zone, the exclamation icon before the insight is grey.
Secondary Insight: The secondary insight presents the customer with their status relative to the other comparison group, either Similar Homes or the Efficiency Zone, depending on their status.
Date Range: The date range displays the time period that is covered by the comparison. The comparison always covers the last completed billing period. The year accompanies both the start date and end date (for example, Dec 20, 2019 – Jan 20, 2020).
What is the Efficiency Zone: When clicked, information about the characteristics that match between the customer's home and the homes they are being compared to is displayed.
Home Energy Analysis Call to Action: Clicking this button takes the customer to the DSS EM Home Energy Analysis - HEA so that they can provide the latest details about their home and make the efficiency zone more accurate.
Data Requirements and Limitations
- The customer must be billed on a monthly, bi-monthly, or quarterly basis.
- The customer must have monthly, bi-monthly, or quarterly data reads.
- The customer must have a single bill from the last bill period or previous to last bill period.
- The customer must have a minimum number of neighbors.