Bill Comparison
The Bill Comparison allows customers to compare their current bill to their previous bill and to the corresponding bill from the same time period the previous year. A statement indicates whether the customer is spending more, less, or about the same as the compared bill. The feature also highlights factors (such as weather or rate plan changes) that may have contributed to differences between the compared bills.
On this page:
Requirements
Utility Requirements
|
Category |
Description |
|---|---|
|
Required Cloud Service |
Same as listed in the product-wide requirements. |
|
Scale |
No applicable scale requirements. |
Customer Requirements
|
Category |
Description |
|---|---|
|
Billing Frequency |
Monthly, bi-monthly, and quarterly. |
|
Data Delivery Frequency |
Monthly, bi-monthly, and quarterly. |
|
Data Requirements |
Billing Data: Billed usage data from the utility is the minimum data requirement. Weather Data: Weather data is required for the weather insight to appear. The customer must have a minimum of nine months of historical AMI usage data with 75% coverage in order to calculate customer-specific rather than utility-wide heating and cooling coefficients. Peak Event Data: Peak event data (day and time of the peak event, as well as rebate amounts) is required for the peak energy savings insight to appear. The utility must also purchase the Peak Management: Peak Time Rebates cloud service. AMI Data: AMI data is required for AMI-based insights to appear. To use AMI data, utilities must purchase the Digital Self-Service Energy Management AMI cloud service. See Requirements and Limitations for details. Rates Data: |
|
Data History |
The customer must have two historical bills to compare energy use between bill periods. Billing data from the previous year's bill period is required for the year-over-year comparison. |
|
Data Coverage |
100% coverage of billing data is required for the bill periods being compared. (There can be no null reads for the bill periods being compared.) |
|
Supported Fuels |
Electricity, gas, and dual fuel. Water and Wastewater are also supported when the Bill Comparison is integrated as part of Digital Self Service - Transactions. |
Limitations
- Quarterly Bills: Utilities that use quarterly bills must send both energy use and cost data for the same billing period. The bill comparison will not work, for example, if monthly usage data and quarterly cost data are sent separately.
- Estimated Bills: If one of the compared bills was estimated (that is, if a bill is designated by the utility as "estimated" during the data transfer process), the billed usage amount will be shown with an indicator that the bill was estimated.
User Experience
This section describes the user experience for customers who have a desktop screen, gas and electricity, and rates modeled.
Fuel or Resource Menu
The fuel menu allows customers to select which fuel or resource to view a bill comparison for. By default, the Electricity fuel label and data is shown. An additional gas menu only appears for dual fuel customers.
Time Menu
The bill comparison can show a comparison between the current bill against the previous bill, or the same bill period from the previous year. A time menu allows customers to select which comparison to use. If data from the previous year is not available, only the previous bill period can be shown. By default, the Previous Bill label and comparison is shown.
A bill period from the previous year is defined as the bill period that overlaps the most with the current bill period. Customers can also use the This Bill drop-down in the bar chart to select a historical bill to review a previous bill comparison.
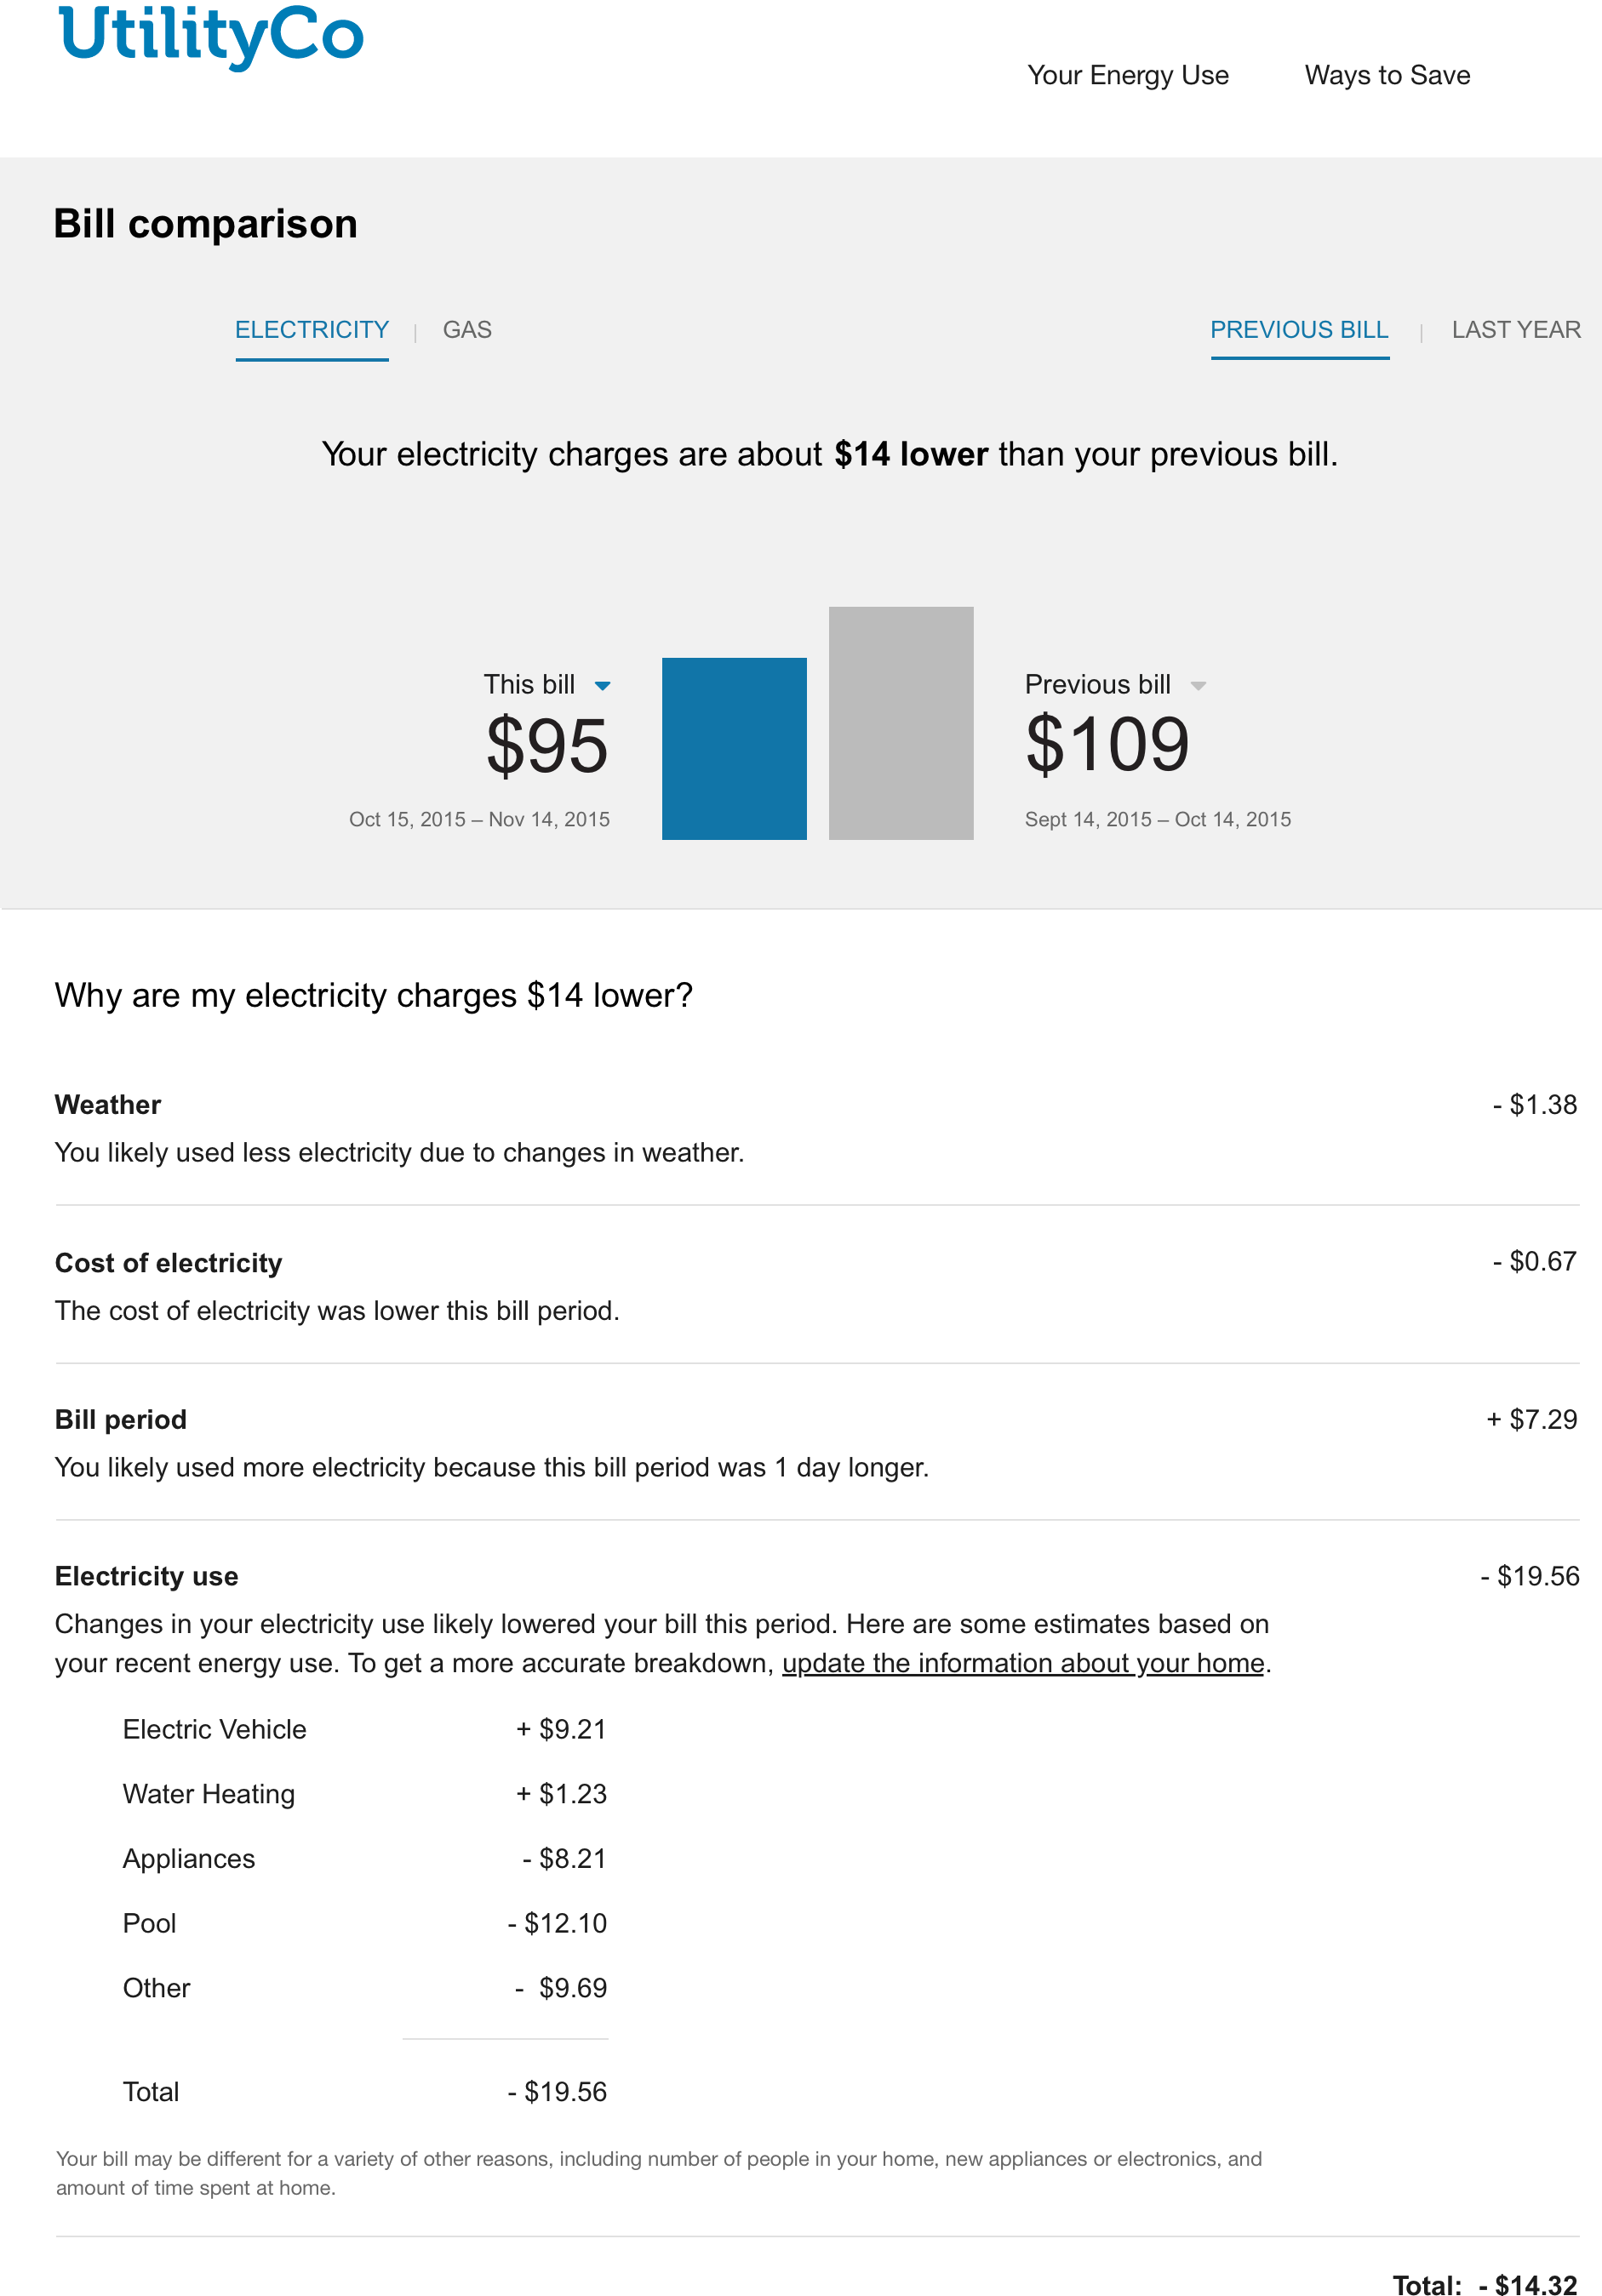
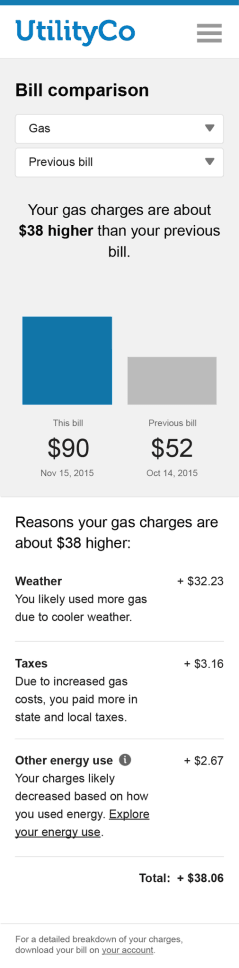
Insight Statement
Above the bar chart is an insight statement that explains whether the customer's bill is lower, higher, or about the same as the bill from the previous bill period, or from the same bill last year. If data from the previous year is not available, only an analysis against the previous bill period displays. A bill period from the previous year is defined as the bill period that overlaps the most with the current bill period. The messaging varies depending on the results of the comparison.
The cost of the difference is displayed in bold within the insight statement, if applicable. In some cases, there is no significant cost difference, and so none is shown. The dollar figures are rounded to the nearest dollar. For example, $1.51 would be rounded to $2, $1.50 would be rounded to $2, and $1.49 would be rounded to $1.
Bar Chart
The bar chart presents a visual comparison for customers so that they can see at a glance how their two bills compare. Annotations on the bars in the comparison graph identify the bill date, the number of days, and the cost amount of the compared bills. The bar for the current bill uses the "you" color, which is blue by default. The bar for the previous bill or last year's bill uses a gray color by default.
- This Bill: From this menu, customers can select a different historical bill to compare, if the data is available.
- Previous Bill: From this menu, customers to choose to view a comparison to the current bill, or to the same bill from the previous year.
Reasons for Bill Differences
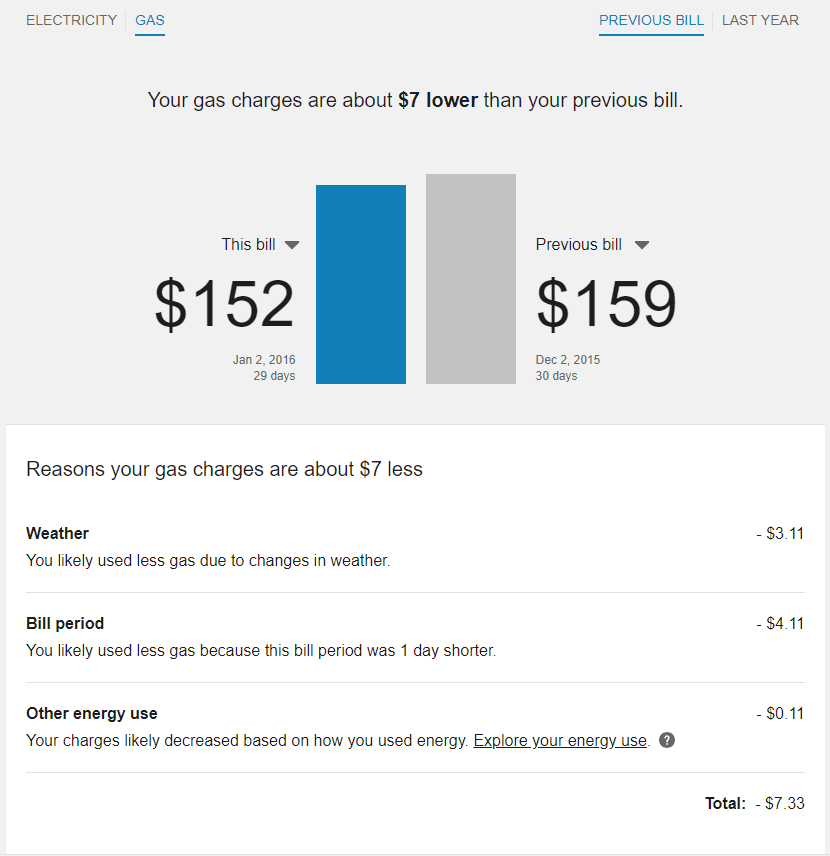
Comparisons for a higher or lower bill can include the most likely reason for the cost difference. Customers can view a list of insights explaining the difference, along with the contribution of each insight to the cost of the bill.
Bill Length Insight
This refers to differences due to a different number of days in the bill periods being compared. For example, one bill period might be 6/1-6/30/2020, whereas the other might be 6/10-7/9/2019. A bill period that has fewer days in it usually costs less than a bill period with more days. The calculation for determining the cost impact of this difference is as follows:
(Reference Bill Length - Compared Bill Length) / (Compared Bill Length)) * Compared Bill Amount
For example, suppose that the reference bill length (this month) is 29 days, and the compared bill length (the bill from last month or the same month last year) is 30 days. Let's also say that in the compared bill period, the customer's bill was $105. This means the calculation would be:
(29-30)/30 * 105 = -3.49999
Rounding is then applied to the nearest hundredth decimal point, which in this case would bring the number to -$3.50. This means the messaging would say that the customer used $3.50 less in the reference bill period than in the compared bill period.
Weather Insight
If sufficient weather data is available, the bill comparison can show differences due to changes in the weather. This insight only appears if weather data is available for both of the two periods being compared, and there is sufficient data to do weather normalization.
In the standard bill comparison experience, Oracle Utilities calculates the adjusted total usage for the compared bill periods using a weather normalization algorithm. The algorithm is based on Heating Degree Days, Cooling Degree Days, and weather sensitivity coefficients. See Weather Insight Calculation for details.
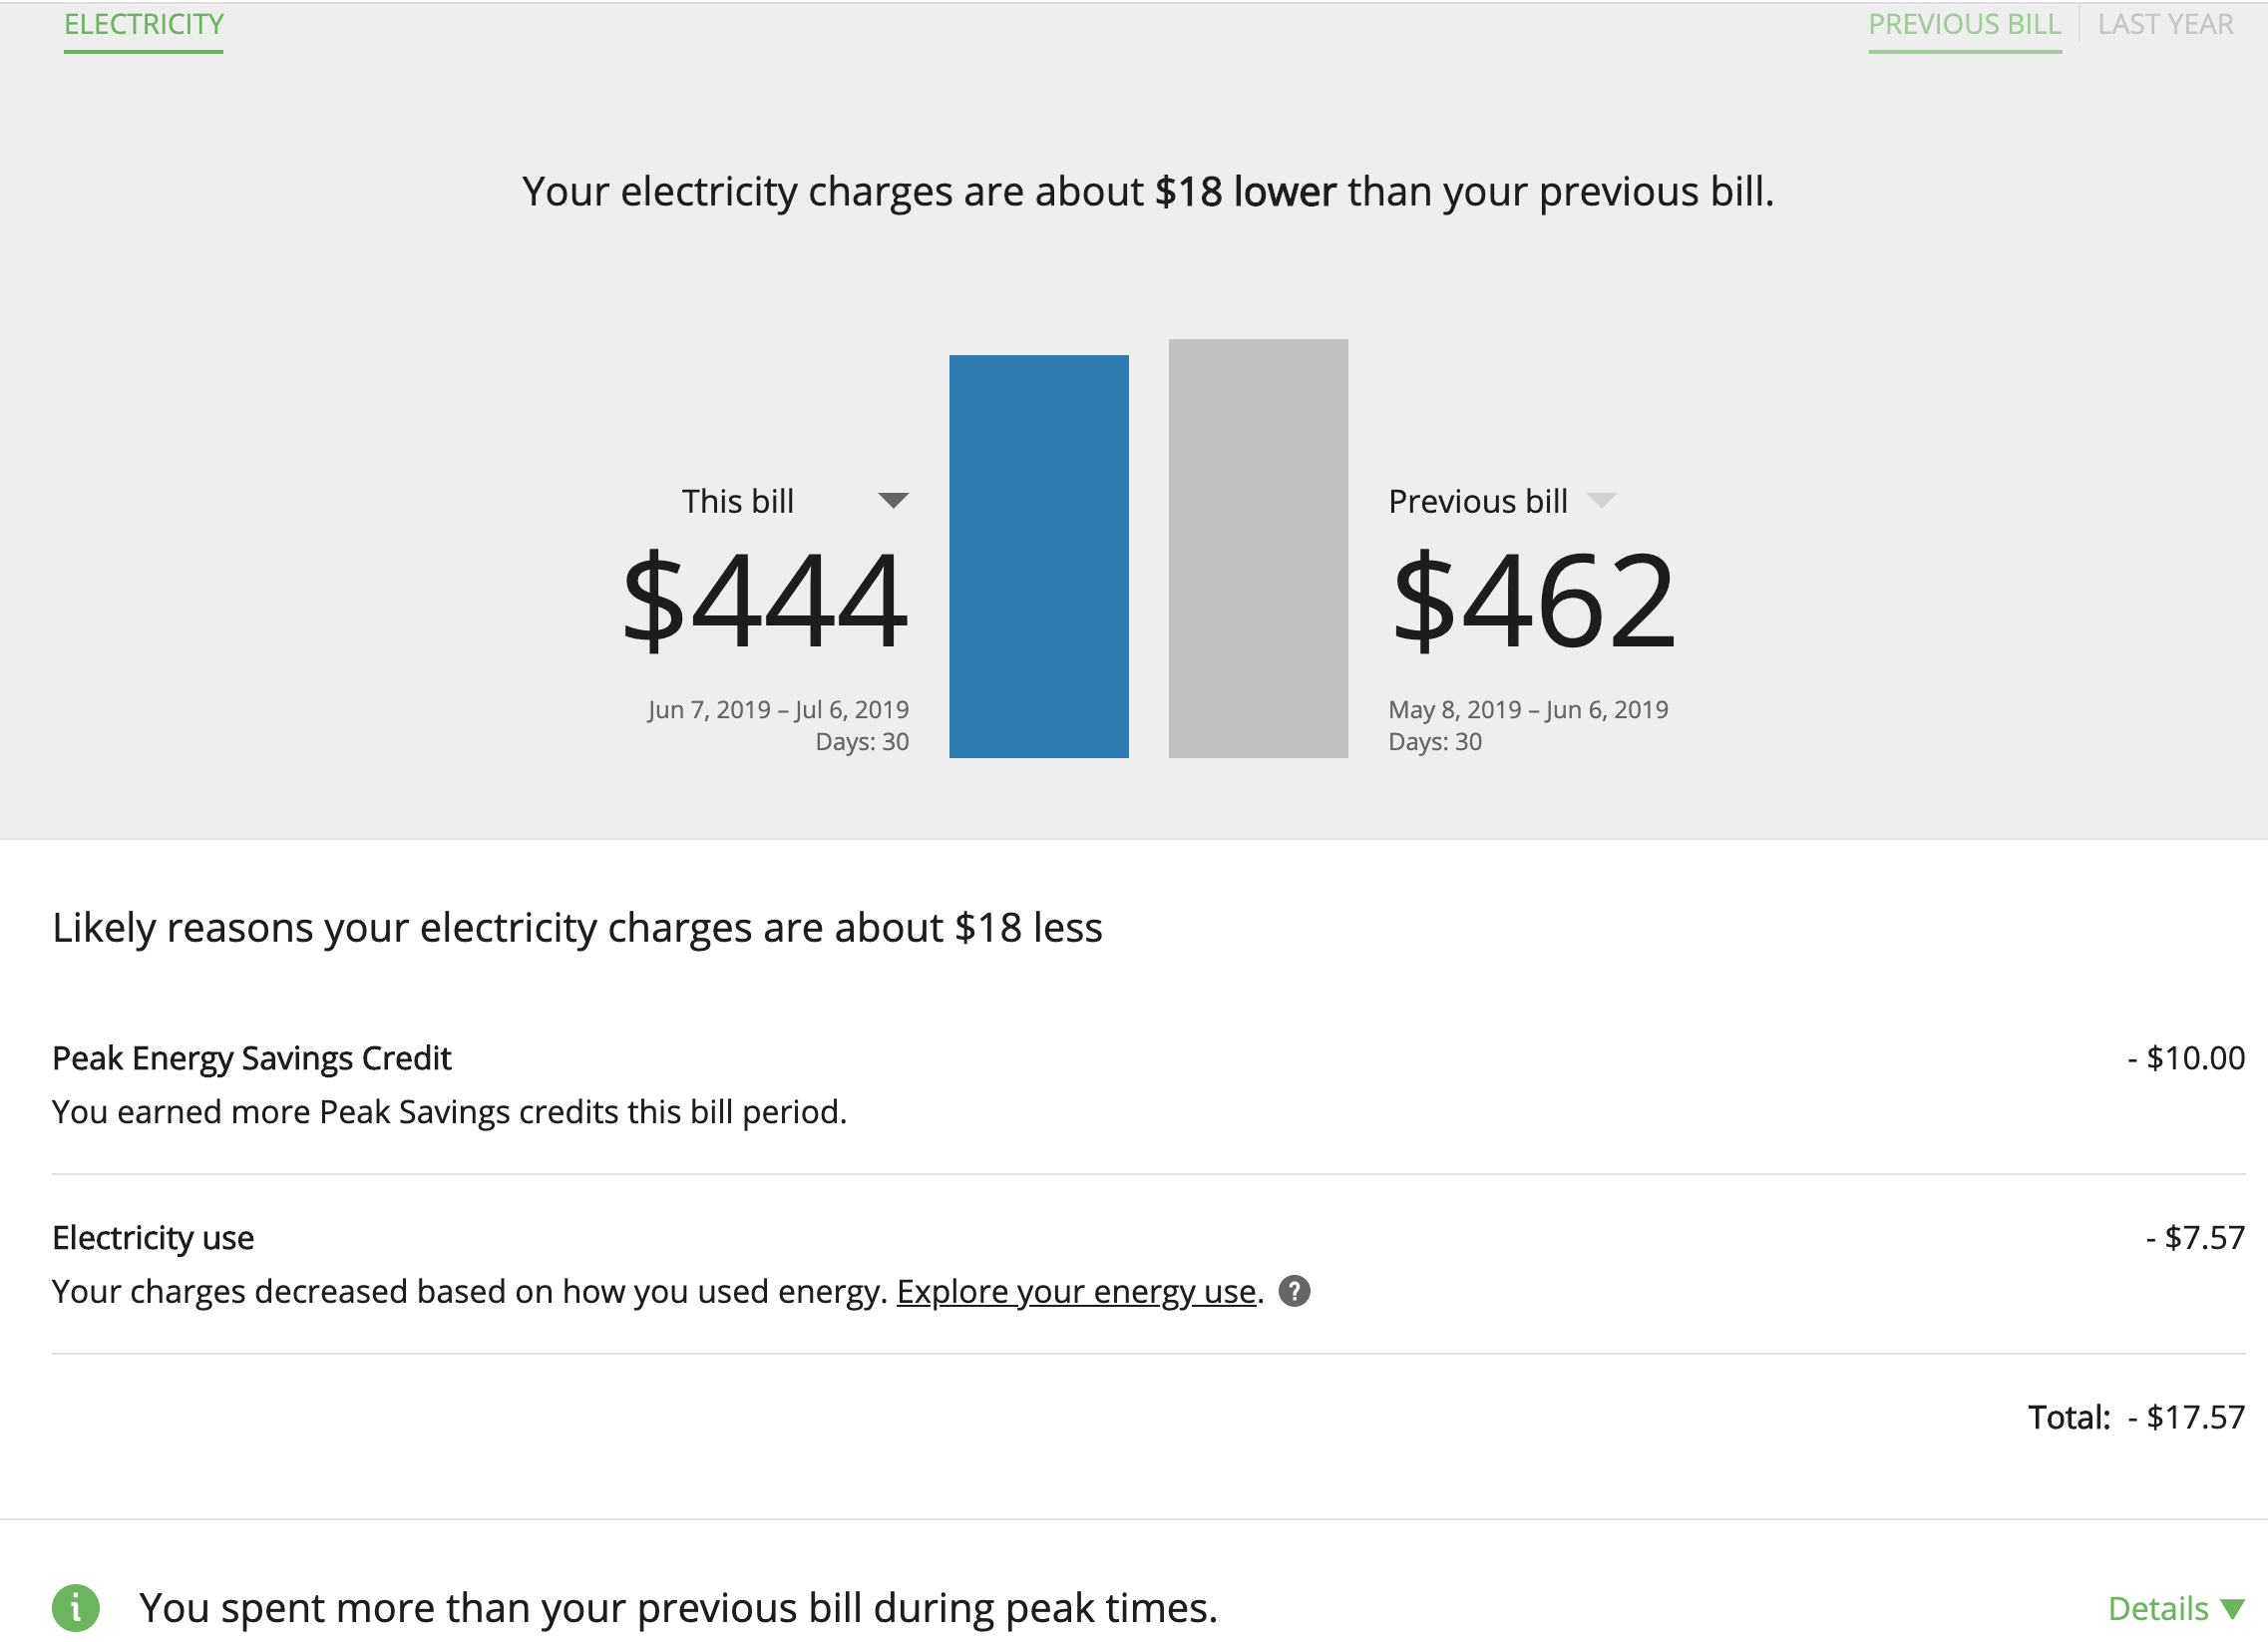
Peak Energy Savings Insight
Rebates received during peak events can be included in the list of cost differences when comparing bills. Peak energy savings credits reduce the total bill and are displayed as a negative credit value. Due to the nature of peak events, it is common that only one of the compared bills includes a peak energy savings credit.
Rate Plan Insight
The rate plan insight highlights cost differences in bills due to the customer switching rate plans. This information can only appear if the customer's rate plan is different for the two bills, and both rate plans have been modeled in the Rate Engine. The cost of the reference period's usage on the previous rate plan is calculated and subtracted from the cost during the reference period on the actual rate plan to determine the difference. Note that differences in prices between bills charged on the same rate plan are not called out separately.
A rate plan in the Oracle Utilities Opower system has two parts: a base plan and one or more components added onto it. For example, a base plan may be an electricity plan for residential customers in a utility's territory, but different versions of that plan could be: (1) electricity residential customers on a community assistance program, and (2) electricity residential customers on a solar plan. The rate plan change insight can be triggered if a customer moves from one of these combinations to another, even though the base plan—electricity residential customer—is the same.
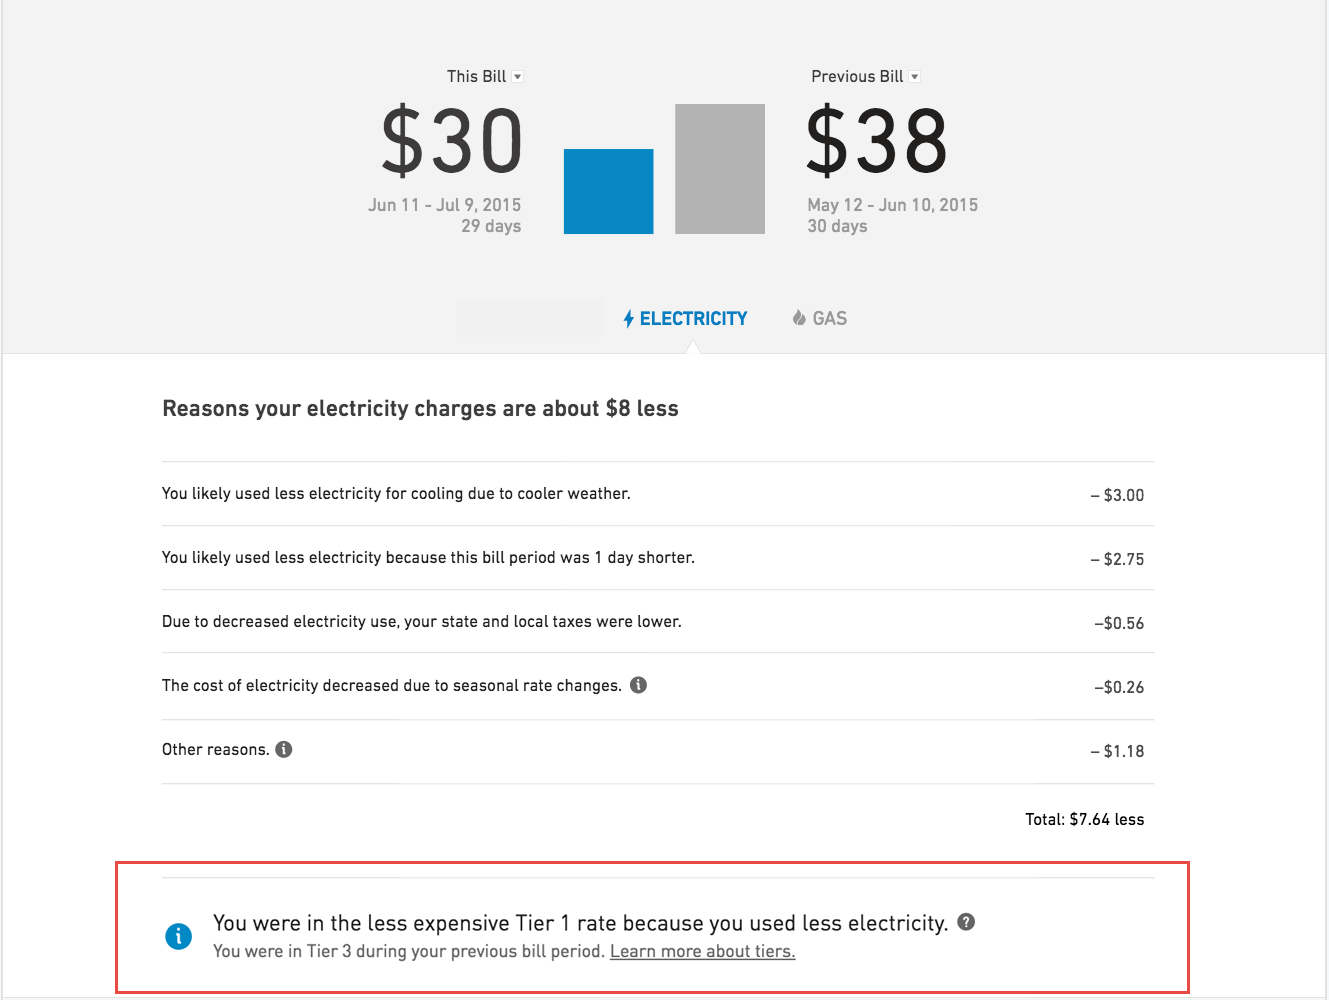
Rate Tier Insight
For customers on a tiered rate plan, the bill comparison can display cost differences due to being on a cheaper or more expensive rate tier between bill periods. The switch between rate tiers depends on how much energy the customer uses.
Requirements:
- Rates must be modeled. See Rate Modeling for details.
- The rate plan structure must not be substantially different from those which the tool already supports. Contact your Delivery Team for more information.
- The customer's tier has changed between the bills being compared.
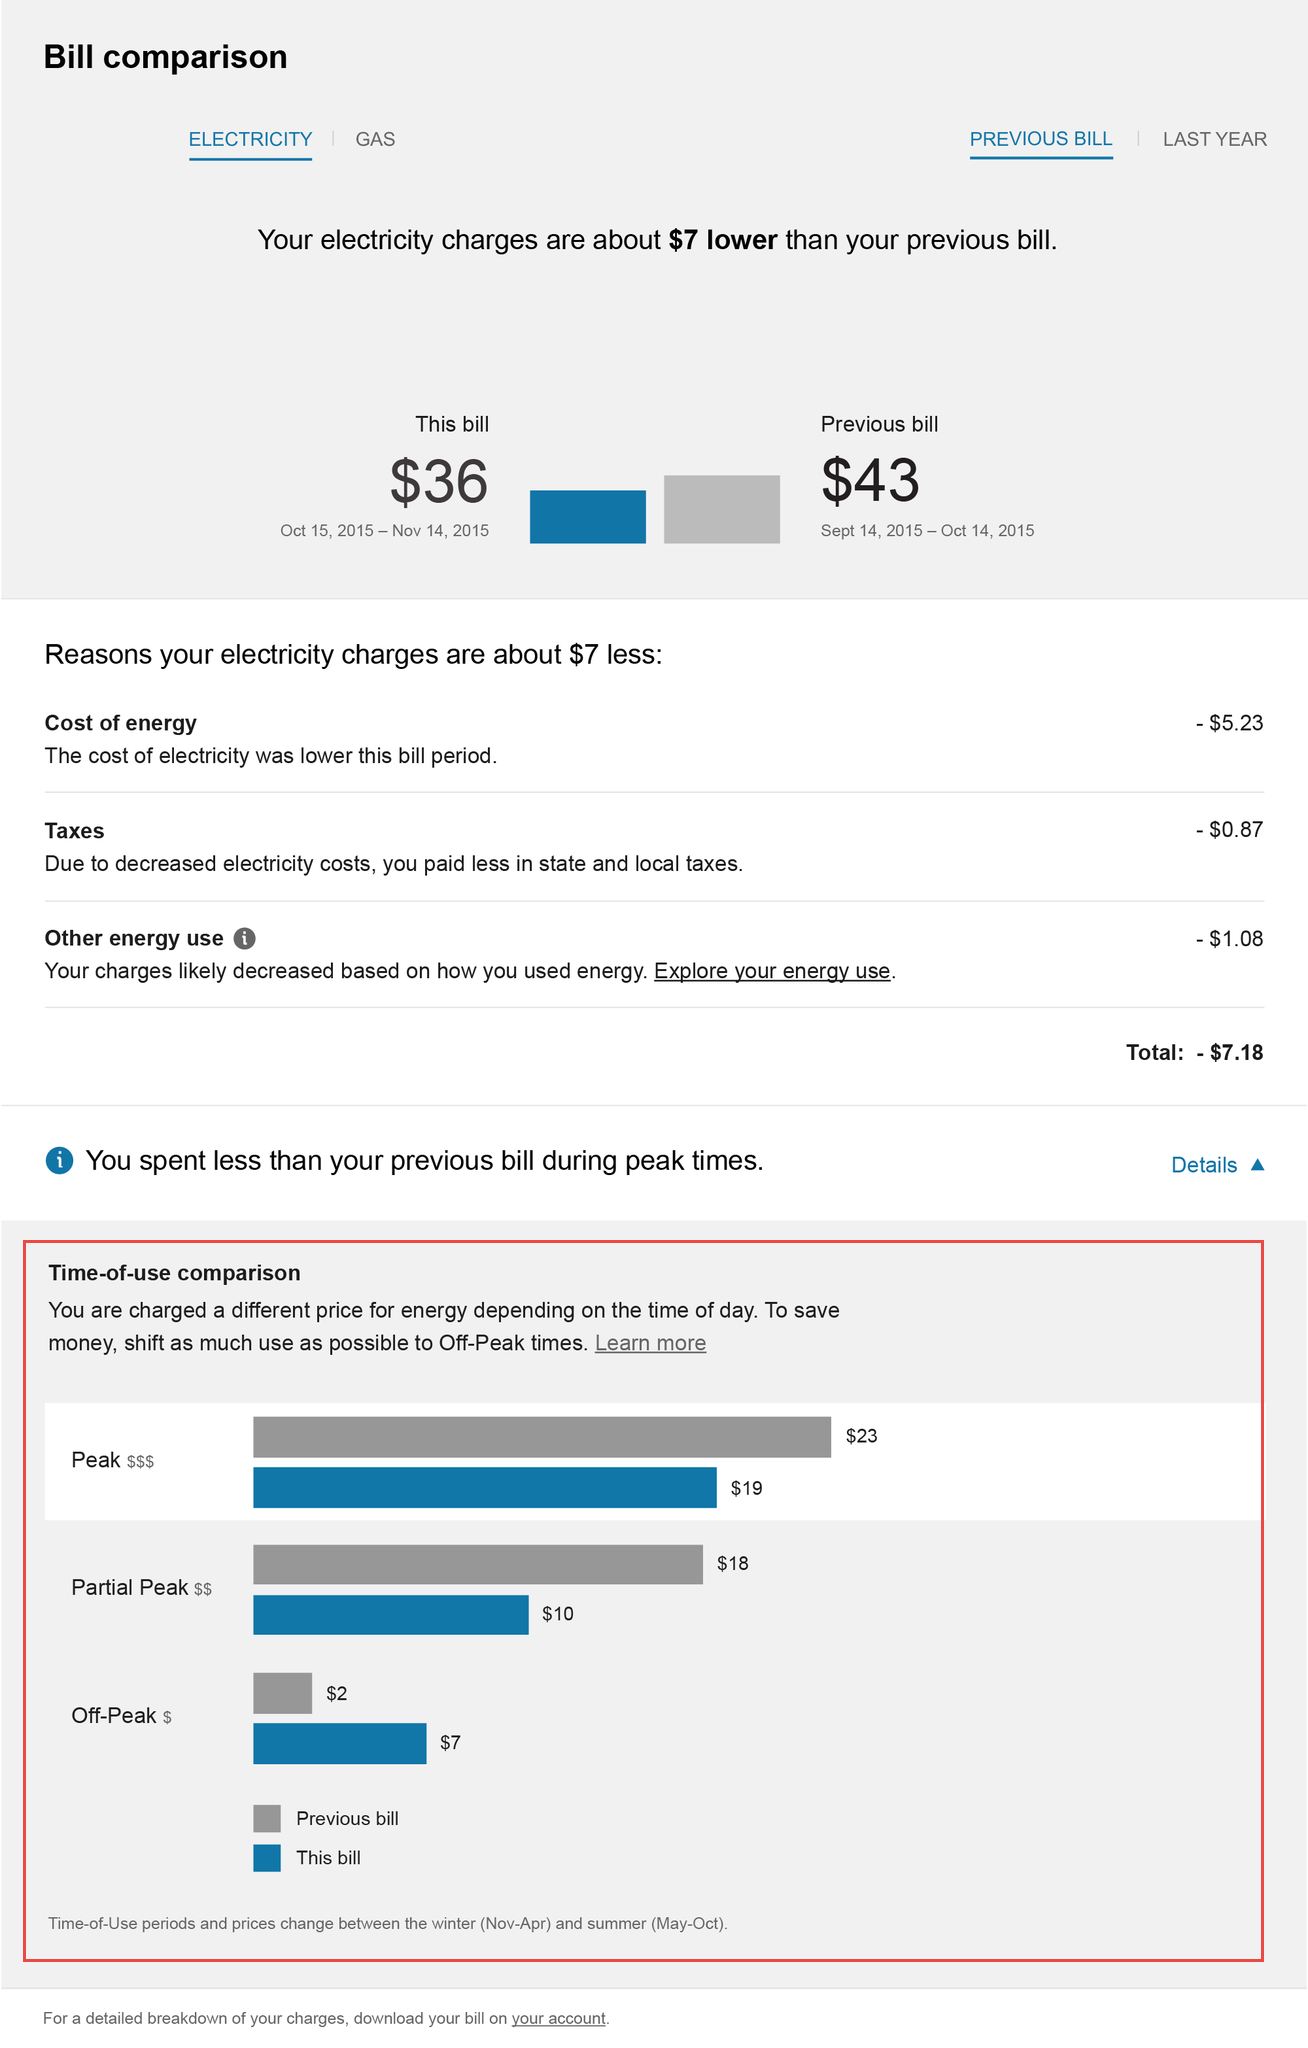
Time of Use Insight
Information about a customer's energy costs due to time-of-use rates can be displayed below the cost difference information, if a utility applies different rates during different times of day.
Requirements:
- Rates must be modeled. See Rate Modeling for details. For more information and examples about modeling a time of use (TOU) rate plan, see Rates Data File Specifications - Time of Use Rate Plan.
- The rate plan structure must not be substantially different from those which the tool already supports. Contact your Delivery Team for more information.
Appliance Disaggregation Insight
Appliance Detection and Disaggregation insights can be displayed below the cost difference information. These insights explain how much of the cost difference between bills was due to changes in large appliance use (such as electric vehicle charging, water heating, or HVAC systems). This allows customers to better understand how their behavior affects their utility bill. Customers can increase the accuracy of the cost comparison by completing the Home Energy Analysis.
Requirements: Appliance disaggregation insights require more data in addition to the base data requirements. For example, for the year-over-year comparison, 13 months of historical AMI data is required. Other requirements as well as setup and configuration apply. Contact your Delivery Team for more information.
Solar Insights
Differences due to the use of solar technology. While negative bills can be shown in the interface whether or not a customer has solar technology, additional solar insights can be displayed if the utility has purchased the Distributed Energy Resources cloud service. See Solar Messaging in Bill Comparison for details.
Critical Peak Pricing Insights
For customers who are part of a critical peak pricing program, information about critical peak pricing charges and credits can be displayed below the cost differences section of the feature. This information may explain to customers how they can save energy on certain critical peak days in order to earn credits on their bills. Additionally it can display a bar chart that summarizes the customer's charges and credits in the current and previous bill periods.
Requirements:
- Rates must be modeled. See Rate Modeling for details.
- Peak event data (day and time of peak event, as well as rebate amounts) is required.
- The rate plan structure must not be substantially different from those which the tool already supports. Contact your Delivery Team for more information.
Non-Usage Insight
Differences due to changes outside of a customer's normal energy consumption, such as taxes, flat fees, and adjustments. This information allows the Bill Comparison to better match the amounts that customers see in their bills. Displaying this information may require additional setup and configuration. Contact your Delivery Team if you have any questions.
Other Factors
Differences due to factors not explained by the above reasons. Such reasons could include being on vacation, buying a new appliance, or having additional people at home. A call-to-action link is included with this insight, directing customers to the interactive Data Browser.
Customer Feedback Module
A customer feedback module is displayed at the bottom of the Bill Comparison. See Customer Feedback for more information.
User Experience Variations
Locale
This feature can display locale-appropriate language and units of measure. Additionally, this feature may compare quarterly bills as opposed to monthly or bi-monthly bills, since quarterly bills are more common in non-US locales.
Mobile Experience
The experience of the bill comparison for smaller mobile screen sizes consists of the same components as the desktop experience. However, the layout changes to fit the smaller screen size by stacking the components vertically.
Multiple Accounts
The multiple accounts experience varies depending on whether the feature has been configured for a standalone implementation or an embedded implementation.
In a standalone implementation, the Bill Comparison shows a drop-down list that allows customers to choose which account to view. This drop-down list replaces the fuel type toggle.
In an embedded widget implementation, the account drop-down is hidden since the utility site is expected to have its own account selection tools. In this case, customers can switch between their accounts by logging into their utility account using single sign-on, and then clicking an account selector hosted on the utility website. All embedded widgets are then reloaded with data for the specified account.
Multiple Service Agreements
A drop-down menu is displayed if there are multiple service agreements for a billing account. If your customer has multiple service points (that is, multiple meters) for a single service agreement, the drop-down menu will not display.
The example below shows a case where a customer has a single gas service agreement and two electricity service agreements.

Negative Bill
Customers with a negative bill are shown the negative bill value, along with a message that explains the reason for the negative bill. The bar for the negative value uses a green color. A common cause of a negative bill is a utility applying a credit to the customer's account. Or, customers with solar technology might have produced more electricity than they used.
Quarterly Reads
If a customer has quarterly reads, the comparison will be between quarterly bills, with each bar representing a three-month period. The labels under the bars will show the start and end dates of the bill period, which will be in separate months. The cost and usage values will likely be higher because of the longer bill period. Furthermore, the feature will take longer to display data for a new quarterly-billed customer, because the feature requires two bill periods (or 6 months of data) before a comparison can be shown.
Single Fuel
If a customer only has one fuel type (such as electricity but not gas), then the Bill Comparison widget displays the label for the fuel type by default. However, utilities can choose to hide this label during the setup and configuration process.
Water and Wastewater Customers
When integrated as part of Digital Self Service - Transactions, water and wastewater customers can use the Bill Comparison widget to compare their water or wastewater bills in many of the same ways that customers can compare electricity and gas bills, providing a consistent bill comparison experience.
Insights for water and wastewater customers include a Days in Bill Period insight and Other Water Use insights. Other insights, such as weather and rate plan insights, are not currently available for water and wastewater services.
Calculations
Bill Comparison
The bill comparison calculation compares a customer's energy use and/or cost against the previous bill period, or against the same period from the previous year. At a high level, the calculation involves the following steps:
- Identify the start and end date of the selected bill.
- Identify the amount of energy consumed in the billing period, as well as the cost of the bill.
- Identify the average temperature during the selected bill period (if weather data is available).
- Check whether there was a change in the customer's rate plan.
- Retrieve the same information for the compared bill.
- Compare the information and generate a statement about how the customer is doing, as well as reasons why there may be a difference between the billing periods.
Weather Insight
The Bill Comparison feature estimates how much the customer would have spent during each compared bill period if weather conditions had been identical. The bill costs are adjusted as a result, and the likely impact of weather is the difference in cost between the two adjusted bills. This difference is then displayed as the weather insight.
Note: The weather normalization calculation does not use the Oracle Utilities Opower Rate Engine to calculate the dollar amount attributed to weather, even if rates are modeled at a given utility. Instead it relies on bill charges and energy usage amounts for both the selected and reference bills.
More specifically, the feature calculates the adjusted total for each compared bill period using a weather normalization algorithm. The weather normalization algorithm is based on the following inputs:
- Cooling Degree Days (CDD): A measure of how warm a location is over a period of time relative to a base temperature, specifically 65°F. You get CDDs when the average temperature of a day is over 65°F. For example, if the average temperature for a single day is 67°F, then the CDD for that day is 2, since it is two degrees over the base temperature. CDDs are proportional to the amount of cooling energy usage. The more CDDs, the more energy is used to cool a home or building.
- Heating Degree Days (HDD): A measure of how cold a location is over a period of time relative to the same base temperature, 65°F. For example, if the average temperature for a single day is 55°F, then the HDD for that day is 10, since it is ten degrees under the base temperature. HDDs are proportional to the amount of heating energy usage. The more HDDs, the more energy is used to heat a home or building.
- Weather Sensitivity Coefficients: These coefficients are defined on a per-utility, per-fuel-type, and per-dwelling-type (if available) basis. If enough customer data is available, then the Bill Comparison can use customer-specific heating and cooling coefficients rather than utility-wide coefficients. Customer-specific coefficients result in more accurate and personalized assessments of how much money a customer spent or saved on their bill due to variations in weather. At minimum, nine months of historical AMI usage data and 75% data coverage are required for customer-specific coefficients. If there is not enough data, the feature will fall back to utility-wide coefficients.
Using these inputs, the weather normalization calculation performs the follow high-level steps:
- Get the average temperature on each day of the current period and each day of the comparison period.
- Derive the average heating degree days (HDD) and cooling degree days (CDD) for each period.
- Calculate the difference in HDD and CDD between the periods.
- Use the difference in HDD and CDD, along with utility-specific heating and cooling coefficients, to calculate an "adjustment factor."
- Multiply the adjustment factor by the amount of energy usage from the bill period in question. The resulting "adjusted" usage data (or "normalized" usage data) can then be displayed to customers.
With weather normalization, the comparison between bill periods is more fair than making an unadjusted comparison, since it accounts for differences in weather conditions. The calculation automatically corrects for differences in bill length.